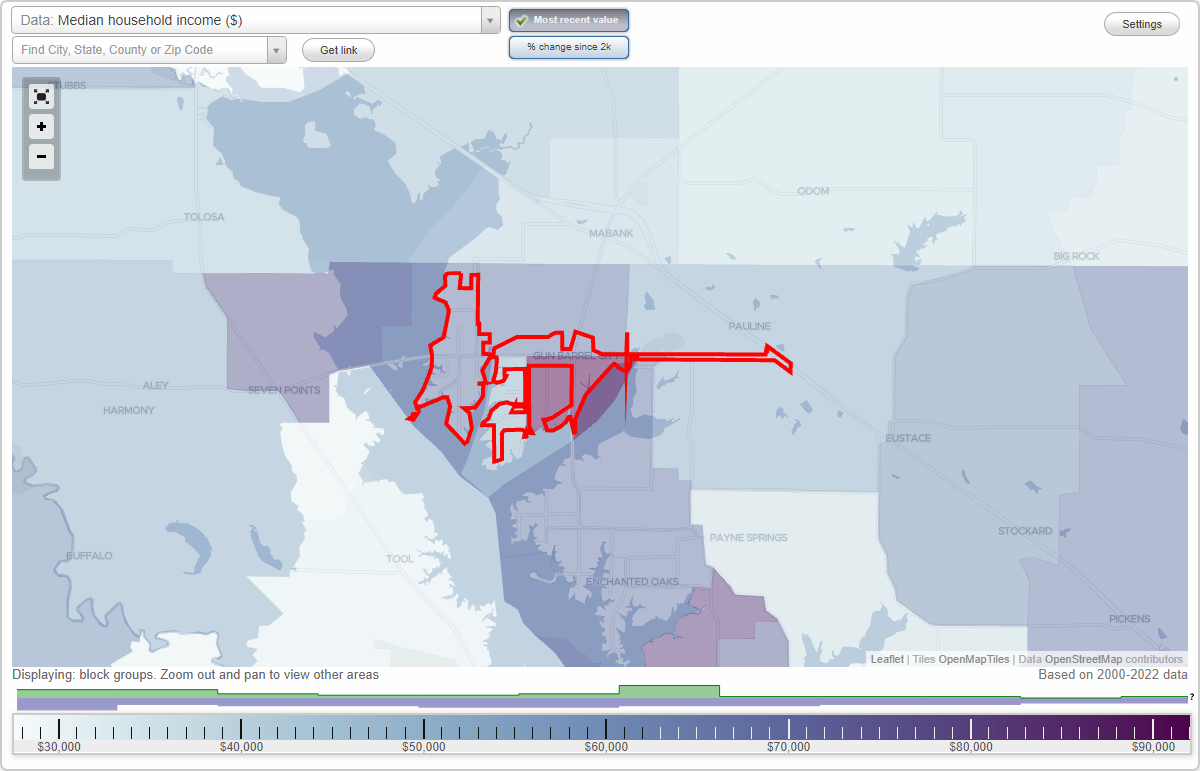
The median household income in Gun Barrel City, TX in 2022 was $69,826, which was 3.5% less than the median annual income of $72,284 across the entire state of Texas. Compared to the median income of $30,075 in 2000 this represents an increase of 56.9%. The per capita income in 2022 was $40,232, which means an increase of 47.7% compared to 2000 when it was $21,046.
Whole page based on the data from 2000 / 2022 when the population of Gun Barrel City, Texas was 5,145 / 6,389
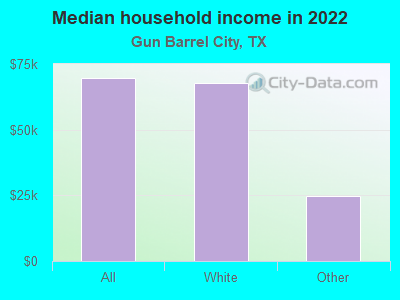
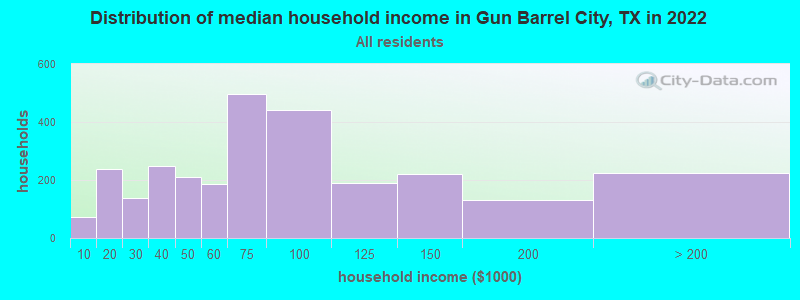
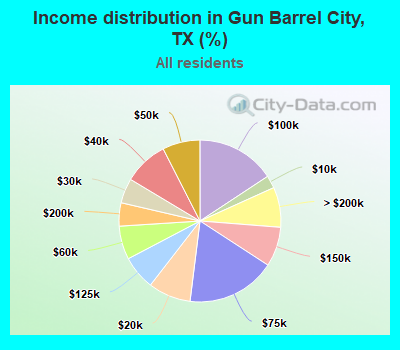
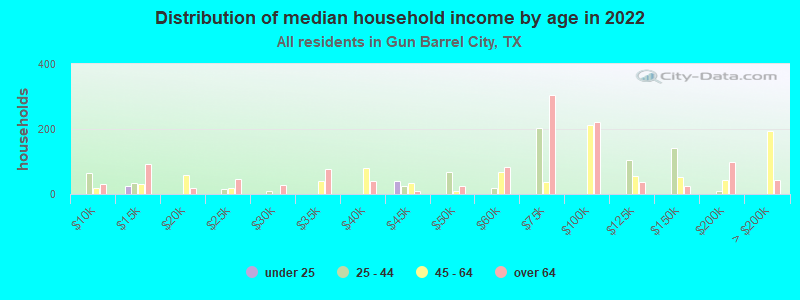
Income statistics for all residents
Median household income in Gun Barrel City, TX in 2022:
Gun Barrel City:
$69,826
State:
$72,284
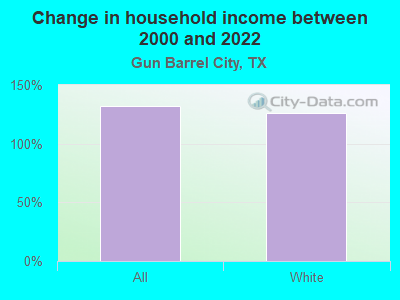
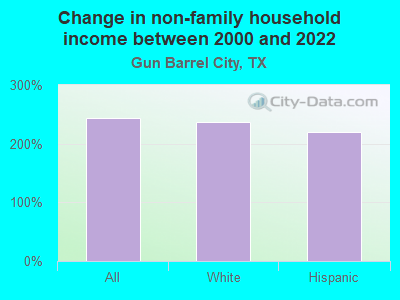
Change in median household income between 2000 and 2022:
Gun Barrel City, Texas:
+132.2%
State:
+81.0%
Number of households with income < $10k:
Gun Barrel City:
2.5% (71)
State:
5.5% (611,011)
Number of households with income $10k - 20k:
Gun Barrel City:
8.5% (238)
State:
6.7% (743,157)
Number of households with income $20k - 30k:
Gun Barrel City:
5.0% (139)
Texas:
7.2% (803,381)
Number of households with income $30k - 40k:
Gun Barrel City:
8.9% (249)
State:
7.8% (866,080)
Number of households with income $40k - 50k:
Gun Barrel City:
7.5% (210)
Texas:
7.3% (810,440)
Number of households with income $50k - 60k:
Gun Barrel City:
6.7% (187)
State:
7.2% (799,783)
Number of households with income $60k - 75k:
Gun Barrel City:
17.8% (498)
State:
9.9% (1,095,384)
Number of households with income $75k - 100k:
Gun Barrel City:
15.7% (440)
Texas:
12.8% (1,419,057)
Number of households with income $100k - 125k:
Gun Barrel City:
6.8% (191)
State:
9.5% (1,054,577)
Number of households with income $125k - 150k:
Gun Barrel City:
7.9% (222)
State:
6.7% (741,518)
Number of households with income $150k - 200k:
Gun Barrel City:
4.6% (130)
Texas:
8.7% (961,776)
Number of households with income > $200k:
Gun Barrel City:
8.0% (224)
State:
10.7% (1,181,544)
Aggregate household income in Gun Barrel City in 2022: $259,445,092
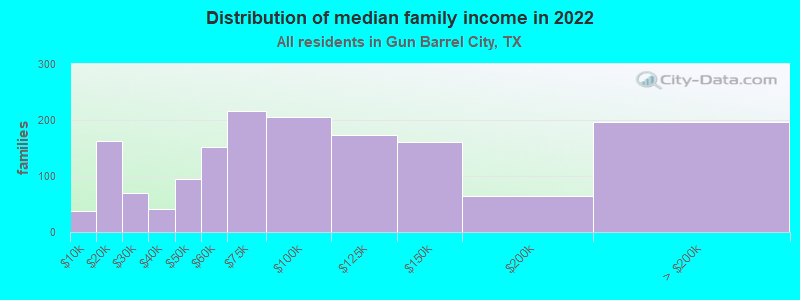
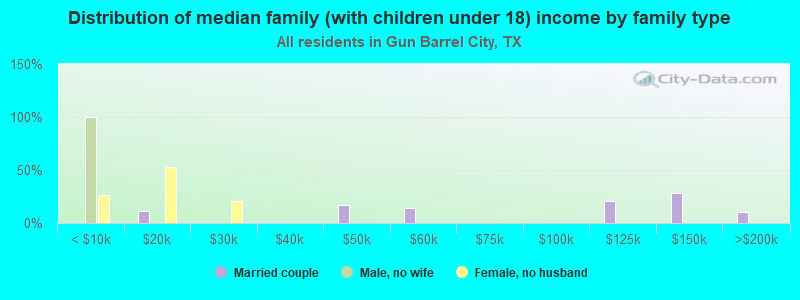
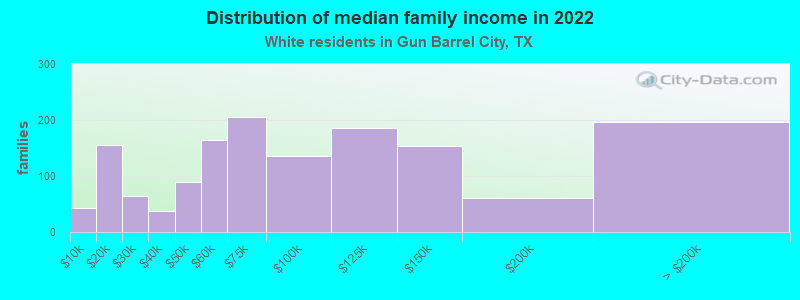
Median family income in Gun Barrel City in 2022:
Gun Barrel City:
$80,041
State:
$86,267
Number of families with income < $10k:
Gun Barrel City:
2.3% (37)
Texas:
4.0% (297,884)
Number of families with income $10k - 20k:
Gun Barrel City:
10.4% (163)
Texas:
4.3% (324,514)
Number of families with income $20k - 30k:
Gun Barrel City:
4.4% (69)
State:
5.8% (430,949)
Number of families with income $30k - 40k:
Gun Barrel City:
2.6% (41)
Texas:
6.6% (493,535)
Number of families with income $40k - 50k:
Gun Barrel City:
6.0% (94)
State:
6.7% (499,663)
Number of families with income $50k - 60k:
Gun Barrel City:
9.7% (152)
State:
6.6% (492,203)
Number of families with income $60k - 75k:
Gun Barrel City:
13.7% (216)
State:
9.5% (710,229)
Number of families with income $75k - 100k:
Gun Barrel City:
13.1% (206)
State:
13.6% (1,015,480)
Number of families with income $100k - 125k:
Gun Barrel City:
11.1% (174)
State:
10.7% (797,961)
Number of families with income $125k - 150k:
Gun Barrel City:
10.2% (161)
Texas:
8.1% (602,985)
Number of families with income $150k - 200k:
Gun Barrel City:
4.1% (64)
State:
10.7% (804,459)
Number of families with income > $200k:
Gun Barrel City:
12.5% (196)
Texas:
13.5% (1,013,514)
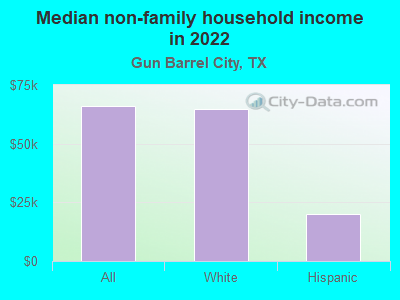
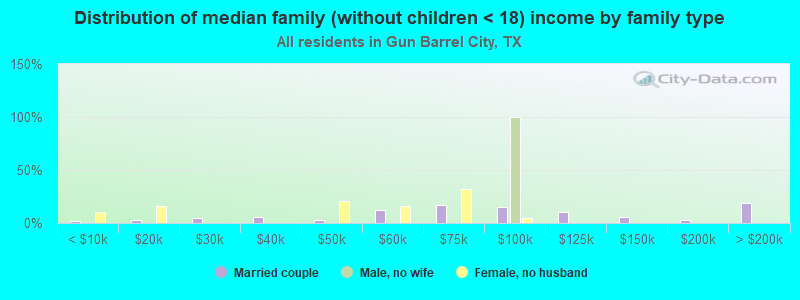
Median non-family income in Gun Barrel City in 2022:
Gun Barrel City:
$66,068
Texas:
$45,999
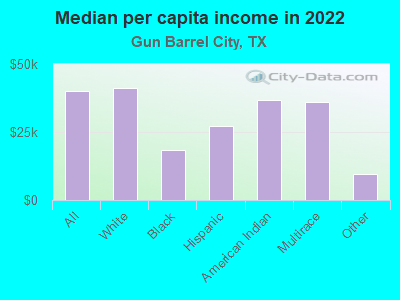
Median per capita income in Gun Barrel City in 2022:
Gun Barrel City:
$40,233
State:
$38,123
Change in median per capita income between 2000 and 2022:
Gun Barrel City, Texas:
+91.2%
State:
+94.3%
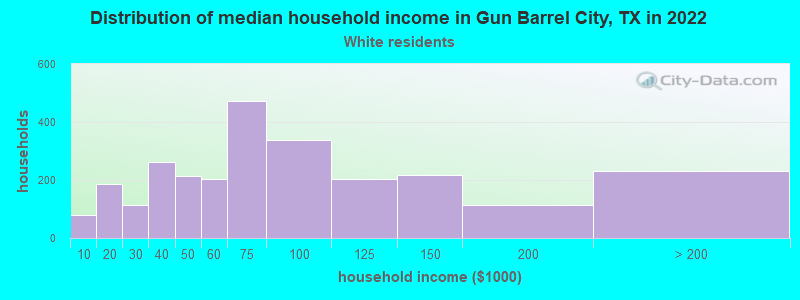
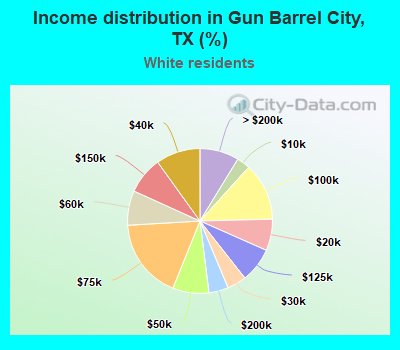
Income statistics for White residents
Median household income in Gun Barrel City, TX in 2022:
Gun Barrel City:
$67,922
Texas:
$82,032
Change in median household income between 2000 and 2022:
Gun Barrel City, Texas:
+126.3%
Texas:
+91.0%
Number of households with income < $10k:
Gun Barrel City:
3.0% (78)
State:
4.7% (273,716)
Number of households with income $10k - 20k:
Gun Barrel City:
7.0% (185)
Texas:
5.5% (322,702)
Number of households with income $20k - 30k:
Gun Barrel City:
4.3% (113)
State:
6.2% (363,947)
Number of households with income $30k - 40k:
Gun Barrel City:
9.9% (261)
State:
6.8% (399,275)
Number of households with income $40k - 50k:
Gun Barrel City:
8.1% (213)
State:
6.5% (383,417)
Number of households with income $50k - 60k:
Gun Barrel City:
7.7% (203)
State:
6.6% (388,535)
Number of households with income $60k - 75k:
Gun Barrel City:
17.9% (472)
State:
9.7% (566,295)
Number of households with income $75k - 100k:
Gun Barrel City:
12.9% (339)
Texas:
13.0% (760,276)
Number of households with income $100k - 125k:
Gun Barrel City:
7.8% (204)
State:
10.2% (597,596)
Number of households with income $125k - 150k:
Gun Barrel City:
8.3% (218)
Texas:
7.4% (436,830)
Number of households with income $150k - 200k:
Gun Barrel City:
4.3% (114)
State:
9.9% (583,067)
Number of households with income > $200k:
Gun Barrel City:
8.7% (230)
Texas:
13.5% (792,647)
Aggregate household income in Gun Barrel City in 2022: $248,366,821
Median family income in Gun Barrel City in 2022:
Gun Barrel City:
$79,347
State:
$101,788
Number of families with income < $10k:
Gun Barrel City:
2.8% (42)
Texas:
2.8% (108,142)
Number of families with income $10k - 20k:
Gun Barrel City:
10.4% (156)
Texas:
2.9% (113,421)
Number of families with income $20k - 30k:
Gun Barrel City:
4.4% (65)
Texas:
4.1% (157,688)
Number of families with income $30k - 40k:
Gun Barrel City:
2.5% (38)
Texas:
5.2% (198,847)
Number of families with income $40k - 50k:
Gun Barrel City:
6.0% (90)
State:
5.6% (216,490)
Number of families with income $50k - 60k:
Gun Barrel City:
11.1% (165)
State:
5.7% (220,689)
Number of families with income $60k - 75k:
Gun Barrel City:
13.8% (205)
State:
9.0% (346,106)
Number of families with income $75k - 100k:
Gun Barrel City:
9.1% (135)
State:
13.7% (527,363)
Number of families with income $100k - 125k:
Gun Barrel City:
12.5% (186)
State:
11.6% (448,411)
Number of families with income $125k - 150k:
Gun Barrel City:
10.2% (153)
Texas:
9.2% (355,798)
Number of families with income $150k - 200k:
Gun Barrel City:
4.0% (60)
State:
12.5% (480,185)
Number of families with income > $200k:
Gun Barrel City:
13.2% (197)
State:
17.6% (677,490)
Median non-family income in Gun Barrel City in 2022:
Gun Barrel City:
$64,624
State:
$50,587
Median per capita income in Gun Barrel City in 2022:
Gun Barrel City:
$41,315
Texas:
$47,740
Change in median per capita income between 2000 and 2022:
Gun Barrel City, Texas:
+90.4%
State:
+114.3%
Income statistics for Black or African American residents
Median per capita income in Gun Barrel City in 2022:
Gun Barrel City:
$18,291
State:
$30,490
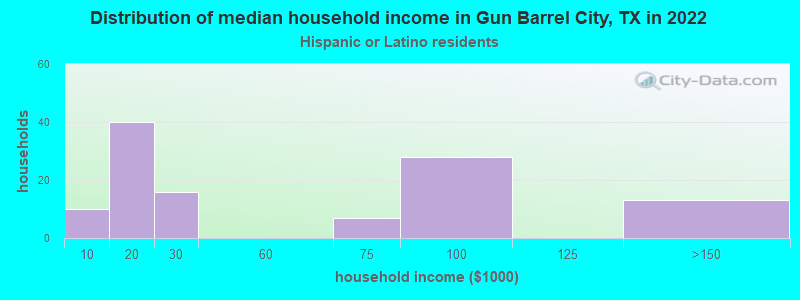
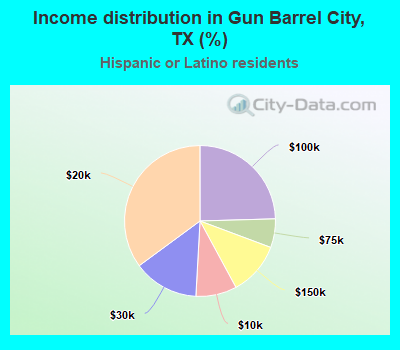
Income statistics for Hispanic or Latino residents
Number of households with income < $10k:
Gun Barrel City:
8.8% (10)
State:
5.8% (213,953)
Number of households with income $10k - 20k:
Gun Barrel City:
35.1% (40)
Texas:
8.0% (297,456)
Number of households with income $20k - 30k:
Gun Barrel City:
14.0% (16)
State:
9.2% (340,166)
Number of households with income $30k - 40k:
Gun Barrel City:
0.0% (0)
State:
9.5% (354,336)
Number of households with income $40k - 50k:
Gun Barrel City:
0.0% (0)
State:
8.8% (327,013)
Number of households with income $50k - 60k:
Gun Barrel City:
0.0% (0)
Texas:
8.3% (308,818)
Number of households with income $60k - 75k:
Gun Barrel City:
6.1% (7)
State:
10.9% (405,109)
Number of households with income $75k - 100k:
Gun Barrel City:
24.6% (28)
State:
13.8% (511,639)
Number of households with income $100k - 125k:
Gun Barrel City:
0.0% (0)
State:
8.6% (319,728)
Number of households with income $125k - 150k:
Gun Barrel City:
11.4% (13)
Texas:
5.7% (210,932)
Number of households with income $150k - 200k:
Gun Barrel City:
0.0% (0)
Texas:
6.4% (236,055)
Number of households with income > $200k:
Gun Barrel City:
0.0% (0)
State:
5.1% (189,259)
Aggregate household income in Gun Barrel City in 2022: $8,058,875
Median non-family income in Gun Barrel City in 2022:
Gun Barrel City:
$19,973
State:
$39,934
Median per capita income in Gun Barrel City in 2022:
Gun Barrel City:
$27,290
State:
$24,862
Change in median per capita income between 2000 and 2022:
Gun Barrel City, Texas:
+141.6%
State:
+130.8%
Income statistics for American Indian and Alaska Native residents
Median per capita income in Gun Barrel City in 2022:
Gun Barrel City:
$36,826
State:
$28,166
Income statistics for Multirace residents
Number of households with income < $10k:
Gun Barrel City:
0.0% (0)
State:
5.5% (122,324)
Number of households with income $10k - 20k:
Gun Barrel City:
0.0% (0)
Texas:
8.2% (182,232)
Number of households with income $20k - 30k:
Gun Barrel City:
0.0% (0)
Texas:
8.5% (189,456)
Number of households with income $30k - 40k:
Gun Barrel City:
0.0% (0)
State:
8.9% (197,499)
Number of households with income $40k - 50k:
Gun Barrel City:
0.0% (0)
State:
8.7% (191,735)
Number of households with income $50k - 60k:
Gun Barrel City:
0.0% (0)
State:
8.0% (177,535)
Number of households with income $60k - 75k:
Gun Barrel City:
0.0% (0)
State:
10.5% (232,479)
Number of households with income $75k - 100k:
Gun Barrel City:
100.0% (51)
State:
13.1% (290,448)
Number of households with income $100k - 125k:
Gun Barrel City:
0.0% (0)
Texas:
8.6% (191,595)
Number of households with income $125k - 150k:
Gun Barrel City:
0.0% (0)
Texas:
6.0% (133,361)
Number of households with income $150k - 200k:
Gun Barrel City:
0.0% (0)
State:
7.2% (159,195)
Number of households with income > $200k:
Gun Barrel City:
0.0% (0)
Texas:
6.7% (148,064)
Aggregate household income in Gun Barrel City in 2022: $23,655,934
Median per capita income in Gun Barrel City in 2022:
Gun Barrel City:
$35,915
State:
$26,785
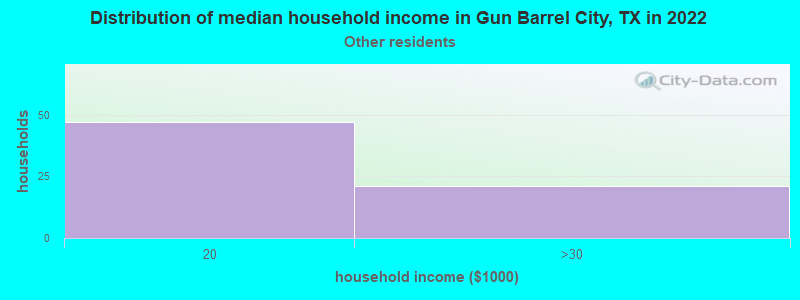
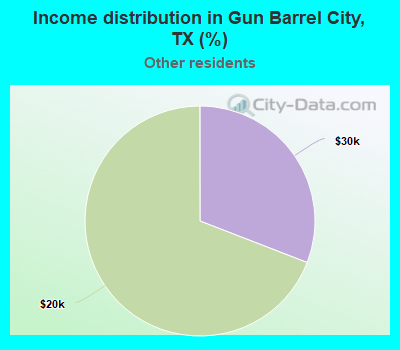
Income statistics for other residents
Median household income in Gun Barrel City, TX in 2022:
Gun Barrel City:
$24,672
Texas:
$57,114
Number of households with income < $10k:
Gun Barrel City:
0.0% (0)
State:
5.9% (54,162)
Number of households with income $10k - 20k:
Gun Barrel City:
69.1% (47)
State:
6.8% (62,891)
Number of households with income $20k - 30k:
Gun Barrel City:
30.9% (21)
State:
10.6% (97,294)
Number of households with income $30k - 40k:
Gun Barrel City:
0.0% (0)
State:
10.8% (99,670)
Number of households with income $40k - 50k:
Gun Barrel City:
0.0% (0)
State:
9.3% (85,548)
Number of households with income $50k - 60k:
Gun Barrel City:
0.0% (0)
Texas:
9.0% (82,757)
Number of households with income $60k - 75k:
Gun Barrel City:
0.0% (0)
State:
10.9% (100,326)
Number of households with income $75k - 100k:
Gun Barrel City:
0.0% (0)
Texas:
14.0% (128,767)
Number of households with income $100k - 125k:
Gun Barrel City:
0.0% (0)
State:
8.2% (75,218)
Number of households with income $125k - 150k:
Gun Barrel City:
0.0% (0)
State:
4.8% (44,223)
Number of households with income $150k - 200k:
Gun Barrel City:
0.0% (0)
Texas:
5.6% (51,376)
Number of households with income > $200k:
Gun Barrel City:
0.0% (0)
State:
4.0% (36,393)
Aggregate household income in Gun Barrel City in 2022: $1,314,434
Median per capita income in Gun Barrel City in 2022:
Gun Barrel City:
$9,516
Texas:
$23,899
Change in median per capita income between 2000 and 2022:: -27.1%
Gun Barrel City, Texas:
-27.1%
State:
+135.2%
Discuss Gun Barrel City, Texas (TX) on our hugely popular Texas forum.