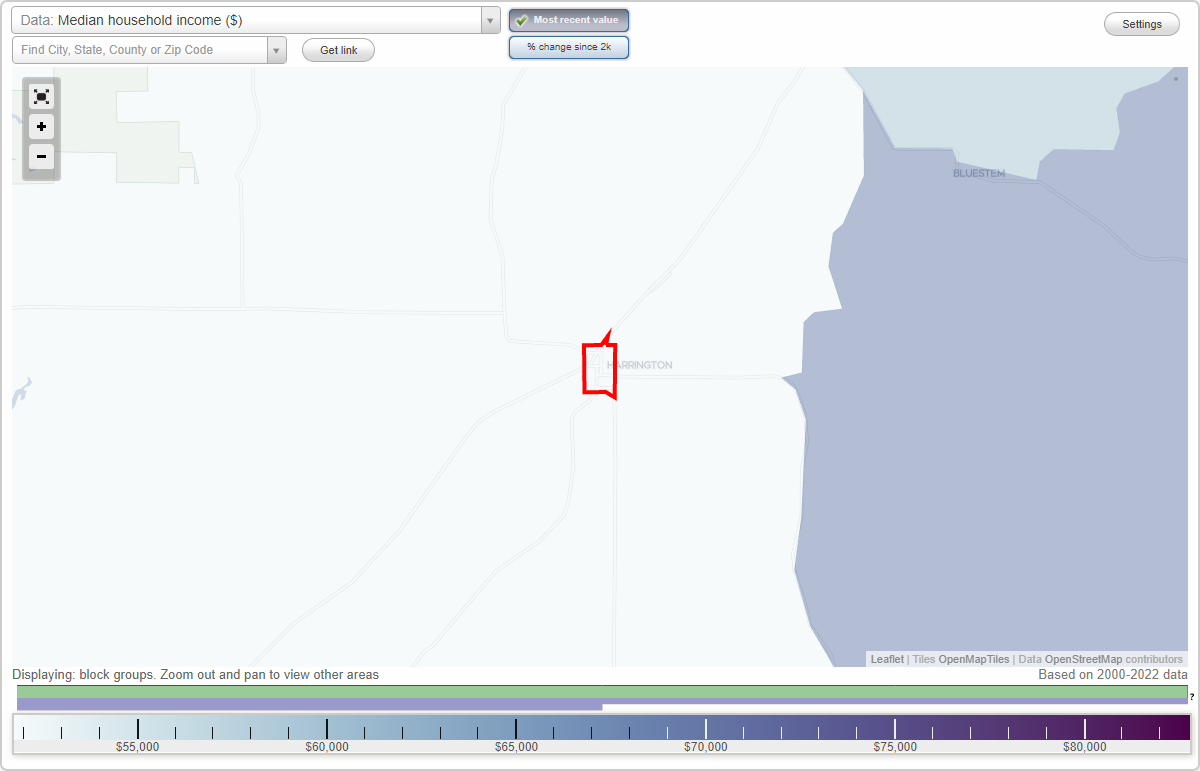
The median household income in Harrington, WA in 2022 was $37,683, which was 142.3% less than the median annual income of $91,306 across the entire state of Washington. Compared to the median income of $29,792 in 2000 this represents an increase of 20.9%. The per capita income in 2022 was $25,403, which means an increase of 30.2% compared to 2000 when it was $17,744.
Whole page based on the data from 2000 / 2022 when the population of Harrington, Washington was 426 / 456
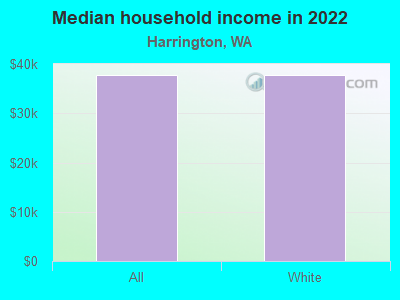
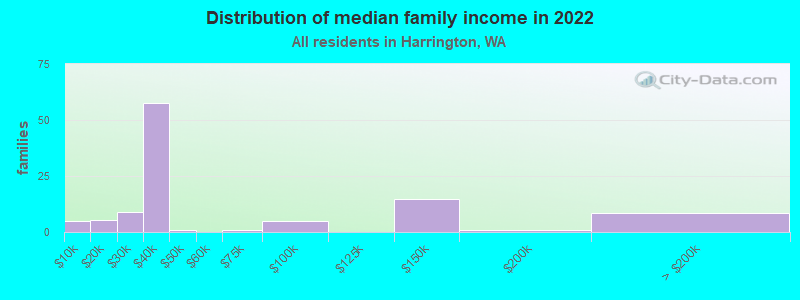
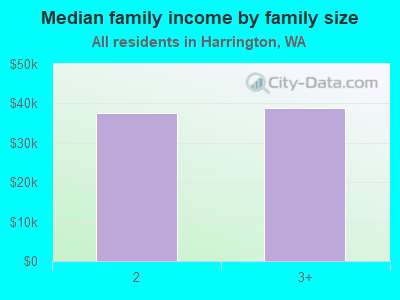
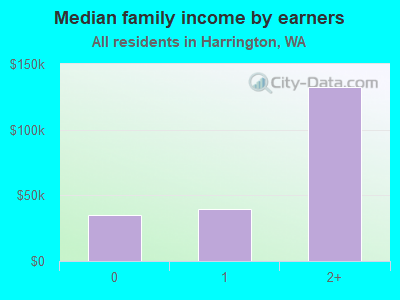
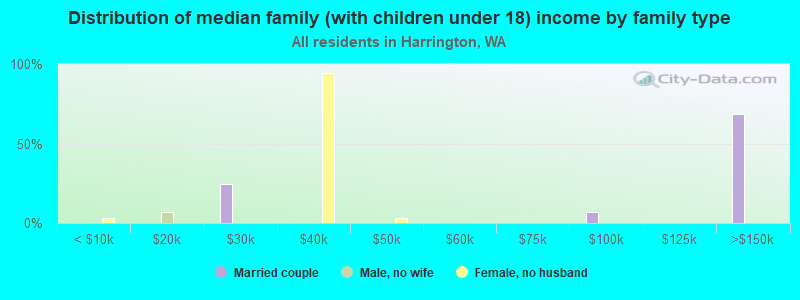
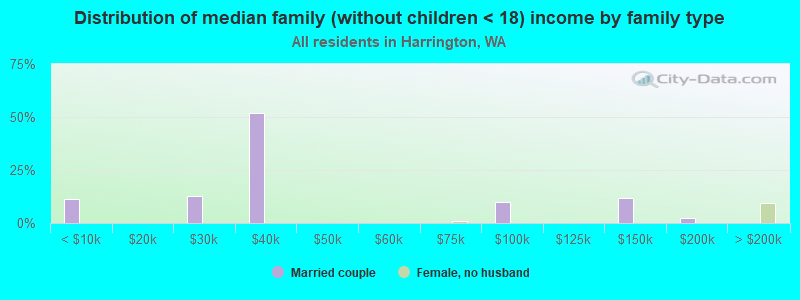
Income statistics for all residents
Median household income in Harrington, WA in 2022:
Harrington:
$37,684
State:
$91,306
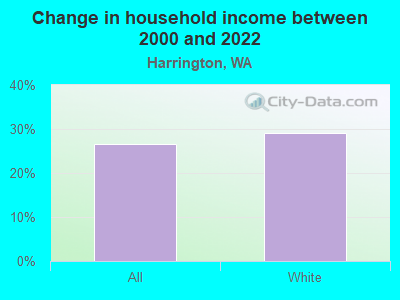
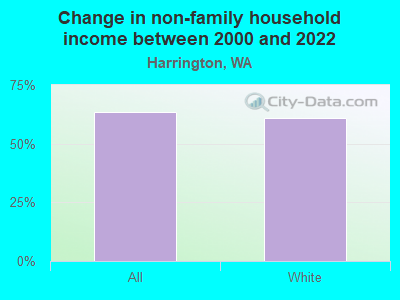
Change in median household income between 2000 and 2022:
Harrington, Washington:
+26.5%
State:
+99.5%
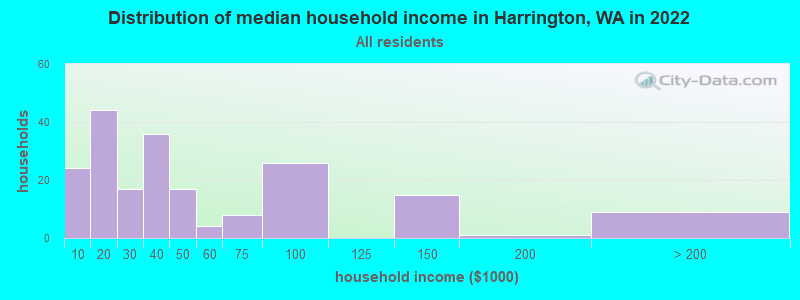
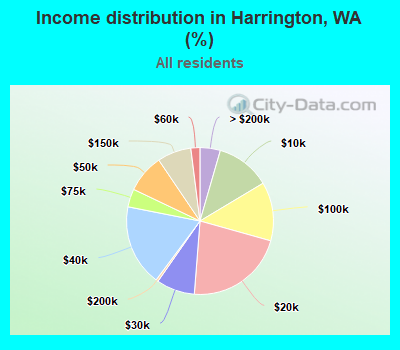
Number of households with income < $10k:
Harrington:
11.9% (24)
Washington:
4.5% (139,331)
Number of households with income $10k - 20k:
Harrington:
21.9% (44)
State:
5.0% (154,508)
Number of households with income $20k - 30k:
Harrington:
8.5% (17)
State:
5.4% (166,555)
Number of households with income $30k - 40k:
Harrington:
17.9% (36)
State:
5.5% (170,324)
Number of households with income $40k - 50k:
Harrington:
8.5% (17)
Washington:
6.0% (183,941)
Number of households with income $50k - 60k:
Harrington:
2.0% (4)
State:
6.1% (187,395)
Number of households with income $60k - 75k:
Harrington:
4.0% (8)
State:
8.7% (266,771)
Number of households with income $75k - 100k:
Harrington:
12.9% (26)
State:
13.1% (404,672)
Number of households with income $100k - 125k:
Harrington:
0.0% (0)
Washington:
11.0% (337,911)
Number of households with income $125k - 150k:
Harrington:
7.5% (15)
State:
8.0% (244,934)
Number of households with income $150k - 200k:
Harrington:
0.5% (1)
State:
10.5% (323,812)
Number of households with income > $200k:
Harrington:
4.5% (9)
State:
16.2% (499,799)
Aggregate household income in Harrington in 2022: $12,899,301
Median family income in Harrington in 2022:
Harrington:
$38,909
Washington:
$109,192
Number of families with income < $10k:
Harrington:
4.5% (5)
State:
2.9% (55,953)
Number of families with income $10k - 20k:
Harrington:
4.8% (5)
State:
2.6% (50,138)
Number of families with income $20k - 30k:
Harrington:
8.3% (9)
State:
3.2% (61,974)
Number of families with income $30k - 40k:
Harrington:
53.2% (57)
State:
4.1% (80,240)
Number of families with income $40k - 50k:
Harrington:
0.9% (1)
Washington:
4.9% (94,310)
Number of families with income $60k - 75k:
Harrington:
0.9% (1)
Washington:
8.2% (158,348)
Number of families with income $75k - 100k:
Harrington:
4.8% (5)
Washington:
13.8% (267,812)
Number of families with income $125k - 150k:
Harrington:
13.8% (15)
State:
9.3% (180,011)
Number of families with income $150k - 200k:
Harrington:
0.9% (1)
Washington:
13.0% (250,874)
Number of families with income > $200k:
Harrington:
7.9% (8)
State:
20.4% (393,898)
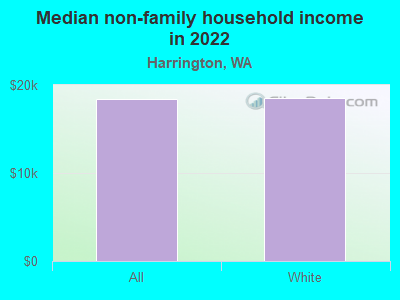
Median non-family income in Harrington in 2022:
Harrington:
$18,386
Washington:
$57,299
Change in median non-family income between 2000 and 2022:
Harrington, Washington:
+63.4%
State:
+94.9%
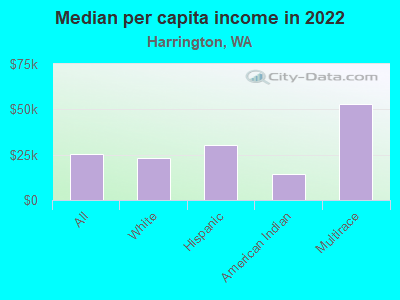
Median per capita income in Harrington in 2022:
Harrington:
$25,403
Washington:
$50,764
Change in median per capita income between 2000 and 2022:
Harrington, Washington:
+43.2%
Washington:
+121.0%
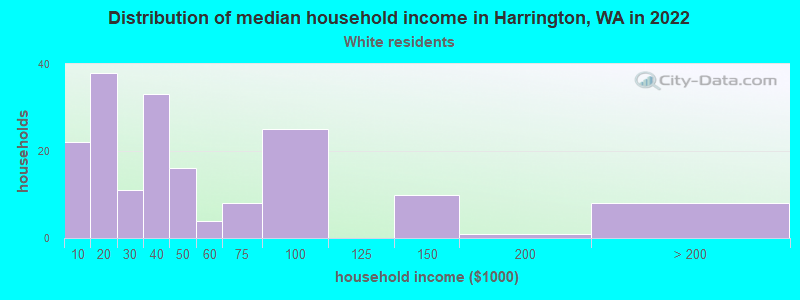
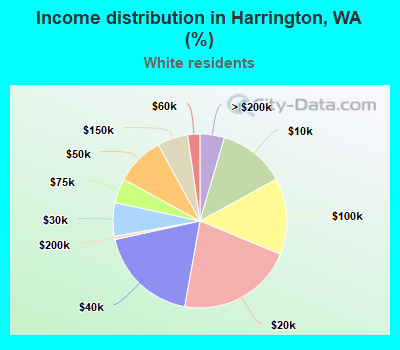
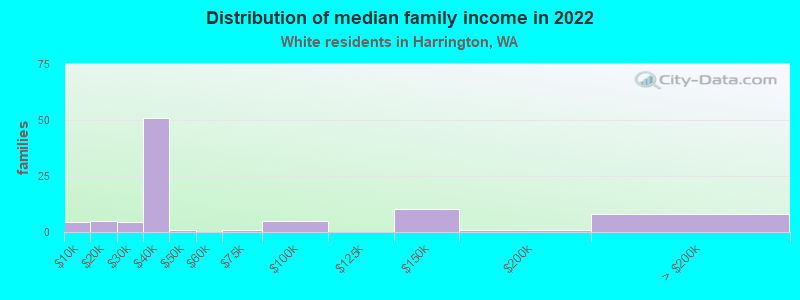
Income statistics for White residents
Median household income in Harrington, WA in 2022:
Harrington:
$37,768
State:
$91,916
Change in median household income between 2000 and 2022:
Harrington, Washington:
+29.0%
Washington:
+95.4%
Number of households with income < $10k:
Harrington:
12.5% (22)
State:
4.3% (95,850)
Number of households with income $10k - 20k:
Harrington:
21.6% (38)
State:
4.8% (106,421)
Number of households with income $20k - 30k:
Harrington:
6.2% (11)
Washington:
5.5% (122,860)
Number of households with income $30k - 40k:
Harrington:
18.8% (33)
State:
5.4% (119,627)
Number of households with income $40k - 50k:
Harrington:
9.1% (16)
State:
5.9% (132,276)
Number of households with income $50k - 60k:
Harrington:
2.3% (4)
State:
6.1% (136,212)
Number of households with income $60k - 75k:
Harrington:
4.5% (8)
Washington:
8.8% (196,086)
Number of households with income $75k - 100k:
Harrington:
14.2% (25)
State:
13.4% (299,192)
Number of households with income $100k - 125k:
Harrington:
0.0% (0)
Washington:
11.3% (252,209)
Number of households with income $125k - 150k:
Harrington:
5.7% (10)
State:
7.9% (175,962)
Number of households with income $150k - 200k:
Harrington:
0.6% (1)
State:
10.7% (239,156)
Number of households with income > $200k:
Harrington:
4.5% (8)
Washington:
16.1% (359,917)
Aggregate household income in Harrington in 2022: $11,616,119
Median family income in Harrington in 2022:
Harrington:
$38,831
State:
$112,511
Number of families with income < $10k:
Harrington:
5.0% (5)
State:
2.4% (33,676)
Number of families with income $10k - 20k:
Harrington:
5.5% (5)
Washington:
2.0% (28,228)
Number of families with income $20k - 30k:
Harrington:
5.0% (5)
State:
2.9% (39,288)
Number of families with income $30k - 40k:
Harrington:
56.0% (51)
Washington:
3.6% (50,190)
Number of families with income $40k - 50k:
Harrington:
1.0% (1)
State:
4.6% (63,009)
Number of families with income $60k - 75k:
Harrington:
1.0% (1)
State:
8.2% (112,369)
Number of families with income $75k - 100k:
Harrington:
5.4% (5)
Washington:
14.1% (194,214)
Number of families with income $125k - 150k:
Harrington:
11.1% (10)
Washington:
9.5% (130,928)
Number of families with income $150k - 200k:
Harrington:
1.0% (1)
State:
13.7% (188,621)
Number of families with income > $200k:
Harrington:
8.9% (8)
Washington:
20.8% (285,982)
Median non-family income in Harrington in 2022:
Harrington:
$18,489
State:
$56,103
Change in median non-family income between 2000 and 2022:
Harrington, Washington:
+60.8%
State:
+87.7%
Median per capita income in Harrington in 2022:
Harrington:
$23,306
State:
$55,212
Change in median per capita income between 2000 and 2022:
Harrington, Washington:
+22.1%
Washington:
+123.8%
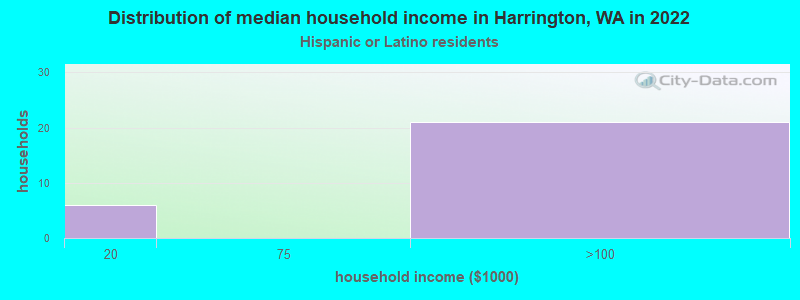
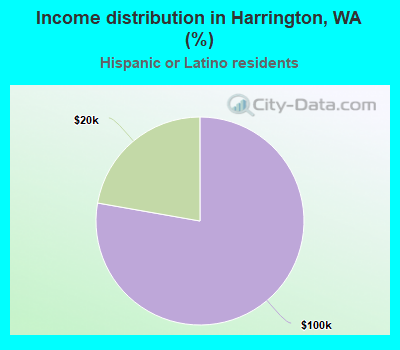
Income statistics for Hispanic or Latino residents
Number of households with income < $10k:
Harrington:
0.0% (0)
State:
4.9% (14,456)
Number of households with income $10k - 20k:
Harrington:
22.2% (6)
State:
5.3% (15,449)
Number of households with income $20k - 30k:
Harrington:
0.0% (0)
State:
6.8% (20,016)
Number of households with income $30k - 40k:
Harrington:
0.0% (0)
Washington:
7.7% (22,548)
Number of households with income $40k - 50k:
Harrington:
0.0% (0)
State:
7.3% (21,450)
Number of households with income $50k - 60k:
Harrington:
0.0% (0)
State:
7.7% (22,744)
Number of households with income $60k - 75k:
Harrington:
0.0% (0)
Washington:
10.5% (30,737)
Number of households with income $75k - 100k:
Harrington:
77.8% (21)
State:
14.9% (43,843)
Number of households with income $100k - 125k:
Harrington:
0.0% (0)
State:
11.1% (32,554)
Number of households with income $125k - 150k:
Harrington:
0.0% (0)
State:
7.4% (21,624)
Number of households with income $150k - 200k:
Harrington:
0.0% (0)
State:
7.3% (21,360)
Number of households with income > $200k:
Harrington:
0.0% (0)
State:
9.2% (27,055)
Median per capita income in Harrington in 2022:
Harrington:
$30,547
State:
$28,252
Income statistics for American Indian and Alaska Native residents
Aggregate household income in Harrington in 2022: $36,854
Median per capita income in Harrington in 2022:
Harrington:
$14,445
State:
$27,053
Change in median per capita income between 2000 and 2022:: -40.4%
Harrington, Washington:
-40.4%
State:
+98.6%
Income statistics for Multirace residents
Aggregate household income in Harrington in 2022: $4,068,256
Median per capita income in Harrington in 2022:
Harrington:
$52,869
Washington:
$32,496
Discuss Harrington, Washington (WA) on our hugely popular Washington forum.