The median household income in Kawela Bay, HI in 2022 was $69,113, which was 33.8% less than the median annual income of $92,458 across the entire state of Hawaii. Compared to the median income of $49,167 in 2000 this represents an increase of 28.9%. The per capita income in 2022 was $44,215, which means an increase of 35.6% compared to 2000 when it was $28,481.
Whole page based on the data from 2000 / 2022 when the population of Kawela Bay, Hawaii was 410 / 360
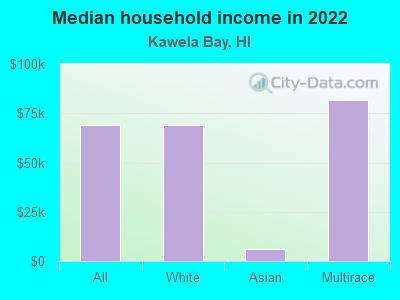
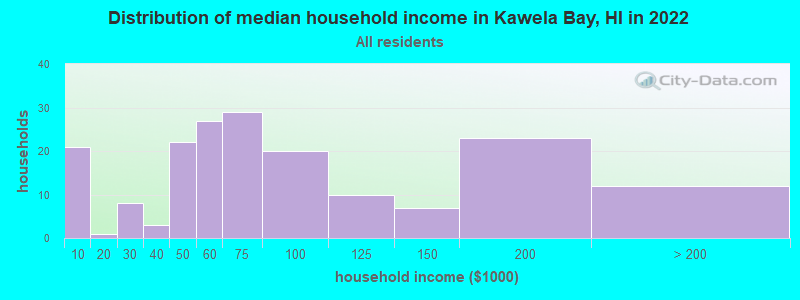
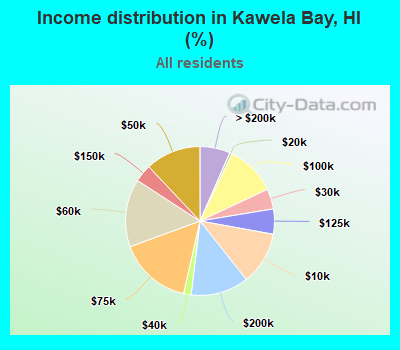
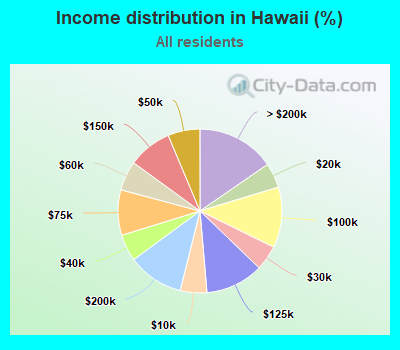
Income statistics for all residents
Median household income in Kawela Bay, HI in 2022:
Kawela Bay:
$69,113
State:
$92,458
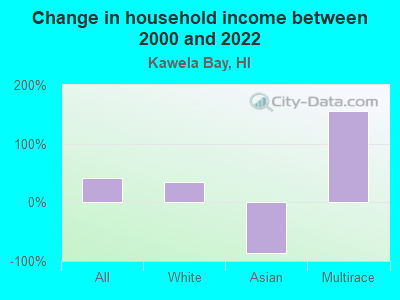
Change in median household income between 2000 and 2022:
Kawela Bay, Hawaii:
+40.6%
State:
+85.6%
Number of households with income < $10k:
Kawela Bay:
11.5% (21)
State:
5.3% (25,998)
Number of households with income $10k - 20k:
Kawela Bay:
0.5% (1)
State:
4.9% (24,328)
Number of households with income $20k - 30k:
Kawela Bay:
4.4% (8)
State:
4.9% (24,416)
Number of households with income $30k - 40k:
Kawela Bay:
1.6% (3)
State:
5.3% (26,172)
Number of households with income $40k - 50k:
Kawela Bay:
12.0% (22)
State:
6.3% (31,331)
Number of households with income $50k - 60k:
Kawela Bay:
14.8% (27)
Hawaii:
5.8% (28,915)
Number of households with income $60k - 75k:
Kawela Bay:
15.8% (29)
Hawaii:
8.9% (44,283)
Number of households with income $75k - 100k:
Kawela Bay:
10.9% (20)
State:
12.0% (59,184)
Number of households with income $100k - 125k:
Kawela Bay:
5.5% (10)
State:
11.4% (56,647)
Number of households with income $125k - 150k:
Kawela Bay:
3.8% (7)
State:
8.7% (42,833)
Number of households with income $150k - 200k:
Kawela Bay:
12.6% (23)
Hawaii:
11.0% (54,538)
Number of households with income > $200k:
Kawela Bay:
6.6% (12)
State:
15.4% (76,182)
Aggregate household income in Kawela Bay in 2022: $16,138,299
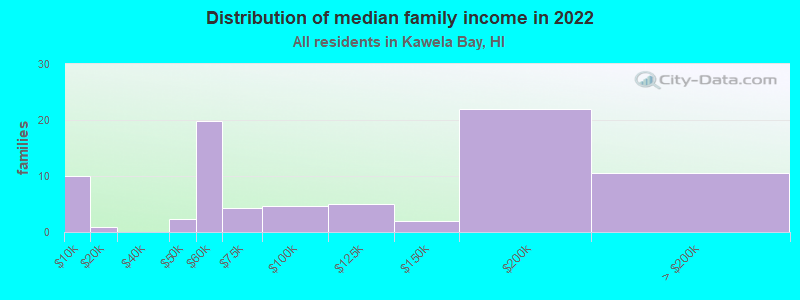
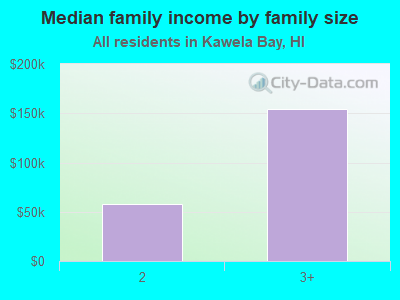
Median family income in Kawela Bay in 2022:
Kawela Bay:
$108,376
State:
$108,285
Number of families with income < $10k:
Kawela Bay:
12.3% (10)
State:
2.6% (8,867)
Number of families with income $10k - 20k:
Kawela Bay:
1.2% (1)
Hawaii:
2.5% (8,541)
Number of families with income $40k - 50k:
Kawela Bay:
2.8% (2)
State:
5.9% (19,664)
Number of families with income $50k - 60k:
Kawela Bay:
24.4% (20)
Hawaii:
5.1% (17,216)
Number of families with income $60k - 75k:
Kawela Bay:
5.3% (4)
State:
8.4% (28,061)
Number of families with income $75k - 100k:
Kawela Bay:
5.6% (5)
State:
12.2% (40,994)
Number of families with income $100k - 125k:
Kawela Bay:
6.1% (5)
State:
13.0% (43,640)
Number of families with income $125k - 150k:
Kawela Bay:
2.5% (2)
State:
10.2% (34,220)
Number of families with income $150k - 200k:
Kawela Bay:
26.9% (22)
State:
13.0% (43,709)
Number of families with income > $200k:
Kawela Bay:
13.0% (11)
State:
18.5% (61,862)
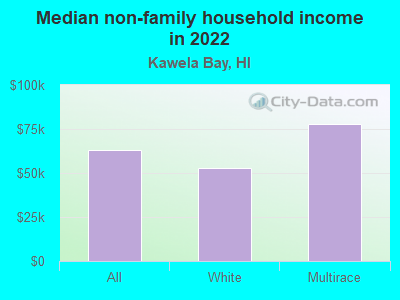
Median non-family income in Kawela Bay in 2022:
Kawela Bay:
$62,802
State:
$53,295
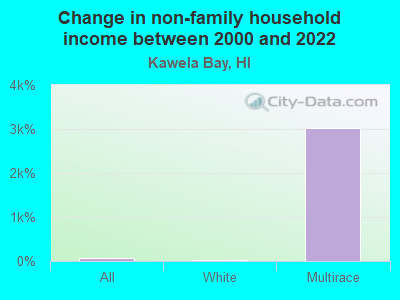
Change in median non-family income between 2000 and 2022:
Kawela Bay, Hawaii:
+70.9%
State:
+76.1%
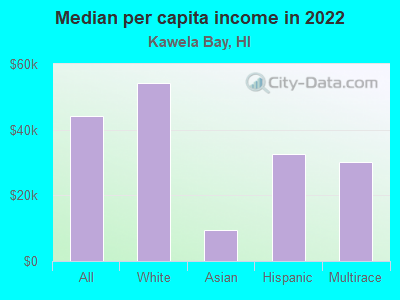
Median per capita income in Kawela Bay in 2022:
Kawela Bay:
$44,215
State:
$42,710
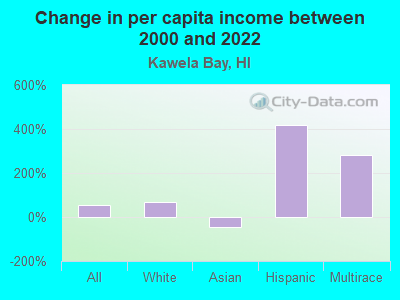
Change in median per capita income between 2000 and 2022:
Kawela Bay, Hawaii:
+55.2%
State:
+98.4%
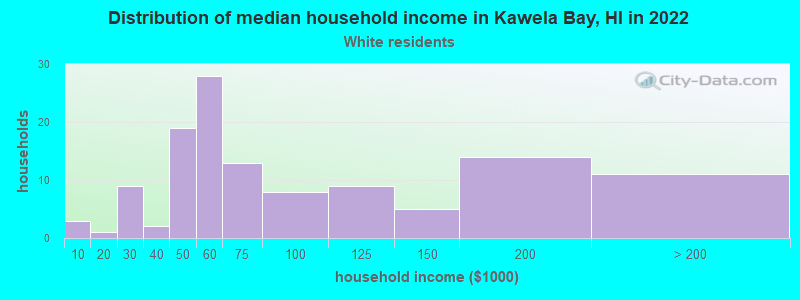
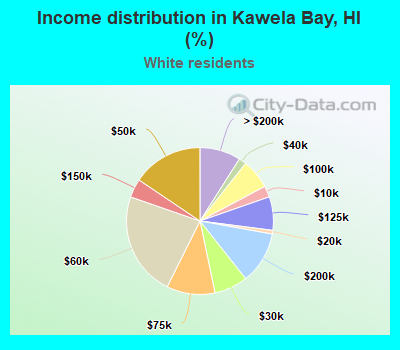
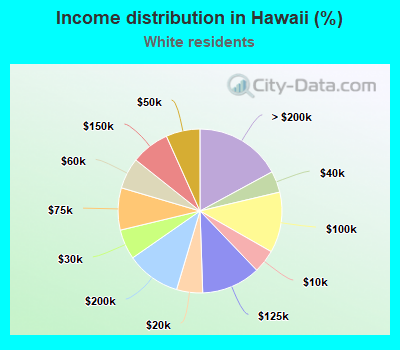
Income statistics for White residents
Median household income in Kawela Bay, HI in 2022:
Kawela Bay:
$69,219
State:
$93,098
Change in median household income between 2000 and 2022:
Kawela Bay, Hawaii:
+35.1%
State:
+88.4%
Number of households with income < $10k:
Kawela Bay:
2.5% (3)
Hawaii:
4.6% (6,276)
Number of households with income $10k - 20k:
Kawela Bay:
0.8% (1)
State:
5.1% (7,017)
Number of households with income $20k - 30k:
Kawela Bay:
7.4% (9)
State:
5.9% (8,104)
Number of households with income $30k - 40k:
Kawela Bay:
1.6% (2)
State:
4.2% (5,759)
Number of households with income $40k - 50k:
Kawela Bay:
15.6% (19)
Hawaii:
6.7% (9,164)
Number of households with income $50k - 60k:
Kawela Bay:
23.0% (28)
State:
6.1% (8,371)
Number of households with income $60k - 75k:
Kawela Bay:
10.7% (13)
State:
8.3% (11,383)
Number of households with income $75k - 100k:
Kawela Bay:
6.6% (8)
State:
12.0% (16,346)
Number of households with income $100k - 125k:
Kawela Bay:
7.4% (9)
State:
11.6% (15,905)
Number of households with income $125k - 150k:
Kawela Bay:
4.1% (5)
State:
7.6% (10,387)
Number of households with income $150k - 200k:
Kawela Bay:
11.5% (14)
State:
10.7% (14,633)
Number of households with income > $200k:
Kawela Bay:
9.0% (11)
Hawaii:
17.1% (23,367)
Aggregate household income in Kawela Bay in 2022: $11,249,116
Median non-family income in Kawela Bay in 2022:
Kawela Bay:
$53,038
Hawaii:
$58,390
Change in median non-family income between 2000 and 2022:
Kawela Bay, Hawaii:
+22.4%
State:
+73.5%
Median per capita income in Kawela Bay in 2022:
Kawela Bay:
$54,071
State:
$56,592
Change in median per capita income between 2000 and 2022:
Kawela Bay, Hawaii:
+67.3%
State:
+91.6%
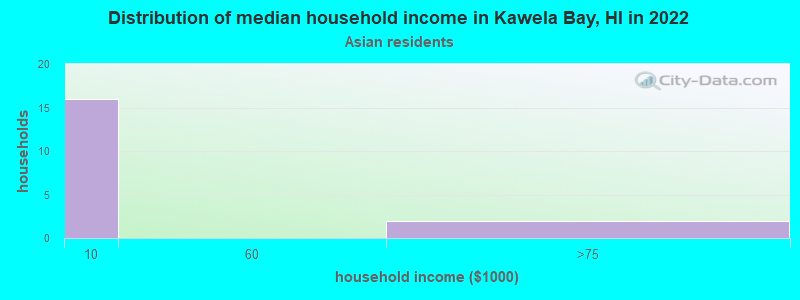
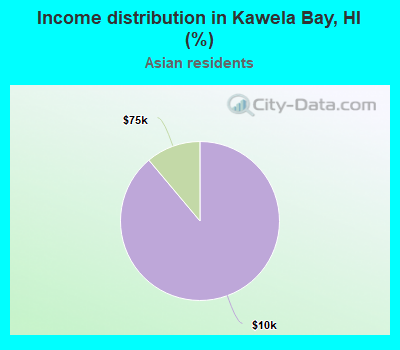
Income statistics for Asian residents
Median household income in Kawela Bay, HI in 2022:
Kawela Bay:
$5,853
State:
$97,742
Change in median household income between 2000 and 2022:: -86.0%
Kawela Bay, Hawaii:
-86.0%
State:
+80.2%
Number of households with income < $10k:
Kawela Bay:
88.9% (16)
State:
4.6% (8,646)
Number of households with income $10k - 20k:
Kawela Bay:
0.0% (0)
State:
4.5% (8,475)
Number of households with income $20k - 30k:
Kawela Bay:
0.0% (0)
Hawaii:
4.1% (7,758)
Number of households with income $30k - 40k:
Kawela Bay:
0.0% (0)
State:
5.6% (10,493)
Number of households with income $40k - 50k:
Kawela Bay:
0.0% (0)
Hawaii:
6.9% (12,943)
Number of households with income $50k - 60k:
Kawela Bay:
0.0% (0)
State:
5.3% (9,992)
Number of households with income $60k - 75k:
Kawela Bay:
11.1% (2)
State:
8.1% (15,258)
Number of households with income $75k - 100k:
Kawela Bay:
0.0% (0)
State:
11.9% (22,476)
Number of households with income $100k - 125k:
Kawela Bay:
0.0% (0)
State:
11.7% (22,040)
Number of households with income $125k - 150k:
Kawela Bay:
0.0% (0)
Hawaii:
8.4% (15,929)
Number of households with income $150k - 200k:
Kawela Bay:
0.0% (0)
State:
11.8% (22,256)
Number of households with income > $200k:
Kawela Bay:
0.0% (0)
State:
17.3% (32,642)
Aggregate household income in Kawela Bay in 2022: $475,052
Median per capita income in Kawela Bay in 2022:
Kawela Bay:
$9,459
Hawaii:
$46,968
Change in median per capita income between 2000 and 2022:: -43.6%
Kawela Bay, Hawaii:
-43.6%
State:
+105.2%
Income statistics for Hispanic or Latino residents
Aggregate household income in Kawela Bay in 2022: $269,120
Median per capita income in Kawela Bay in 2022:
Kawela Bay:
$32,614
State:
$27,879
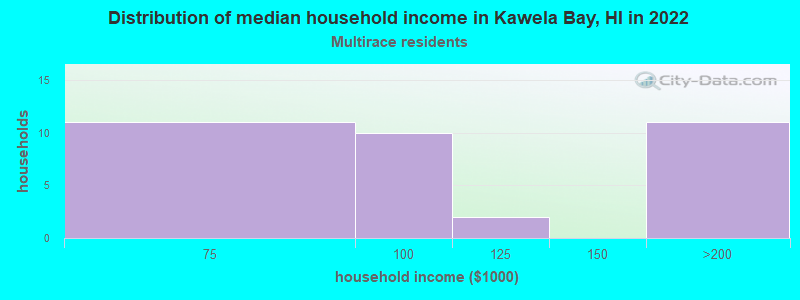
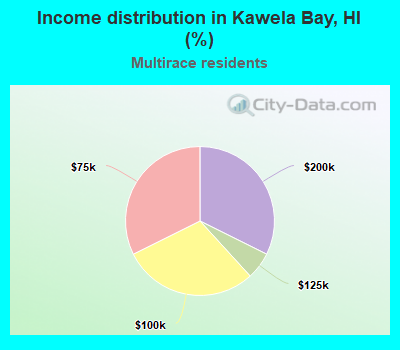
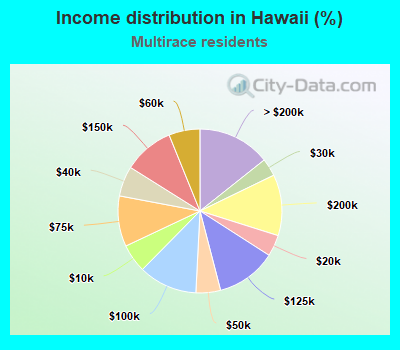
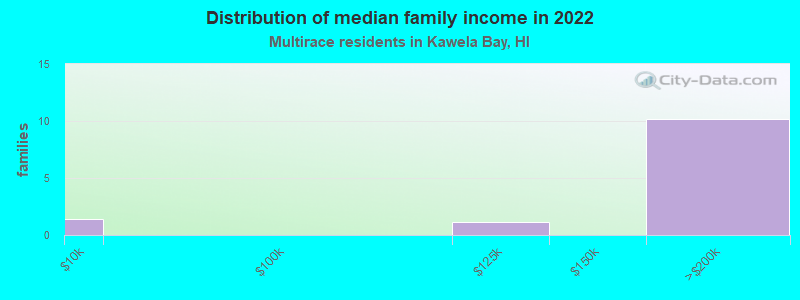
Income statistics for Multirace residents
Median household income in Kawela Bay, HI in 2022:
Kawela Bay:
$81,633
State:
$95,885
Number of households with income < $10k:
Kawela Bay:
0.0% (0)
Hawaii:
5.6% (5,910)
Number of households with income $10k - 20k:
Kawela Bay:
0.0% (0)
State:
4.2% (4,450)
Number of households with income $20k - 30k:
Kawela Bay:
0.0% (0)
State:
3.5% (3,695)
Number of households with income $30k - 40k:
Kawela Bay:
0.0% (0)
State:
5.9% (6,283)
Number of households with income $40k - 50k:
Kawela Bay:
0.0% (0)
Hawaii:
4.9% (5,122)
Number of households with income $50k - 60k:
Kawela Bay:
0.0% (0)
State:
6.1% (6,476)
Number of households with income $60k - 75k:
Kawela Bay:
32.4% (11)
State:
10.0% (10,552)
Number of households with income $75k - 100k:
Kawela Bay:
29.4% (10)
State:
11.6% (12,222)
Number of households with income $100k - 125k:
Kawela Bay:
5.9% (2)
State:
11.9% (12,546)
Number of households with income $125k - 150k:
Kawela Bay:
0.0% (0)
State:
9.9% (10,502)
Number of households with income $150k - 200k:
Kawela Bay:
32.4% (11)
Hawaii:
12.1% (12,729)
Number of households with income > $200k:
Kawela Bay:
0.0% (0)
Hawaii:
14.3% (15,121)
Aggregate household income in Kawela Bay in 2022: $3,399,189
Median family income in Kawela Bay in 2022:
Kawela Bay:
$152,124
Hawaii:
$107,650
Number of families with income < $10k:
Kawela Bay:
10.9% (1)
State:
3.4% (2,663)
Number of families with income $100k - 125k:
Kawela Bay:
9.1% (1)
Hawaii:
13.7% (10,603)
Number of families with income $150k - 200k:
Kawela Bay:
80.1% (10)
State:
12.3% (9,524)
Median non-family income in Kawela Bay in 2022:
Kawela Bay:
$77,848
State:
$53,635
Median per capita income in Kawela Bay in 2022:
Kawela Bay:
$30,187
Hawaii:
$32,765
Discuss Kawela Bay, Hawaii (HI) on our hugely popular Hawaii forum.