Kent, Connecticut (CT) income map, earnings map, and wages data
The median household income in Kent, CT in 2022 was $91,216, which was 3.1% greater than the median annual income of $88,429 across the entire state of Connecticut. Compared to the median income of $53,906 in 2000 this represents an increase of 40.9%. The per capita income in 2022 was $70,746, which means an increase of 45.3% compared to 2000 when it was $38,674.
Income statistics for all residents
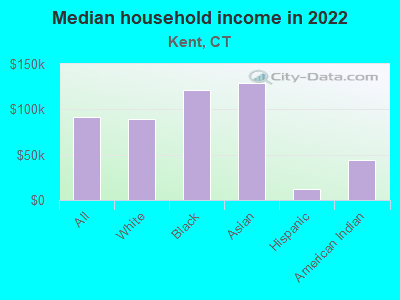
Median household income in Kent, CT in 2022:| Kent: | $91,216 |
| State: | $88,429 |
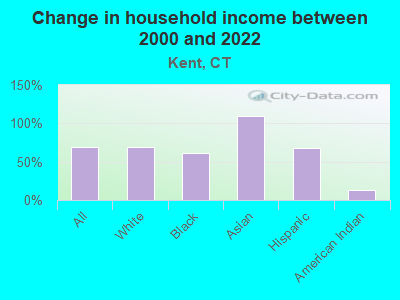
Change in median household income between 2000 and 2022:| Kent, Connecticut: | +69.2% |
| Connecticut: | +64.0% |
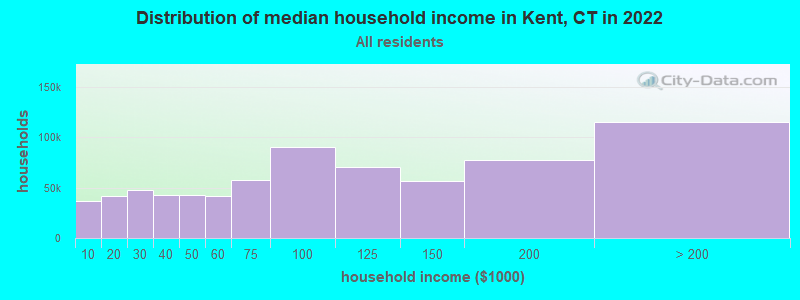
Number of households with income < $10k:| Kent: | 5.2% (37,154) |
| State: | 5.1% (72,746) |
Number of households with income $10k - 20k:| Kent: | 5.8% (41,896) |
| Connecticut: | 5.7% (81,643) |
Number of households with income $20k - 30k:| Kent: | 6.6% (47,423) |
| State: | 6.5% (92,844) |
Number of households with income $30k - 40k:| Kent: | 5.9% (42,559) |
| State: | 5.9% (83,934) |
Number of households with income $40k - 50k:| Kent: | 5.9% (42,286) |
| State: | 5.8% (83,025) |
Number of households with income $50k - 60k:| Kent: | 5.8% (41,464) |
| State: | 5.7% (81,788) |
Number of households with income $60k - 75k:| Kent: | 8.1% (58,097) |
| Connecticut: | 8.1% (115,651) |
Number of households with income $75k - 100k:| Kent: | 12.6% (90,734) |
| State: | 12.6% (180,173) |
Number of households with income $100k - 125k:| Kent: | 9.8% (70,636) |
| State: | 9.9% (141,231) |
Number of households with income $125k - 150k:| Kent: | 7.8% (56,409) |
| Connecticut: | 7.9% (112,826) |
Number of households with income $150k - 200k:| Kent: | 10.7% (77,163) |
| State: | 10.8% (154,641) |
Number of households with income > $200k:| Kent: | 16.0% (115,277) |
| State: | 16.3% (233,133) |
Aggregate household income in Kent in 2022: $4,523,202,106
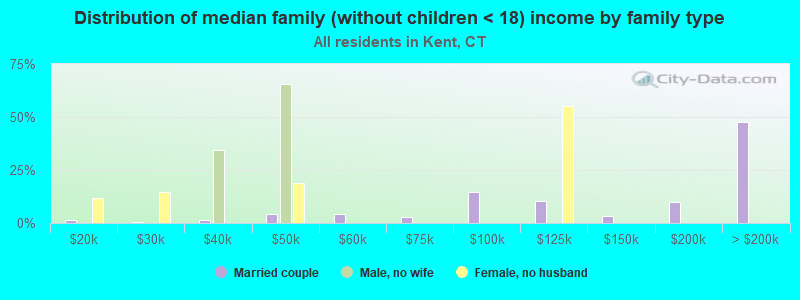
Median family income in Kent in 2022:| Kent: | $117,992 |
| State: | $115,183 |
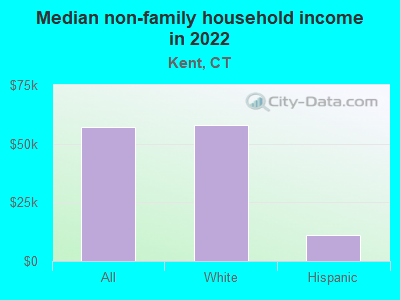
Median non-family income in Kent in 2022:| Kent: | $57,014 |
| Connecticut: | $50,964 |
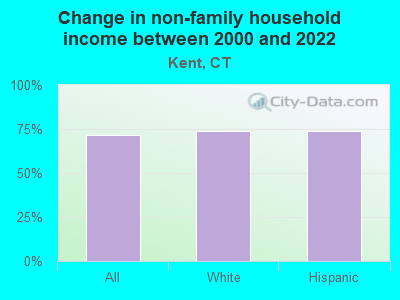
Change in median non-family income between 2000 and 2022:| Kent, Connecticut: | +71.5% |
| State: | +65.1% |
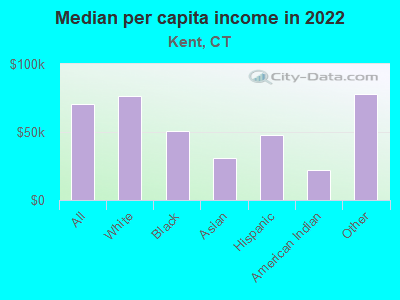
Median per capita income in Kent in 2022:| Kent: | $70,746 |
| State: | $51,581 |
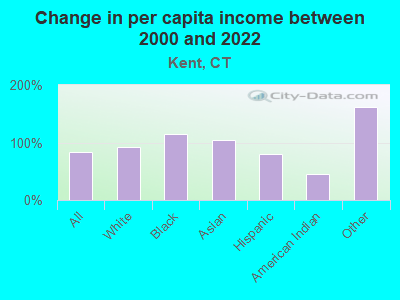
Change in median per capita income between 2000 and 2022:| Kent, Connecticut: | +82.9% |
| State: | +79.3% |
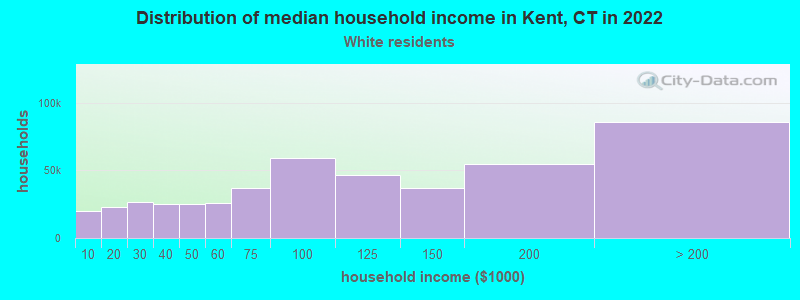
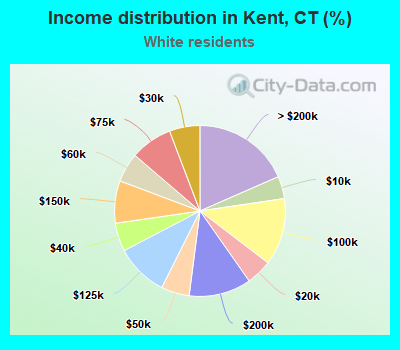
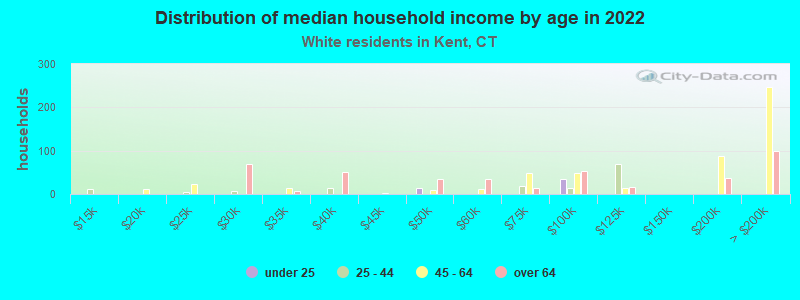
Income statistics for White residents
Median household income in Kent, CT in 2022:| Kent: | $89,877 |
| Connecticut: | $96,890 |
Change in median household income between 2000 and 2022:| Kent, Connecticut: | +69.4% |
| State: | +68.5% |
Number of households with income < $10k:| Kent: | 4.2% (19,658) |
| State: | 4.2% (42,265) |
Number of households with income $10k - 20k:| Kent: | 4.9% (22,601) |
| State: | 4.8% (48,323) |
Number of households with income $20k - 30k:| Kent: | 5.8% (26,878) |
| State: | 5.7% (57,716) |
Number of households with income $30k - 40k:| Kent: | 5.4% (24,881) |
| State: | 5.3% (53,827) |
Number of households with income $40k - 50k:| Kent: | 5.3% (24,777) |
| Connecticut: | 5.3% (53,301) |
Number of households with income $50k - 60k:| Kent: | 5.6% (25,785) |
| Connecticut: | 5.5% (55,690) |
Number of households with income $60k - 75k:| Kent: | 7.9% (36,849) |
| Connecticut: | 8.0% (80,329) |
Number of households with income $75k - 100k:| Kent: | 12.7% (59,046) |
| State: | 12.7% (128,070) |
Number of households with income $100k - 125k:| Kent: | 10.0% (46,365) |
| Connecticut: | 10.0% (101,210) |
Number of households with income $125k - 150k:| Kent: | 8.0% (37,223) |
| State: | 8.0% (81,250) |
Number of households with income $150k - 200k:| Kent: | 11.8% (54,733) |
| State: | 11.8% (119,527) |
Number of households with income > $200k:| Kent: | 18.4% (85,682) |
| Connecticut: | 18.6% (187,875) |
Aggregate household income in Kent in 2022: $3,387,959,841
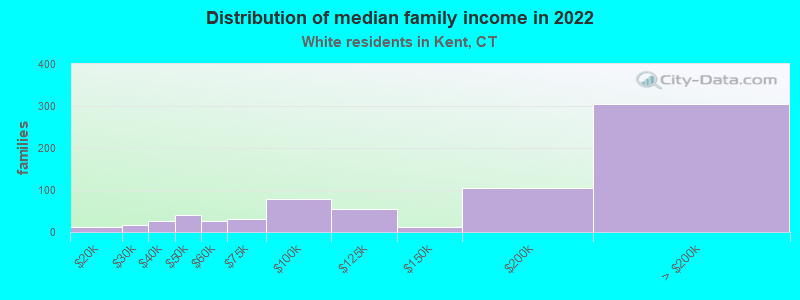
Median family income in Kent in 2022:| Kent: | $121,171 |
| State: | $128,955 |
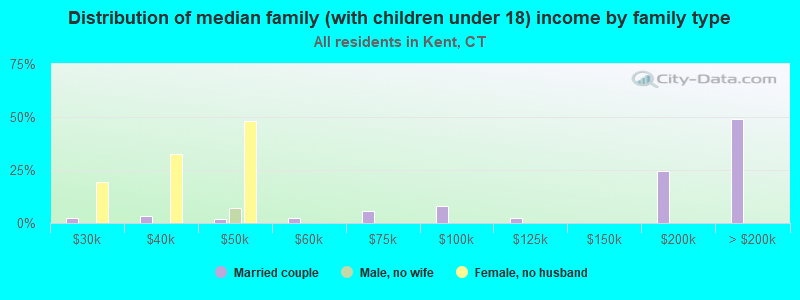
Number of families with income < $10k:| Kent: | 0.2% (1) |
| Connecticut: | 1.9% (11,537) |
Number of families with income $10k - 20k:| Kent: | 1.6% (12) |
| State: | 1.8% (11,289) |
Number of families with income $20k - 30k:| Kent: | 2.4% (17) |
| State: | 3.0% (18,506) |
Number of families with income $30k - 40k:| Kent: | 3.7% (26) |
| State: | 2.9% (18,160) |
Number of families with income $40k - 50k:| Kent: | 5.6% (40) |
| State: | 3.9% (24,550) |
Number of families with income $50k - 60k:| Kent: | 3.6% (26) |
| State: | 4.3% (26,723) |
Number of families with income $60k - 75k:| Kent: | 4.5% (32) |
| State: | 7.1% (44,075) |
Number of families with income $75k - 100k:| Kent: | 11.1% (78) |
| Connecticut: | 12.5% (77,679) |
Number of families with income $100k - 125k:| Kent: | 7.6% (54) |
| State: | 11.1% (69,086) |
Number of families with income $125k - 150k:| Kent: | 1.9% (13) |
| State: | 9.6% (59,616) |
Number of families with income $150k - 200k:| Kent: | 14.8% (105) |
| State: | 15.7% (97,890) |
Number of families with income > $200k:| Kent: | 43.0% (305) |
| State: | 26.3% (163,417) |
Median non-family income in Kent in 2022:| Kent: | $57,747 |
| State: | $54,067 |
Change in median non-family income between 2000 and 2022:| Kent, Connecticut: | +73.7% |
| State: | +68.7% |
Median per capita income in Kent in 2022:| Kent: | $76,137 |
| Connecticut: | $59,916 |
Change in median per capita income between 2000 and 2022:| Kent, Connecticut: | +92.1% |
| Connecticut: | +90.2% |
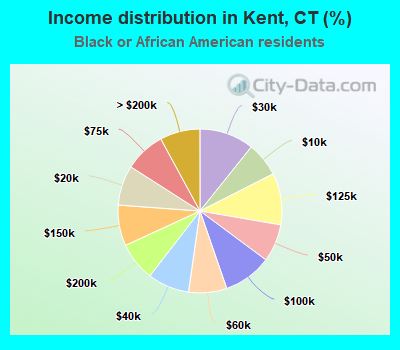
Income statistics for Black or African American residents
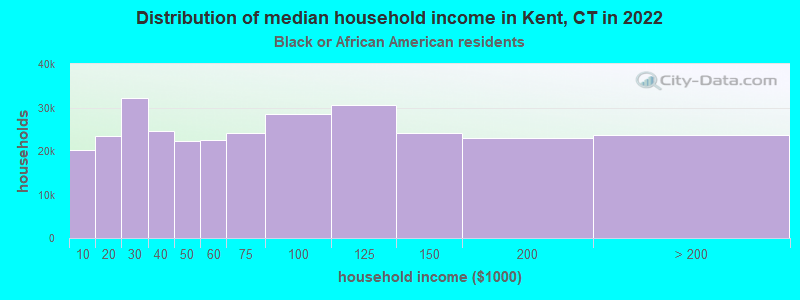
Median household income in Kent, CT in 2022:| Kent: | $120,845 |
| State: | $61,803 |
Change in median household income between 2000 and 2022:| Kent, Connecticut: | +60.9% |
| Connecticut: | +76.1% |
Number of households with income < $10k:| Kent: | 6.8% (20,312) |
| State: | 6.8% (9,494) |
Number of households with income $10k - 20k:| Kent: | 7.9% (23,540) |
| State: | 7.9% (11,003) |
Number of households with income $20k - 30k:| Kent: | 10.8% (32,188) |
| State: | 10.8% (15,045) |
Number of households with income $30k - 40k:| Kent: | 8.2% (24,605) |
| State: | 8.2% (11,501) |
Number of households with income $40k - 50k:| Kent: | 7.4% (22,284) |
| State: | 7.4% (10,416) |
Number of households with income $50k - 60k:| Kent: | 7.5% (22,537) |
| Connecticut: | 7.5% (10,534) |
Number of households with income $60k - 75k:| Kent: | 8.0% (24,056) |
| State: | 8.0% (11,244) |
Number of households with income $75k - 100k:| Kent: | 9.6% (28,604) |
| State: | 9.6% (13,370) |
Number of households with income $100k - 125k:| Kent: | 10.2% (30,474) |
| State: | 10.2% (14,244) |
Number of households with income $125k - 150k:| Kent: | 8.0% (24,060) |
| State: | 8.0% (11,246) |
Number of households with income $150k - 200k:| Kent: | 7.7% (22,949) |
| State: | 7.7% (10,727) |
Number of households with income > $200k:| Kent: | 7.9% (23,718) |
| State: | 7.9% (11,086) |
Aggregate household income in Kent in 2022: $5,406,188
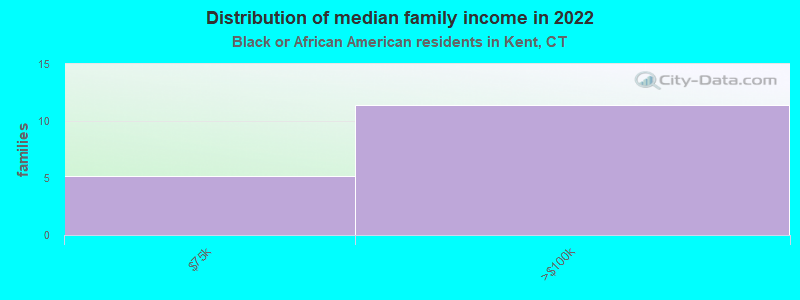
Median family income in Kent in 2022:| Kent: | $166,875 |
| State: | $87,228 |
Number of families with income $60k - 75k:| Kent: | 31.5% (5) |
| Connecticut: | 8.2% (6,861) |
Number of families with income $75k - 100k:| Kent: | 68.5% (11) |
| State: | 12.7% (10,598) |
Median per capita income in Kent in 2022:| Kent: | $50,799 |
| State: | $36,289 |
Change in median per capita income between 2000 and 2022:| Kent, Connecticut: | +115.2% |
| State: | +117.5% |
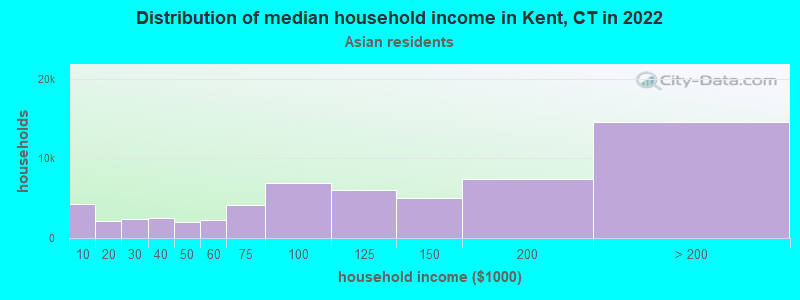
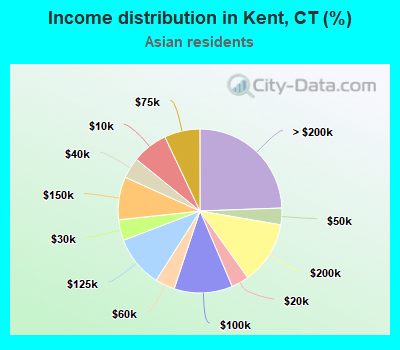
Income statistics for Asian residents
Median household income in Kent, CT in 2022:| Kent: | $128,679 |
| State: | $110,568 |
Change in median household income between 2000 and 2022:| Kent, Connecticut: | +110.1% |
| State: | +79.5% |
Number of households with income < $10k:| Kent: | 7.1% (4,222) |
| State: | 7.1% (4,245) |
Number of households with income $10k - 20k:| Kent: | 3.5% (2,076) |
| Connecticut: | 3.5% (2,087) |
Number of households with income $20k - 30k:| Kent: | 4.1% (2,451) |
| State: | 4.1% (2,464) |
Number of households with income $30k - 40k:| Kent: | 4.1% (2,464) |
| State: | 4.1% (2,478) |
Number of households with income $40k - 50k:| Kent: | 3.3% (1,972) |
| State: | 3.3% (1,983) |
Number of households with income $50k - 60k:| Kent: | 3.9% (2,315) |
| State: | 3.9% (2,328) |
Number of households with income $60k - 75k:| Kent: | 7.0% (4,205) |
| State: | 7.0% (4,228) |
Number of households with income $75k - 100k:| Kent: | 11.5% (6,873) |
| Connecticut: | 11.5% (6,911) |
Number of households with income $100k - 125k:| Kent: | 10.2% (6,093) |
| State: | 10.2% (6,127) |
Number of households with income $125k - 150k:| Kent: | 8.5% (5,051) |
| Connecticut: | 8.5% (5,079) |
Number of households with income $150k - 200k:| Kent: | 12.4% (7,393) |
| Connecticut: | 12.4% (7,434) |
Number of households with income > $200k:| Kent: | 24.4% (14,581) |
| State: | 24.4% (14,661) |
Aggregate household income in Kent in 2022: $1,872,108
Median family income in Kent in 2022:| Kent: | $127,284 |
| Connecticut: | $134,548 |
Median per capita income in Kent in 2022:| Kent: | $30,921 |
| State: | $55,295 |
Change in median per capita income between 2000 and 2022:| Kent, Connecticut: | +103.6% |
| State: | +97.8% |
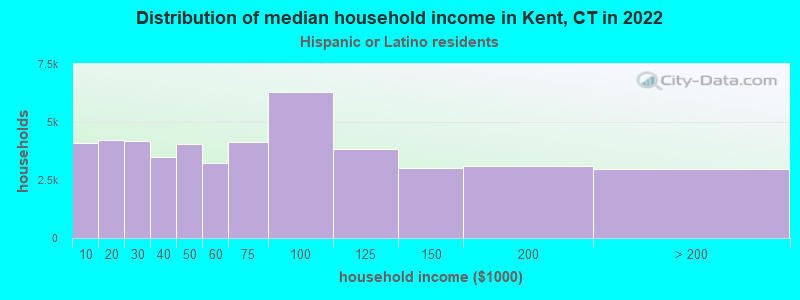
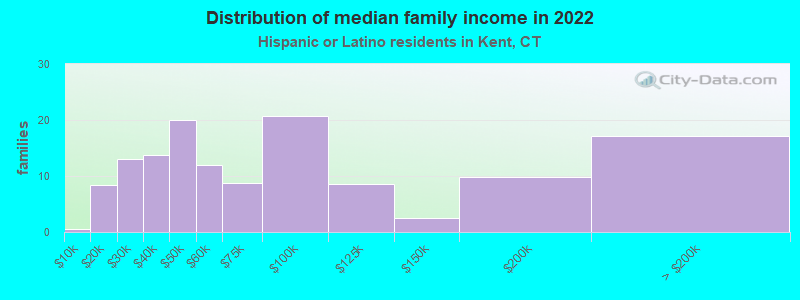
Income statistics for Hispanic or Latino residents
Median household income in Kent, CT in 2022:| Kent: | $11,798 |
| State: | $60,275 |
Change in median household income between 2000 and 2022:| Kent, Connecticut: | +67.8% |
| State: | +87.9% |
Number of households with income < $10k:| Kent: | 8.7% (4,074) |
| State: | 8.7% (18,584) |
Number of households with income $10k - 20k:| Kent: | 9.1% (4,217) |
| State: | 9.1% (19,235) |
Number of households with income $20k - 30k:| Kent: | 8.9% (4,163) |
| State: | 8.9% (18,989) |
Number of households with income $30k - 40k:| Kent: | 7.5% (3,500) |
| State: | 7.5% (15,967) |
Number of households with income $40k - 50k:| Kent: | 8.7% (4,048) |
| State: | 8.7% (18,466) |
Number of households with income $50k - 60k:| Kent: | 6.9% (3,224) |
| Connecticut: | 6.9% (14,706) |
Number of households with income $60k - 75k:| Kent: | 8.9% (4,140) |
| State: | 8.9% (18,888) |
Number of households with income $75k - 100k:| Kent: | 13.5% (6,284) |
| State: | 13.5% (28,669) |
Number of households with income $100k - 125k:| Kent: | 8.2% (3,822) |
| State: | 8.2% (17,434) |
Number of households with income $125k - 150k:| Kent: | 6.5% (3,015) |
| State: | 6.5% (13,752) |
Number of households with income $150k - 200k:| Kent: | 6.6% (3,094) |
| State: | 6.6% (14,114) |
Number of households with income > $200k:| Kent: | 6.4% (2,988) |
| State: | 6.4% (13,630) |
Aggregate household income in Kent in 2022: $1,888,809
Median family income in Kent in 2022:| Kent: | $62,017 |
| State: | $68,336 |
Number of families with income < $10k:| Kent: | 0.4% (1) |
| State: | 5.2% (7,456) |
Number of families with income $10k - 20k:| Kent: | 6.2% (8) |
| State: | 6.0% (8,616) |
Number of families with income $20k - 30k:| Kent: | 9.6% (13) |
| State: | 8.9% (12,680) |
Number of families with income $30k - 40k:| Kent: | 10.1% (14) |
| State: | 8.5% (12,090) |
Number of families with income $40k - 50k:| Kent: | 14.8% (20) |
| State: | 8.8% (12,624) |
Number of families with income $50k - 60k:| Kent: | 8.9% (12) |
| State: | 8.4% (11,924) |
Number of families with income $60k - 75k:| Kent: | 6.4% (9) |
| State: | 8.9% (12,677) |
Number of families with income $75k - 100k:| Kent: | 15.3% (21) |
| Connecticut: | 14.3% (20,457) |
Number of families with income $100k - 125k:| Kent: | 6.4% (9) |
| State: | 8.2% (11,720) |
Number of families with income $125k - 150k:| Kent: | 1.9% (3) |
| State: | 8.2% (11,729) |
Number of families with income $150k - 200k:| Kent: | 7.3% (10) |
| State: | 7.1% (10,096) |
Number of families with income > $200k:| Kent: | 12.7% (17) |
| State: | 7.4% (10,622) |
Median non-family income in Kent in 2022:| Kent: | $10,868 |
| State: | $36,714 |
Change in median non-family income between 2000 and 2022:| Kent, Connecticut: | +73.9% |
| State: | +90.0% |
Median per capita income in Kent in 2022:| Kent: | $47,620 |
| State: | $28,507 |
Change in median per capita income between 2000 and 2022:| Kent, Connecticut: | +80.3% |
| State: | +117.2% |
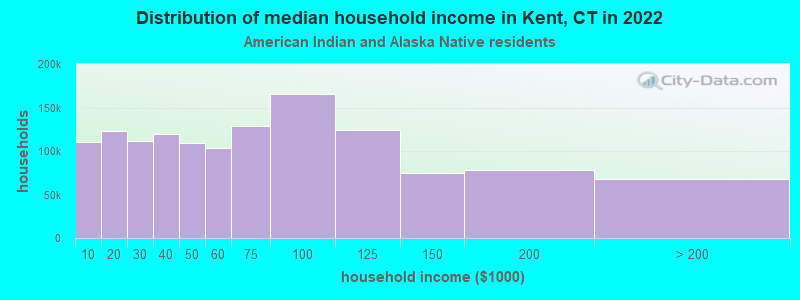
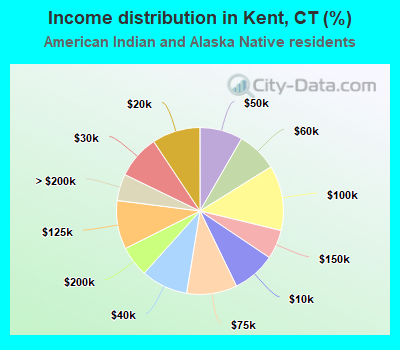
Income statistics for American Indian and Alaska Native residents
Median household income in Kent, CT in 2022:| Kent: | $43,735 |
| State: | $41,848 |
Change in median household income between 2000 and 2022:| Kent, Connecticut: | +12.9% |
| Connecticut: | +12.9% |
Number of households with income < $10k:| Kent: | 8.4% (110,188) |
| State: | 10.2% (340) |
Number of households with income $10k - 20k:| Kent: | 9.4% (122,967) |
| State: | 8.5% (283) |
Number of households with income $20k - 30k:| Kent: | 8.5% (111,225) |
| State: | 9.4% (314) |
Number of households with income $30k - 40k:| Kent: | 9.1% (119,164) |
| Connecticut: | 10.1% (337) |
Number of households with income $40k - 50k:| Kent: | 8.3% (109,305) |
| State: | 13.4% (447) |
Number of households with income $50k - 60k:| Kent: | 7.8% (103,066) |
| State: | 3.1% (104) |
Number of households with income $60k - 75k:| Kent: | 9.8% (128,467) |
| State: | 5.6% (188) |
Number of households with income $75k - 100k:| Kent: | 12.6% (165,830) |
| Connecticut: | 13.4% (447) |
Number of households with income $100k - 125k:| Kent: | 9.4% (124,008) |
| State: | 9.5% (317) |
Number of households with income $125k - 150k:| Kent: | 5.6% (74,243) |
| Connecticut: | 3.9% (131) |
Number of households with income $150k - 200k:| Kent: | 6.0% (78,266) |
| State: | 6.3% (212) |
Number of households with income > $200k:| Kent: | 5.2% (67,744) |
| State: | 6.8% (228) |
Aggregate household income in Kent in 2022: $192,269
Median family income in Kent in 2022:| Kent: | $52,949 |
| State: | $57,217 |
Median per capita income in Kent in 2022:| Kent: | $21,881 |
| State: | $25,355 |
Change in median per capita income between 2000 and 2022:| Kent, Connecticut: | +45.9% |
| Connecticut: | +39.4% |
Income statistics for other residents
Aggregate household income in Kent in 2022: $1,569,373
Median family income in Kent in 2022:| Kent: | $85,181 |
| State: | $67,610 |
Median per capita income in Kent in 2022:| Kent: | $77,821 |
| State: | $29,353 |