King Lake, Nebraska (NE) income map, earnings map, and wages data
Data:
The per capita income in 2022 was $24,897, which means an increase of 8.1% compared to 2000 when it was $22,879.
Whole page based on the data from 2000 / 2022 when the population of King Lake, Nebraska was 280 / 71
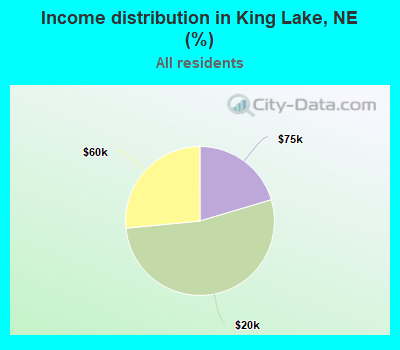
Income statistics for all residents
Number of households with income < $10k:| King Lake: | 0.0% (0) |
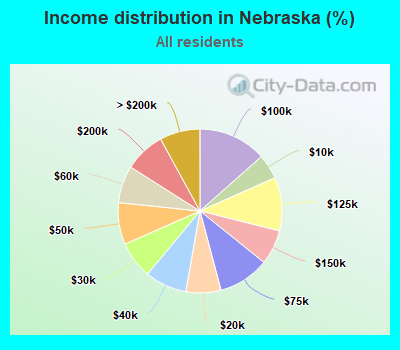
| State: | 4.9% (39,385) |
Number of households with income $10k - 20k:| King Lake: | 53.1% (26) |
| Nebraska: | 6.9% (55,520) |
Number of households with income $20k - 30k:| King Lake: | 0.0% (0) |
| Nebraska: | 7.3% (58,969) |
Number of households with income $30k - 40k:| King Lake: | 0.0% (0) |
| State: | 8.3% (66,349) |
Number of households with income $40k - 50k:| King Lake: | 0.0% (0) |
| State: | 8.3% (66,330) |
Number of households with income $50k - 60k:| King Lake: | 26.5% (13) |
| State: | 7.3% (58,981) |
Number of households with income $60k - 75k:| King Lake: | 20.4% (10) |
| State: | 10.1% (80,982) |
Number of households with income $75k - 100k:| King Lake: | 0.0% (0) |
| State: | 13.5% (108,056) |
Number of households with income $100k - 125k:| King Lake: | 0.0% (0) |
| Nebraska: | 10.6% (84,921) |
Number of households with income $125k - 150k:| King Lake: | 0.0% (0) |
| State: | 6.9% (55,106) |
Number of households with income $150k - 200k:| King Lake: | 0.0% (0) |
| State: | 8.0% (64,623) |
Number of households with income > $200k:| King Lake: | 0.0% (0) |
| State: | 8.0% (63,935) |
Aggregate household income in King Lake in 2022: $1,794,683
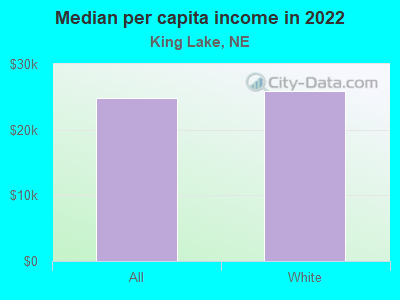
Median per capita income in King Lake in 2022:| King Lake: | $24,897 |
| State: | $38,997 |
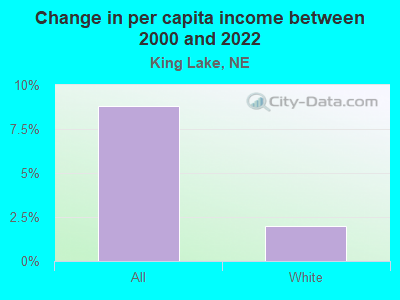
Change in median per capita income between 2000 and 2022:| King Lake, Nebraska: | +8.8% |
| State: | +98.8% |
Income statistics for White residents
Number of households with income < $10k:| King Lake: | 0.0% (0) |
| Nebraska: | 4.5% (30,161) |
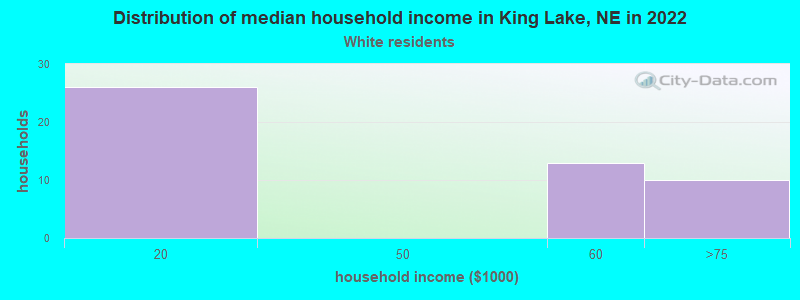
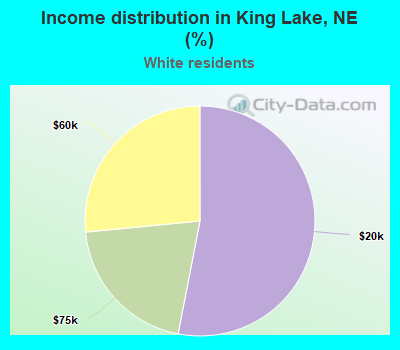
Number of households with income $10k - 20k:| King Lake: | 53.1% (26) |
| Nebraska: | 6.6% (44,570) |
Number of households with income $20k - 30k:| King Lake: | 0.0% (0) |
| Nebraska: | 7.0% (47,313) |
Number of households with income $30k - 40k:| King Lake: | 0.0% (0) |
| Nebraska: | 8.0% (53,672) |
Number of households with income $40k - 50k:| King Lake: | 0.0% (0) |
| State: | 8.1% (54,226) |
Number of households with income $50k - 60k:| King Lake: | 26.5% (13) |
| Nebraska: | 7.3% (49,363) |
Number of households with income $60k - 75k:| King Lake: | 20.4% (10) |
| State: | 10.0% (67,227) |
Number of households with income $75k - 100k:| King Lake: | 0.0% (0) |
| Nebraska: | 13.2% (88,988) |
Number of households with income $100k - 125k:| King Lake: | 0.0% (0) |
| State: | 10.8% (72,291) |
Number of households with income $125k - 150k:| King Lake: | 0.0% (0) |
| State: | 7.2% (48,670) |
Number of households with income $150k - 200k:| King Lake: | 0.0% (0) |
| Nebraska: | 8.7% (58,306) |
Number of households with income > $200k:| King Lake: | 0.0% (0) |
| State: | 8.5% (57,020) |
Aggregate household income in King Lake in 2022: $1,746,798
Median per capita income in King Lake in 2022:| King Lake: | $25,872 |
| State: | $42,734 |
Change in median per capita income between 2000 and 2022:| King Lake, Nebraska: | +2.0% |
| State: | +108.4% |