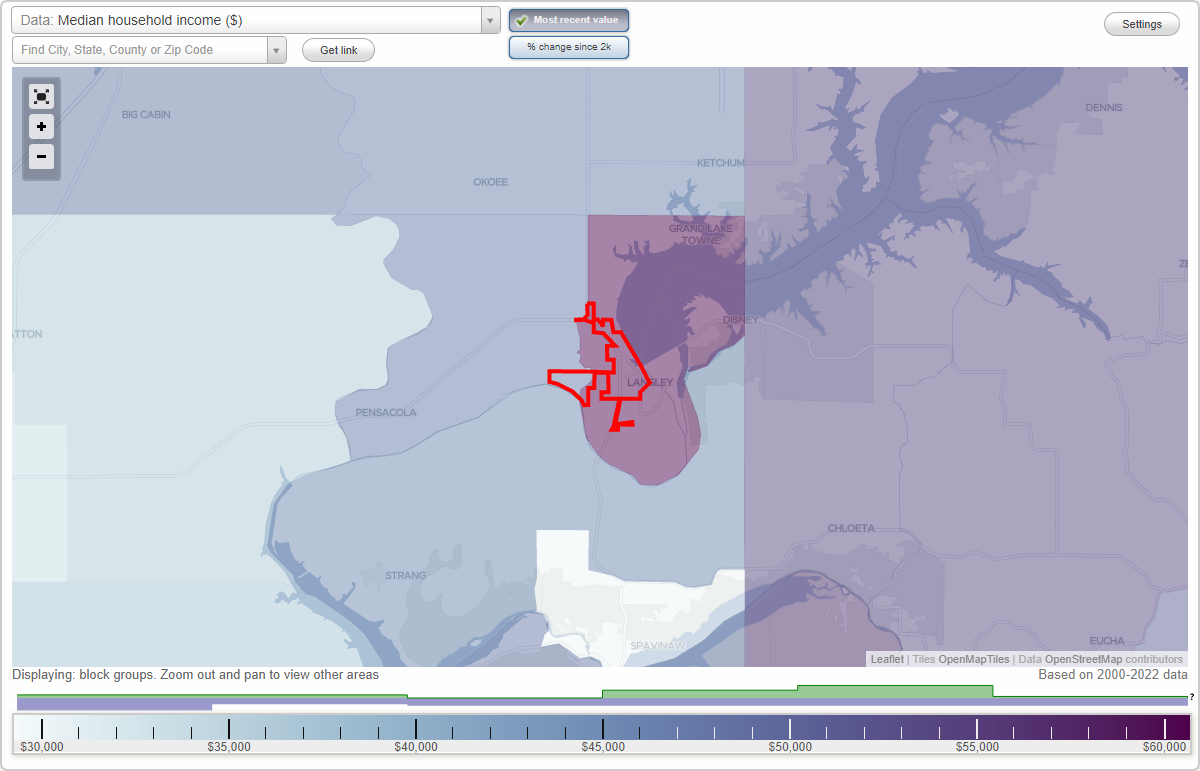
The median household income in Langley, OK in 2022 was $49,837, which was 19.7% less than the median annual income of $59,673 across the entire state of Oklahoma. Compared to the median income of $22,500 in 2000 this represents an increase of 54.9%. The per capita income in 2022 was $27,528, which means an increase of 58.1% compared to 2000 when it was $11,542.
Whole page based on the data from 2000 / 2022 when the population of Langley, Oklahoma was 669 / 578
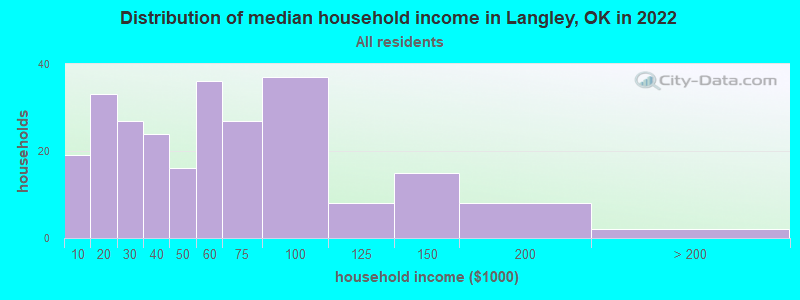
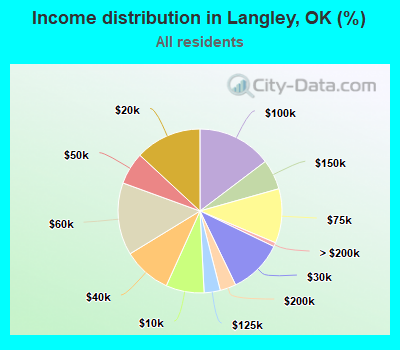
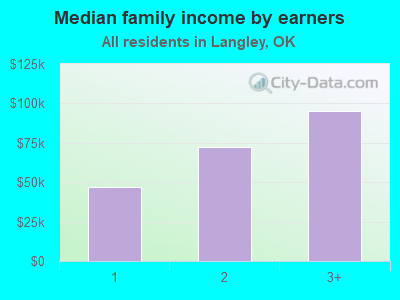
Income statistics for all residents
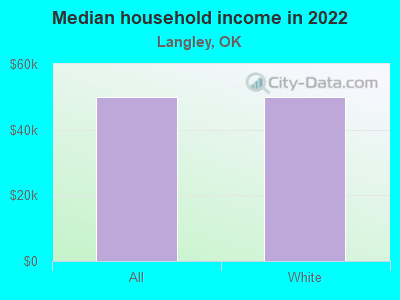
Median household income in Langley, OK in 2022:
Langley:
$49,838
State:
$59,673
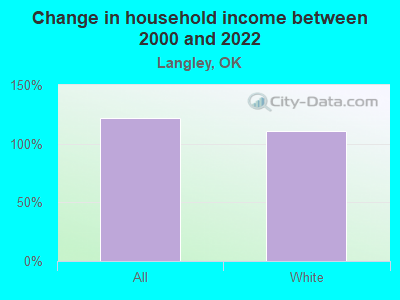
Change in median household income between 2000 and 2022:
Langley, Oklahoma:
+121.5%
Oklahoma:
+78.7%
Number of households with income < $10k:
Langley:
7.5% (19)
State:
6.4% (100,950)
Number of households with income $10k - 20k:
Langley:
13.1% (33)
Oklahoma:
8.8% (137,709)
Number of households with income $20k - 30k:
Langley:
10.7% (27)
State:
9.1% (143,661)
Number of households with income $30k - 40k:
Langley:
9.5% (24)
State:
9.0% (141,098)
Number of households with income $40k - 50k:
Langley:
6.3% (16)
Oklahoma:
8.9% (140,217)
Number of households with income $50k - 60k:
Langley:
14.3% (36)
State:
8.1% (126,882)
Number of households with income $60k - 75k:
Langley:
10.7% (27)
State:
10.0% (157,916)
Number of households with income $75k - 100k:
Langley:
14.7% (37)
Oklahoma:
12.4% (195,015)
Number of households with income $100k - 125k:
Langley:
3.2% (8)
Oklahoma:
9.0% (141,779)
Number of households with income $125k - 150k:
Langley:
6.0% (15)
State:
5.8% (91,594)
Number of households with income $150k - 200k:
Langley:
3.2% (8)
State:
6.3% (98,589)
Number of households with income > $200k:
Langley:
0.8% (2)
Oklahoma:
6.2% (97,770)
Aggregate household income in Langley in 2022: $15,106,634
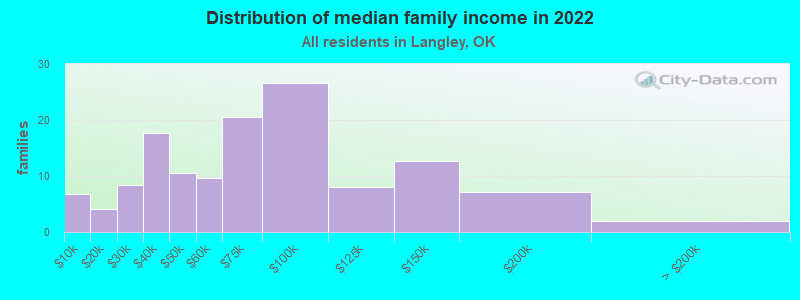
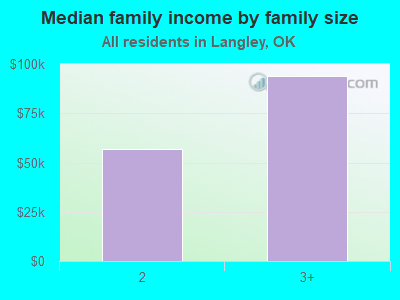
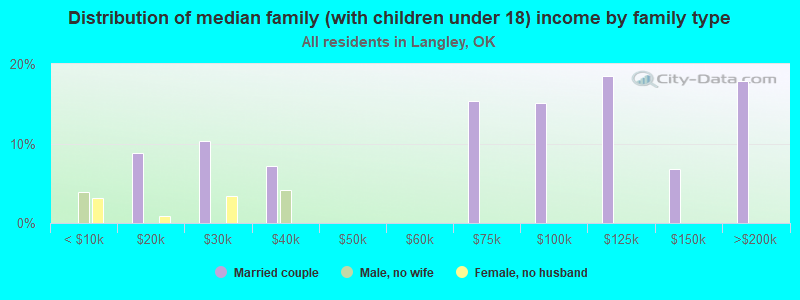
Median family income in Langley in 2022:
Langley:
$66,638
Oklahoma:
$75,476
Number of families with income < $10k:
Langley:
5.1% (7)
State:
4.2% (42,724)
Number of families with income $10k - 20k:
Langley:
3.0% (4)
State:
4.9% (49,571)
Number of families with income $20k - 30k:
Langley:
6.3% (8)
State:
6.3% (64,367)
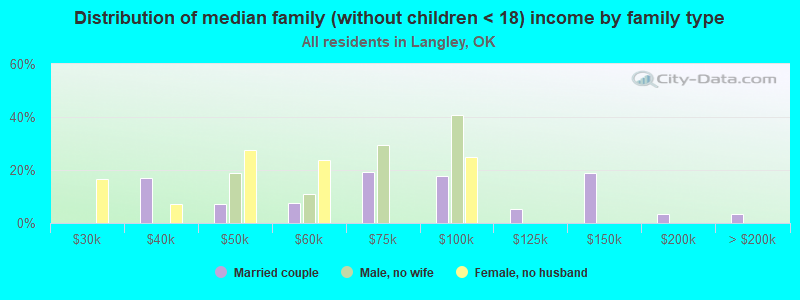
Number of families with income $30k - 40k:
Langley:
13.2% (18)
Oklahoma:
7.5% (76,467)
Number of families with income $40k - 50k:
Langley:
7.9% (11)
State:
8.3% (84,578)
Number of families with income $50k - 60k:
Langley:
7.2% (10)
State:
7.8% (79,642)
Number of families with income $60k - 75k:
Langley:
15.3% (21)
Oklahoma:
10.6% (108,169)
Number of families with income $75k - 100k:
Langley:
19.8% (27)
State:
14.6% (148,857)
Number of families with income $100k - 125k:
Langley:
6.0% (8)
State:
11.2% (113,480)
Number of families with income $125k - 150k:
Langley:
9.4% (13)
State:
7.6% (77,253)
Number of families with income $150k - 200k:
Langley:
5.3% (7)
State:
8.4% (85,947)
Number of families with income > $200k:
Langley:
1.5% (2)
Oklahoma:
8.5% (86,531)
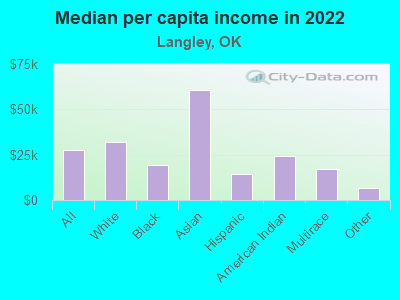
Median per capita income in Langley in 2022:
Langley:
$27,529
Oklahoma:
$32,930
Change in median per capita income between 2000 and 2022:
Langley, Oklahoma:
+138.5%
State:
+86.6%
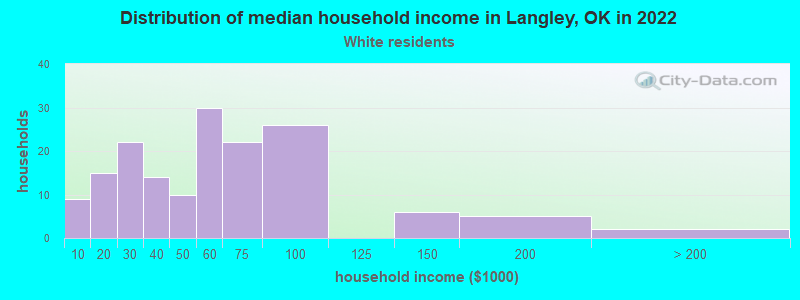
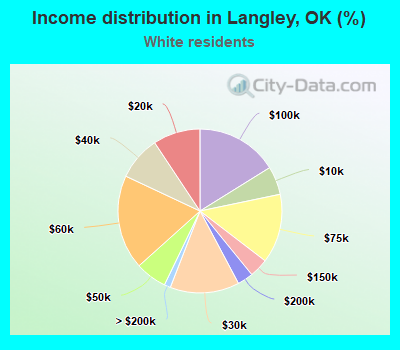
Income statistics for White residents
Median household income in Langley, OK in 2022:
Langley:
$50,089
Oklahoma:
$63,444
Change in median household income between 2000 and 2022:
Langley, Oklahoma:
+110.9%
State:
+79.3%
Number of households with income < $10k:
Langley:
5.6% (9)
Oklahoma:
5.5% (60,994)
Number of households with income $10k - 20k:
Langley:
9.3% (15)
Oklahoma:
8.2% (91,263)
Number of households with income $20k - 30k:
Langley:
13.7% (22)
State:
8.7% (96,988)
Number of households with income $30k - 40k:
Langley:
8.7% (14)
Oklahoma:
8.4% (93,121)
Number of households with income $40k - 50k:
Langley:
6.2% (10)
Oklahoma:
8.6% (95,446)
Number of households with income $50k - 60k:
Langley:
18.6% (30)
Oklahoma:
7.9% (87,723)
Number of households with income $60k - 75k:
Langley:
13.7% (22)
Oklahoma:
9.9% (109,955)
Number of households with income $75k - 100k:
Langley:
16.1% (26)
Oklahoma:
12.9% (143,880)
Number of households with income $100k - 125k:
Langley:
0.0% (0)
Oklahoma:
9.7% (107,851)
Number of households with income $125k - 150k:
Langley:
3.7% (6)
State:
6.3% (69,802)
Number of households with income $150k - 200k:
Langley:
3.1% (5)
State:
6.9% (76,863)
Number of households with income > $200k:
Langley:
1.2% (2)
State:
7.0% (78,099)
Aggregate household income in Langley in 2022: $9,720,853
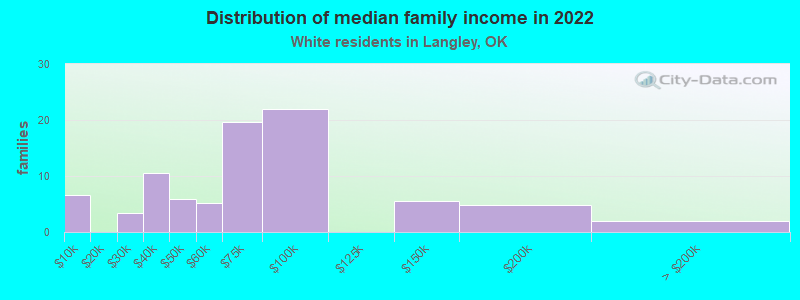
Median family income in Langley in 2022:
Langley:
$67,961
State:
$82,251
Number of families with income < $10k:
Langley:
7.8% (7)
State:
3.4% (24,057)
Number of families with income $20k - 30k:
Langley:
4.0% (3)
State:
5.7% (40,670)
Number of families with income $30k - 40k:
Langley:
12.4% (11)
State:
6.5% (46,540)
Number of families with income $40k - 50k:
Langley:
6.9% (6)
Oklahoma:
7.7% (55,082)
Number of families with income $50k - 60k:
Langley:
6.0% (5)
State:
7.5% (53,408)
Number of families with income $60k - 75k:
Langley:
22.8% (20)
State:
10.4% (74,624)
Number of families with income $75k - 100k:
Langley:
25.6% (22)
State:
15.3% (109,679)
Number of families with income $125k - 150k:
Langley:
6.5% (6)
State:
8.3% (59,328)
Number of families with income $150k - 200k:
Langley:
5.7% (5)
State:
9.4% (67,640)
Number of families with income > $200k:
Langley:
2.3% (2)
State:
9.7% (69,551)
Median per capita income in Langley in 2022:
Langley:
$31,714
State:
$37,390
Income statistics for Black or African American residents
Aggregate household income in Langley in 2022: $125,338
Median per capita income in Langley in 2022:
Langley:
$19,089
State:
$24,741
Change in median per capita income between 2000 and 2022:
Langley, Oklahoma:
+85.0%
Oklahoma:
+98.7%
Income statistics for Asian residents
Median per capita income in Langley in 2022:
Langley:
$60,479
State:
$36,283
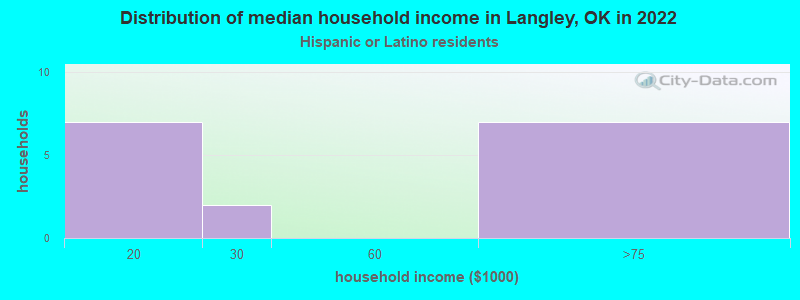
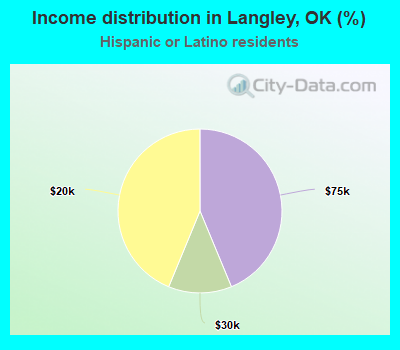
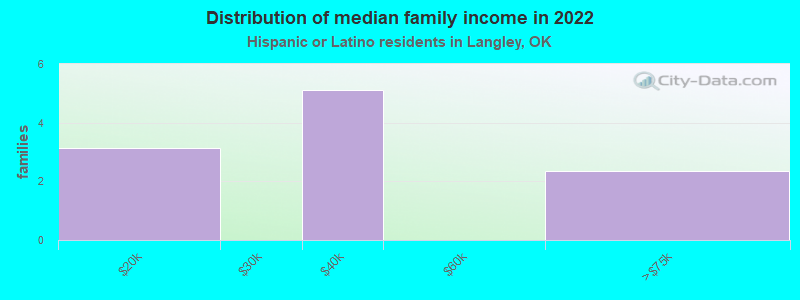
Income statistics for Hispanic or Latino residents
Number of households with income < $10k:
Langley:
0.0% (0)
State:
6.0% (7,958)
Number of households with income $10k - 20k:
Langley:
43.8% (7)
Oklahoma:
8.4% (11,153)
Number of households with income $20k - 30k:
Langley:
12.5% (2)
State:
9.7% (13,003)
Number of households with income $30k - 40k:
Langley:
0.0% (0)
Oklahoma:
11.7% (15,624)
Number of households with income $40k - 50k:
Langley:
0.0% (0)
State:
11.0% (14,697)
Number of households with income $50k - 60k:
Langley:
0.0% (0)
Oklahoma:
9.6% (12,832)
Number of households with income $60k - 75k:
Langley:
43.8% (7)
State:
12.2% (16,321)
Number of households with income $75k - 100k:
Langley:
0.0% (0)
State:
12.5% (16,668)
Number of households with income $100k - 125k:
Langley:
0.0% (0)
State:
7.5% (9,988)
Number of households with income $125k - 150k:
Langley:
0.0% (0)
Oklahoma:
4.5% (6,042)
Number of households with income $150k - 200k:
Langley:
0.0% (0)
State:
3.8% (5,080)
Number of households with income > $200k:
Langley:
0.0% (0)
State:
3.0% (4,063)
Aggregate household income in Langley in 2022: $637,453
Median family income in Langley in 2022:
Langley:
$35,523
State:
$55,896
Median per capita income in Langley in 2022:
Langley:
$14,236
Oklahoma:
$19,473
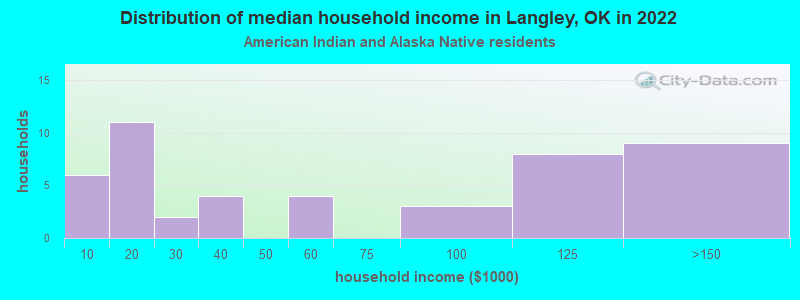
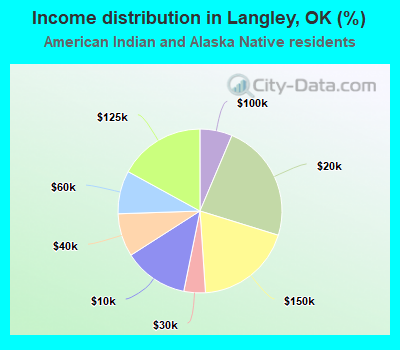
Income statistics for American Indian and Alaska Native residents
Number of households with income < $10k:
Langley:
12.8% (6)
State:
8.0% (7,959)
Number of households with income $10k - 20k:
Langley:
23.4% (11)
State:
11.2% (11,175)
Number of households with income $20k - 30k:
Langley:
4.3% (2)
State:
9.7% (9,654)
Number of households with income $30k - 40k:
Langley:
8.5% (4)
Oklahoma:
9.1% (9,092)
Number of households with income $40k - 50k:
Langley:
0.0% (0)
State:
9.1% (9,020)
Number of households with income $50k - 60k:
Langley:
8.5% (4)
State:
8.8% (8,714)
Number of households with income $60k - 75k:
Langley:
0.0% (0)
State:
10.7% (10,616)
Number of households with income $75k - 100k:
Langley:
6.4% (3)
Oklahoma:
11.5% (11,402)
Number of households with income $100k - 125k:
Langley:
17.0% (8)
State:
8.8% (8,769)
Number of households with income $125k - 150k:
Langley:
19.1% (9)
State:
5.0% (4,965)
Number of households with income $150k - 200k:
Langley:
0.0% (0)
State:
4.5% (4,512)
Number of households with income > $200k:
Langley:
0.0% (0)
State:
3.6% (3,569)
Aggregate household income in Langley in 2022: $2,985,069
Median per capita income in Langley in 2022:
Langley:
$24,538
Oklahoma:
$25,549
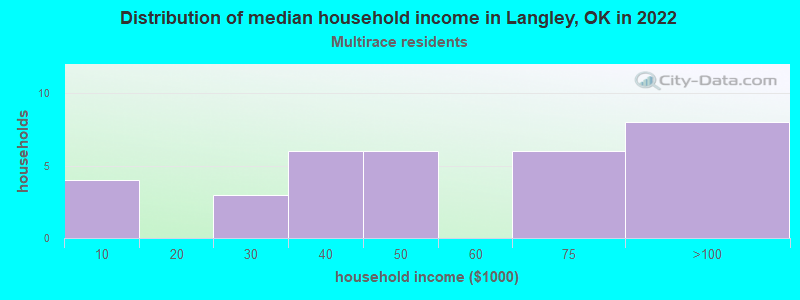
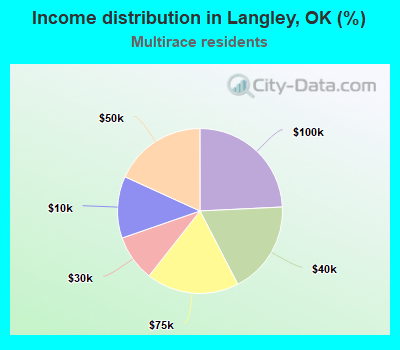
Income statistics for Multirace residents
Number of households with income < $10k:
Langley:
12.1% (4)
Oklahoma:
6.8% (11,975)
Number of households with income $10k - 20k:
Langley:
0.0% (0)
Oklahoma:
8.9% (15,797)
Number of households with income $20k - 30k:
Langley:
9.1% (3)
State:
10.2% (18,071)
Number of households with income $30k - 40k:
Langley:
18.2% (6)
Oklahoma:
11.0% (19,477)
Number of households with income $40k - 50k:
Langley:
18.2% (6)
State:
9.3% (16,501)
Number of households with income $50k - 60k:
Langley:
0.0% (0)
Oklahoma:
8.9% (15,635)
Number of households with income $60k - 75k:
Langley:
18.2% (6)
Oklahoma:
10.9% (19,250)
Number of households with income $75k - 100k:
Langley:
24.2% (8)
Oklahoma:
11.5% (20,279)
Number of households with income $100k - 125k:
Langley:
0.0% (0)
State:
8.0% (14,067)
Number of households with income $125k - 150k:
Langley:
0.0% (0)
Oklahoma:
4.9% (8,612)
Number of households with income $150k - 200k:
Langley:
0.0% (0)
State:
5.0% (8,897)
Number of households with income > $200k:
Langley:
0.0% (0)
Oklahoma:
4.5% (7,970)
Aggregate household income in Langley in 2022: $1,655,866
Median non-family income in Langley in 2022:
Langley:
$34,624
State:
$34,773
Change in median non-family income between 2000 and 2022:
Langley, Oklahoma:
+113.1%
Oklahoma:
+103.1%
Median per capita income in Langley in 2022:
Langley:
$17,200
Oklahoma:
$23,085
Change in median per capita income between 2000 and 2022:
Langley, Oklahoma:
+53.3%
State:
+93.8%
Income statistics for other residents
Median per capita income in Langley in 2022:
Langley:
$6,473
Oklahoma:
$21,007
Discuss Langley, Oklahoma (OK) on our hugely popular Oklahoma forum.