Little Rice, Wisconsin (WI) income map, earnings map, and wages data
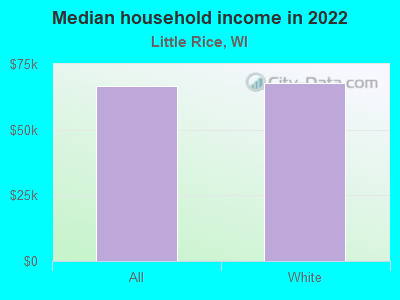
The median household income in Little Rice, WI in 2022 was $66,723, which was 6.4% less than the median annual income of $70,996 across the entire state of Wisconsin. Compared to the median income of $40,750 in 2000 this represents an increase of 38.9%. The per capita income in 2022 was $41,530, which means an increase of 47.8% compared to 2000 when it was $21,659.
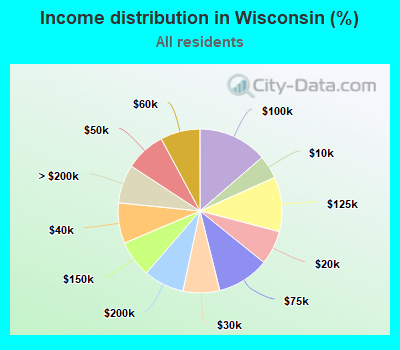
Income statistics for all residents
Median household income in Little Rice, WI in 2022:| Little Rice: | $66,723 |
| Wisconsin: | $70,996 |
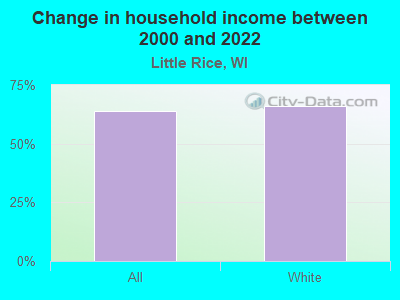
Change in median household income between 2000 and 2022:| Little Rice, Wisconsin: | +63.7% |
| Wisconsin: | +62.1% |
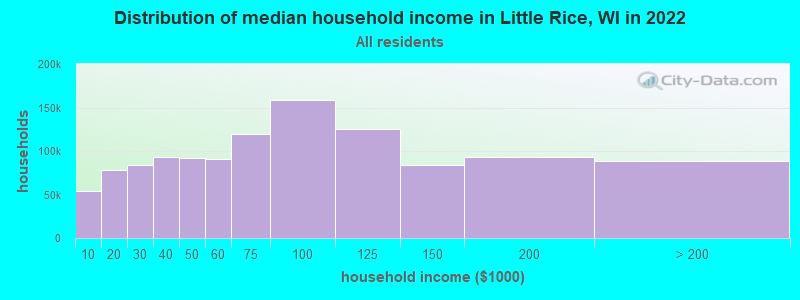
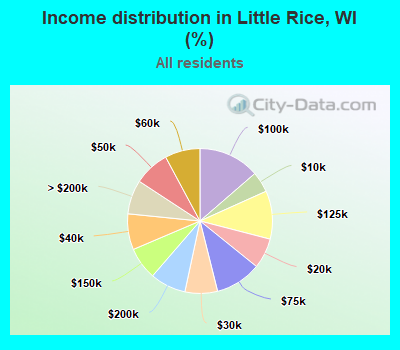
Number of households with income < $10k:| Little Rice: | 4.6% (53,797) |
| State: | 4.6% (115,058) |
Number of households with income $10k - 20k:| Little Rice: | 6.8% (78,411) |
| State: | 6.7% (167,685) |
Number of households with income $20k - 30k:| Little Rice: | 7.3% (84,264) |
| State: | 7.2% (180,435) |
Number of households with income $30k - 40k:| Little Rice: | 8.0% (93,055) |
| State: | 8.0% (199,167) |
Number of households with income $40k - 50k:| Little Rice: | 7.9% (92,192) |
| State: | 7.9% (197,648) |
Number of households with income $50k - 60k:| Little Rice: | 7.8% (91,043) |
| Wisconsin: | 7.8% (195,297) |
Number of households with income $60k - 75k:| Little Rice: | 10.3% (119,628) |
| State: | 10.3% (256,633) |
Number of households with income $75k - 100k:| Little Rice: | 13.7% (158,488) |
| State: | 13.7% (340,492) |
Number of households with income $100k - 125k:| Little Rice: | 10.8% (124,902) |
| State: | 10.8% (268,847) |
Number of households with income $125k - 150k:| Little Rice: | 7.2% (84,076) |
| State: | 7.3% (180,911) |
Number of households with income $150k - 200k:| Little Rice: | 8.0% (92,663) |
| State: | 8.0% (199,297) |
Number of households with income > $200k:| Little Rice: | 7.6% (88,346) |
| State: | 7.6% (189,651) |
Aggregate household income in Little Rice in 2022: $367,142,918
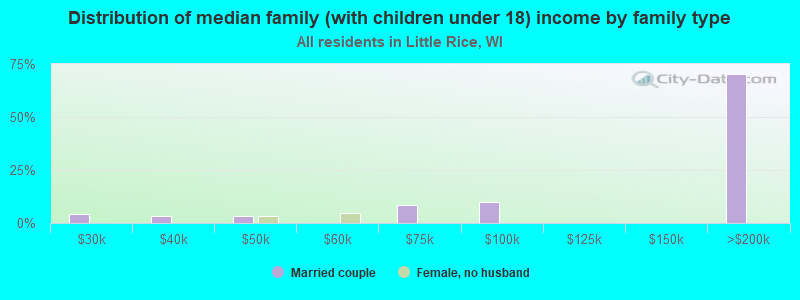
Median family income in Little Rice in 2022:| Little Rice: | $77,669 |
| State: | $91,700 |
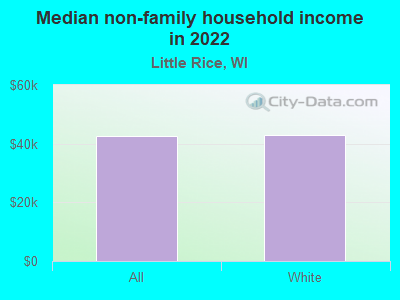
Median non-family income in Little Rice in 2022:| Little Rice: | $42,493 |
| State: | $42,812 |
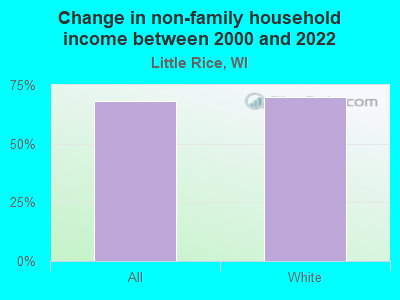
Change in median non-family income between 2000 and 2022:| Little Rice, Wisconsin: | +68.3% |
| Wisconsin: | +65.7% |
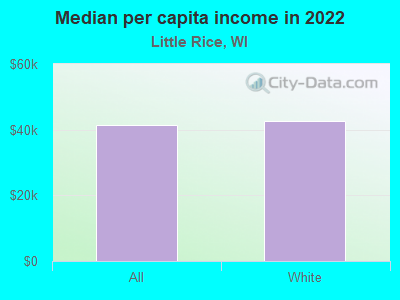
Median per capita income in Little Rice in 2022:| Little Rice: | $41,530 |
| State: | $40,188 |
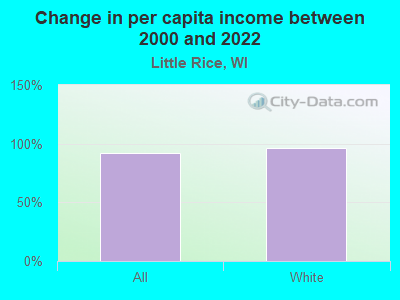
Change in median per capita income between 2000 and 2022:| Little Rice, Wisconsin: | +91.7% |
| State: | +88.9% |
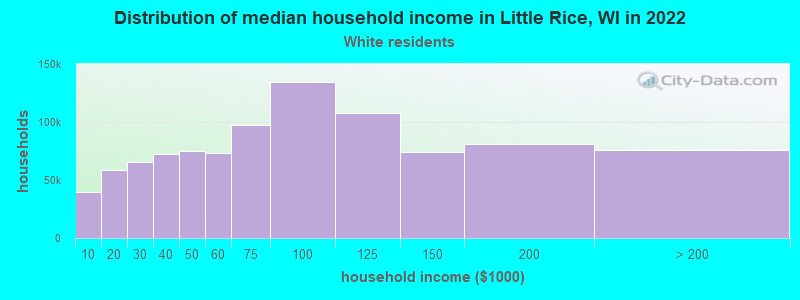
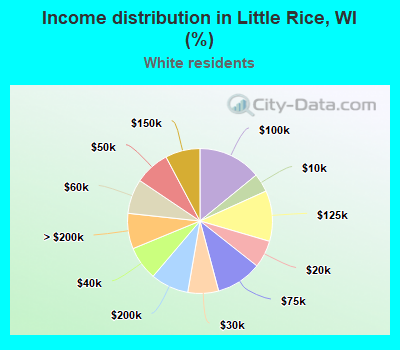
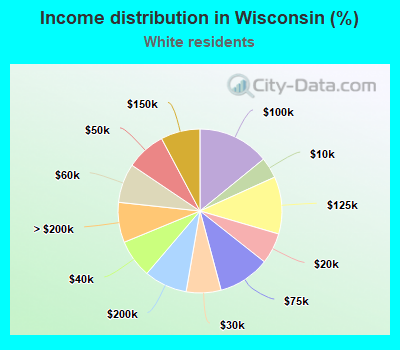
Income statistics for White residents
Median household income in Little Rice, WI in 2022:| Little Rice: | $67,610 |
| Wisconsin: | $74,405 |
Change in median household income between 2000 and 2022:| Little Rice, Wisconsin: | +65.9% |
| State: | +64.5% |
Number of households with income < $10k:| Little Rice: | 4.1% (39,401) |
| State: | 4.1% (87,410) |
Number of households with income $10k - 20k:| Little Rice: | 6.1% (58,393) |
| State: | 6.1% (129,511) |
Number of households with income $20k - 30k:| Little Rice: | 6.9% (65,460) |
| Wisconsin: | 6.9% (145,235) |
Number of households with income $30k - 40k:| Little Rice: | 7.6% (72,225) |
| State: | 7.6% (160,205) |
Number of households with income $40k - 50k:| Little Rice: | 7.8% (74,646) |
| State: | 7.8% (165,627) |
Number of households with income $50k - 60k:| Little Rice: | 7.7% (73,662) |
| State: | 7.7% (163,506) |
Number of households with income $60k - 75k:| Little Rice: | 10.2% (97,545) |
| Wisconsin: | 10.2% (216,479) |
Number of households with income $75k - 100k:| Little Rice: | 14.1% (134,660) |
| State: | 14.1% (298,984) |
Number of households with income $100k - 125k:| Little Rice: | 11.3% (107,842) |
| Wisconsin: | 11.3% (239,588) |
Number of households with income $125k - 150k:| Little Rice: | 7.8% (74,065) |
| State: | 7.8% (164,502) |
Number of households with income $150k - 200k:| Little Rice: | 8.5% (81,078) |
| Wisconsin: | 8.5% (180,048) |
Number of households with income > $200k:| Little Rice: | 7.9% (75,701) |
| Wisconsin: | 7.9% (167,999) |
Aggregate household income in Little Rice in 2022: $322,238,311
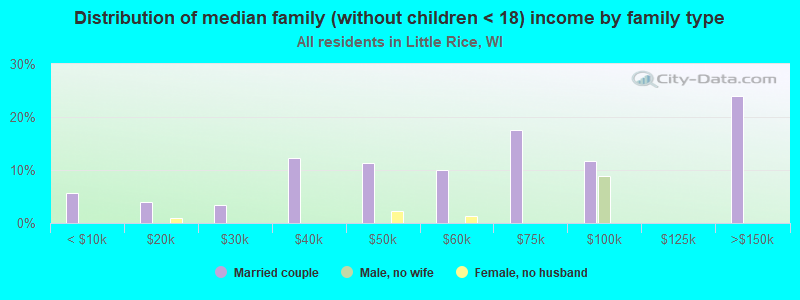
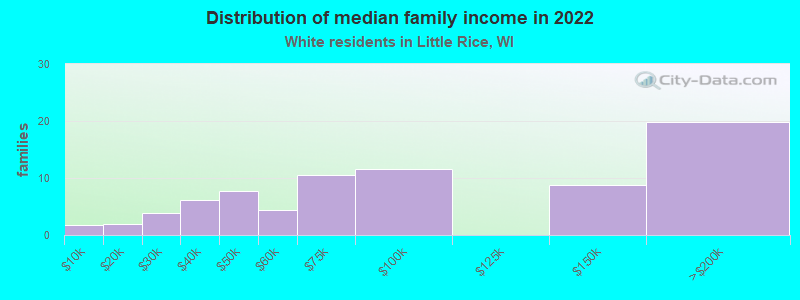
Median family income in Little Rice in 2022:| Little Rice: | $78,919 |
| State: | $96,327 |
Number of families with income < $10k:| Little Rice: | 2.2% (2) |
| State: | 2.0% (25,684) |
Number of families with income $10k - 20k:| Little Rice: | 2.6% (2) |
| State: | 2.4% (30,426) |
Number of families with income $20k - 30k:| Little Rice: | 5.1% (4) |
| State: | 3.5% (45,298) |
Number of families with income $30k - 40k:| Little Rice: | 8.0% (6) |
| State: | 4.9% (62,935) |
Number of families with income $40k - 50k:| Little Rice: | 10.0% (8) |
| State: | 6.0% (76,575) |
Number of families with income $50k - 60k:| Little Rice: | 5.8% (4) |
| State: | 6.9% (88,079) |
Number of families with income $60k - 75k:| Little Rice: | 13.7% (10) |
| Wisconsin: | 10.6% (136,022) |
Number of families with income $75k - 100k:| Little Rice: | 15.1% (12) |
| State: | 16.0% (204,807) |
Number of families with income $125k - 150k:| Little Rice: | 11.5% (9) |
| Wisconsin: | 10.2% (131,464) |
Number of families with income $150k - 200k:| Little Rice: | 25.8% (20) |
| Wisconsin: | 12.1% (155,060) |
Median non-family income in Little Rice in 2022:| Little Rice: | $42,933 |
| State: | $44,213 |
Change in median non-family income between 2000 and 2022:| Little Rice, Wisconsin: | +70.0% |
| State: | +68.5% |
Median per capita income in Little Rice in 2022:| Little Rice: | $42,583 |
| State: | $43,415 |
Change in median per capita income between 2000 and 2022:| Little Rice, Wisconsin: | +96.6% |
| Wisconsin: | +94.0% |