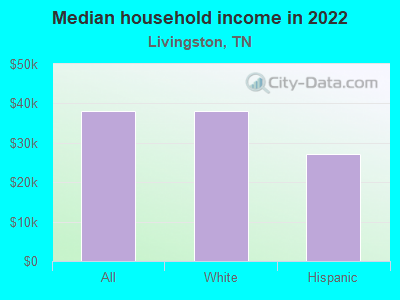
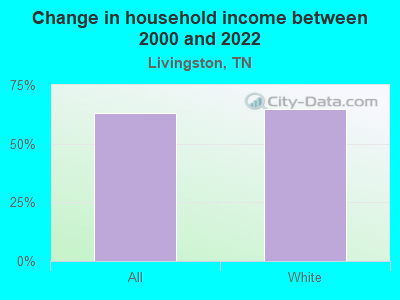
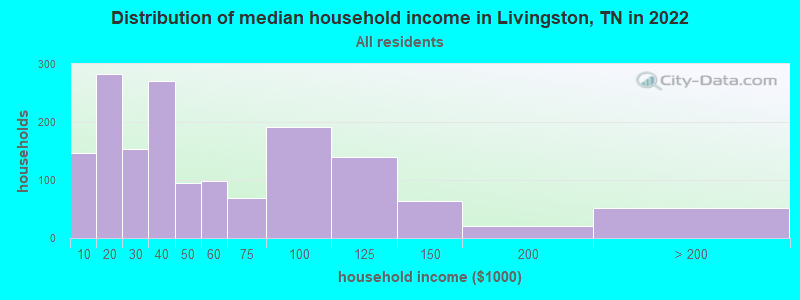
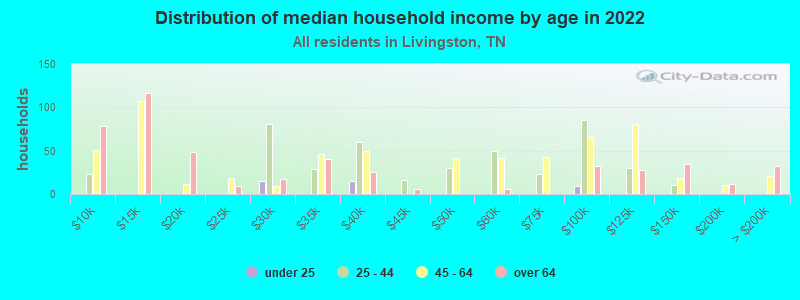
The median household income in Livingston, TN in 2022 was $38,056, which was 71.5% less than the median annual income of $65,254 across the entire state of Tennessee. Compared to the median income of $23,309 in 2000 this represents an increase of 38.8%. The per capita income in 2022 was $30,856, which means an increase of 49.6% compared to 2000 when it was $15,558.
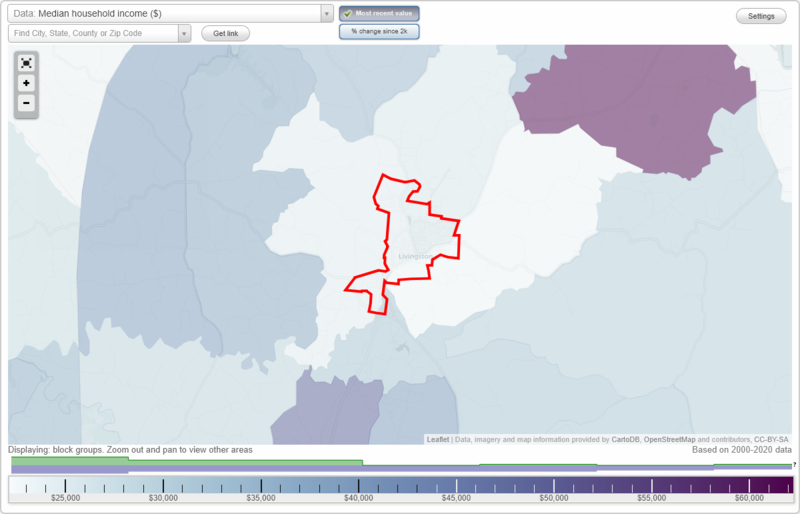
Whole page based on the data from 2000 / 2022 when the population of Livingston, Tennessee was 3,498 / 3,993
Income statistics for all residents
Median household income in Livingston, TN in 2022:
Livingston:
$38,057
State:
$65,254
Change in median household income between 2000 and 2022:
Livingston, Tennessee:
+63.3%
Tennessee:
+79.5%
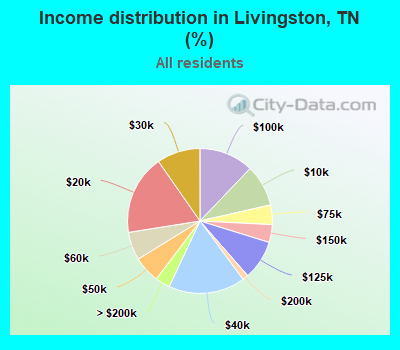
Number of households with income < $10k:
Livingston:
9.3% (147)
Tennessee:
5.4% (154,793)
Number of households with income $10k - 20k:
Livingston:
17.8% (282)
State:
8.0% (228,599)
Number of households with income $20k - 30k:
Livingston:
9.7% (153)
State:
7.9% (224,908)
Number of households with income $30k - 40k:
Livingston:
17.1% (270)
State:
8.6% (244,297)
Number of households with income $40k - 50k:
Livingston:
5.9% (94)
State:
8.4% (238,949)
Number of households with income $50k - 60k:
Livingston:
6.3% (99)
State:
7.7% (218,438)
Number of households with income $60k - 75k:
Livingston:
4.4% (69)
State:
10.3% (294,172)
Number of households with income $75k - 100k:
Livingston:
12.1% (192)
State:
13.3% (377,310)
Number of households with income $100k - 125k:
Livingston:
8.8% (139)
State:
9.5% (269,124)
Number of households with income $125k - 150k:
Livingston:
4.0% (63)
Tennessee:
6.3% (178,328)
Number of households with income $150k - 200k:
Livingston:
1.3% (21)
State:
7.2% (204,030)
Number of households with income > $200k:
Livingston:
3.3% (52)
Tennessee:
7.5% (213,736)
Aggregate household income in Livingston in 2022: $115,600,566
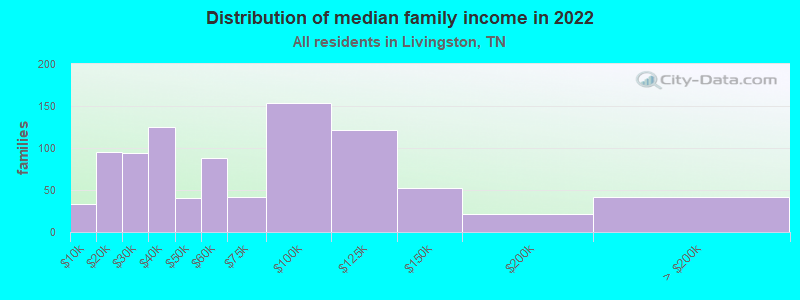
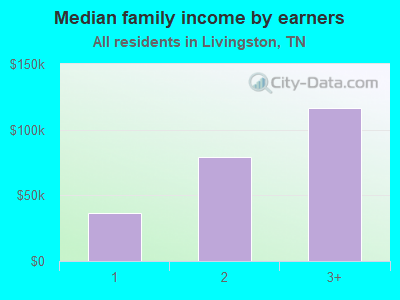
Median family income in Livingston in 2022:
Livingston:
$57,157
State:
$80,910
Number of families with income < $10k:
Livingston:
3.6% (33)
State:
3.9% (72,917)
Number of families with income $10k - 20k:
Livingston:
10.5% (95)
State:
4.0% (73,770)
Number of families with income $20k - 30k:
Livingston:
10.3% (94)
State:
5.6% (104,070)
Number of families with income $30k - 40k:
Livingston:
13.8% (125)
State:
7.2% (133,292)
Number of families with income $40k - 50k:
Livingston:
4.5% (41)
Tennessee:
7.4% (136,997)
Number of families with income $50k - 60k:
Livingston:
9.7% (88)
State:
7.1% (131,374)
Number of families with income $60k - 75k:
Livingston:
4.6% (42)
State:
10.8% (198,685)
Number of families with income $75k - 100k:
Livingston:
16.9% (153)
State:
15.1% (279,195)
Number of families with income $100k - 125k:
Livingston:
13.3% (121)
Tennessee:
11.7% (216,356)
Number of families with income $125k - 150k:
Livingston:
5.8% (52)
Tennessee:
7.8% (144,000)
Number of families with income $150k - 200k:
Livingston:
2.3% (21)
State:
9.3% (172,160)
Number of families with income > $200k:
Livingston:
4.6% (42)
State:
10.0% (183,756)
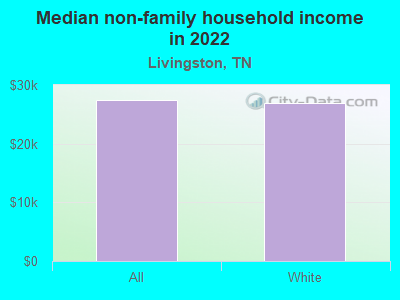
Median non-family income in Livingston in 2022:
Livingston:
$27,389
State:
$40,285
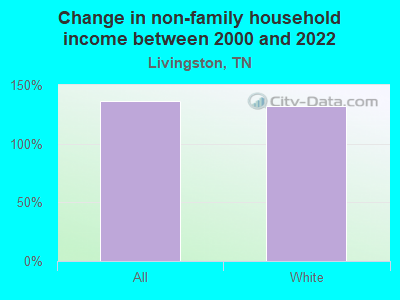
Change in median non-family income between 2000 and 2022:
Livingston, Tennessee:
+136.3%
Tennessee:
+91.5%
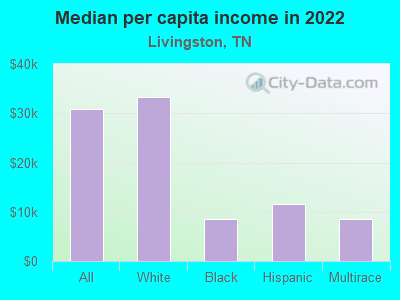
Median per capita income in Livingston in 2022:
Livingston:
$30,856
State:
$36,704
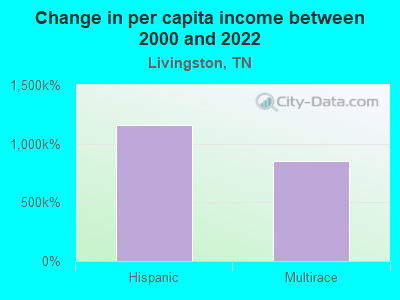
Change in median per capita income between 2000 and 2022:
Livingston, Tennessee:
+98.3%
Tennessee:
+89.3%
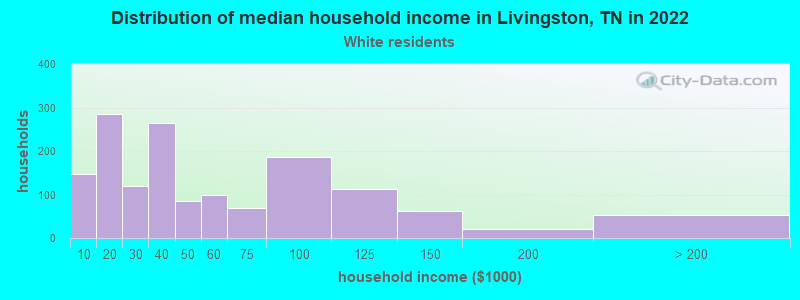
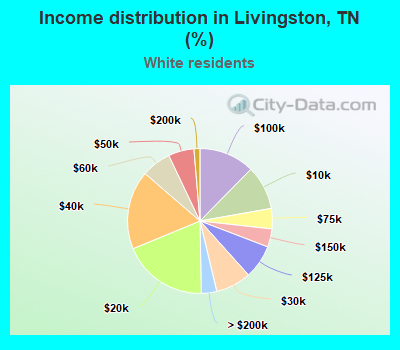
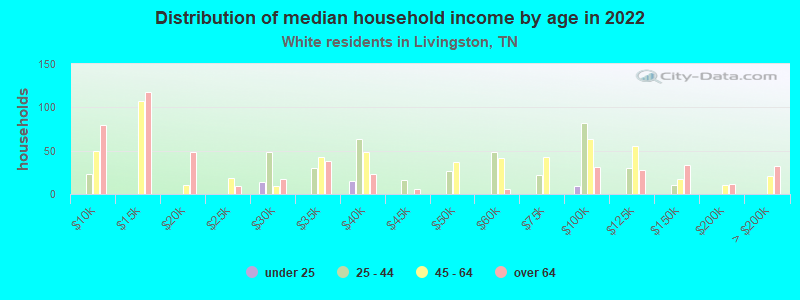
Income statistics for White residents
Median household income in Livingston, TN in 2022:
Livingston:
$38,186
Tennessee:
$69,826
Change in median household income between 2000 and 2022:
Livingston, Tennessee:
+64.8%
Tennessee:
+82.9%
Number of households with income < $10k:
Livingston:
9.9% (148)
Tennessee:
4.6% (100,279)
Number of households with income $10k - 20k:
Livingston:
19.0% (286)
State:
7.6% (165,031)
Number of households with income $20k - 30k:
Livingston:
7.9% (119)
State:
7.4% (160,229)
Number of households with income $30k - 40k:
Livingston:
17.6% (264)
Tennessee:
8.1% (174,784)
Number of households with income $40k - 50k:
Livingston:
5.7% (86)
Tennessee:
7.8% (169,622)
Number of households with income $50k - 60k:
Livingston:
6.6% (99)
State:
7.6% (165,508)
Number of households with income $60k - 75k:
Livingston:
4.5% (68)
Tennessee:
10.3% (223,937)
Number of households with income $75k - 100k:
Livingston:
12.4% (186)
State:
13.5% (292,688)
Number of households with income $100k - 125k:
Livingston:
7.5% (113)
State:
10.1% (219,251)
Number of households with income $125k - 150k:
Livingston:
4.1% (61)
State:
6.6% (142,574)
Number of households with income $150k - 200k:
Livingston:
1.3% (20)
State:
7.7% (166,039)
Number of households with income > $200k:
Livingston:
3.5% (52)
State:
8.5% (184,546)
Aggregate household income in Livingston in 2022: $109,937,062
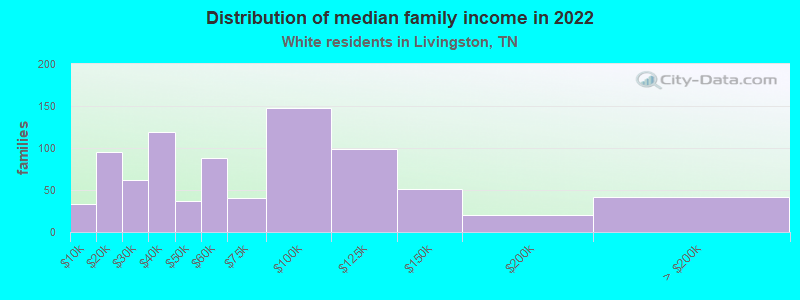
Median family income in Livingston in 2022:
Livingston:
$58,191
State:
$86,015
Number of families with income < $10k:
Livingston:
3.9% (33)
State:
3.1% (43,751)
Number of families with income $10k - 20k:
Livingston:
11.4% (95)
State:
3.5% (49,925)
Number of families with income $20k - 30k:
Livingston:
7.4% (62)
State:
5.0% (70,431)
Number of families with income $30k - 40k:
Livingston:
14.3% (119)
State:
6.6% (93,498)
Number of families with income $40k - 50k:
Livingston:
4.5% (37)
State:
6.8% (96,726)
Number of families with income $50k - 60k:
Livingston:
10.6% (88)
State:
7.2% (101,879)
Number of families with income $60k - 75k:
Livingston:
4.9% (41)
Tennessee:
10.7% (151,997)
Number of families with income $75k - 100k:
Livingston:
17.7% (148)
State:
15.4% (218,373)
Number of families with income $100k - 125k:
Livingston:
11.8% (99)
Tennessee:
12.6% (178,761)
Number of families with income $125k - 150k:
Livingston:
6.1% (51)
State:
8.2% (116,575)
Number of families with income $150k - 200k:
Livingston:
2.4% (20)
State:
9.9% (141,123)
Number of families with income > $200k:
Livingston:
5.0% (42)
State:
11.2% (159,431)
Median non-family income in Livingston in 2022:
Livingston:
$26,932
Tennessee:
$41,178
Change in median non-family income between 2000 and 2022:
Livingston, Tennessee:
+132.4%
Tennessee:
+91.1%
Median per capita income in Livingston in 2022:
Livingston:
$33,235
State:
$40,126
Change in median per capita income between 2000 and 2022:
Livingston, Tennessee:
+111.8%
State:
+92.6%
Income statistics for Black or African American residents
Median per capita income in Livingston in 2022:
Livingston:
$8,503
Tennessee:
$27,306
Change in median per capita income between 2000 and 2022:: -19.0%
Livingston, Tennessee:
-19.0%
State:
+105.3%
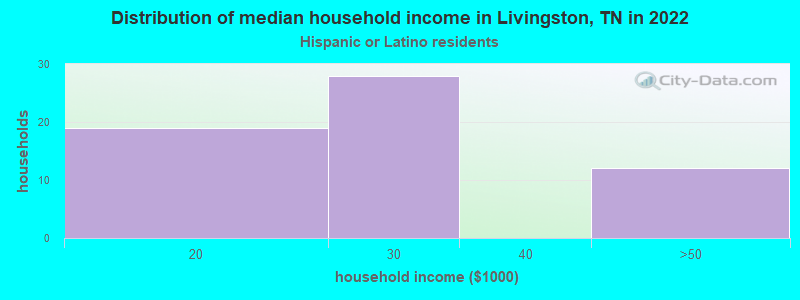
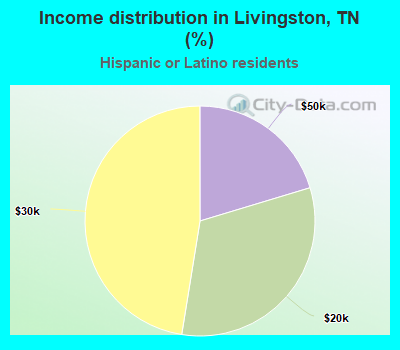
Income statistics for Hispanic or Latino residents
Median household income in Livingston, TN in 2022:
Livingston:
$27,155
State:
$58,385
Number of households with income < $10k:
Livingston:
0.0% (0)
State:
7.2% (8,567)
Number of households with income $10k - 20k:
Livingston:
32.2% (19)
Tennessee:
6.4% (7,670)
Number of households with income $20k - 30k:
Livingston:
47.5% (28)
Tennessee:
9.4% (11,247)
Number of households with income $30k - 40k:
Livingston:
0.0% (0)
State:
10.1% (12,072)
Number of households with income $40k - 50k:
Livingston:
20.3% (12)
State:
10.0% (11,947)
Number of households with income $50k - 60k:
Livingston:
0.0% (0)
State:
8.0% (9,569)
Number of households with income $60k - 75k:
Livingston:
0.0% (0)
State:
10.3% (12,315)
Number of households with income $75k - 100k:
Livingston:
0.0% (0)
State:
15.3% (18,285)
Number of households with income $100k - 125k:
Livingston:
0.0% (0)
State:
8.3% (9,886)
Number of households with income $125k - 150k:
Livingston:
0.0% (0)
Tennessee:
5.9% (7,066)
Number of households with income $150k - 200k:
Livingston:
0.0% (0)
State:
4.9% (5,822)
Number of households with income > $200k:
Livingston:
0.0% (0)
State:
4.5% (5,337)
Aggregate household income in Livingston in 2022: $1,783,593
Median per capita income in Livingston in 2022:
Livingston:
$11,609
State:
$21,276
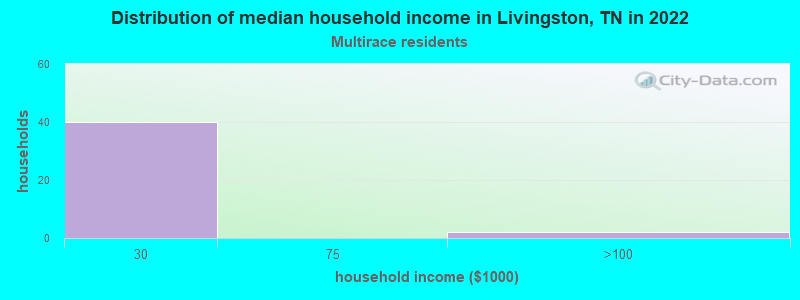
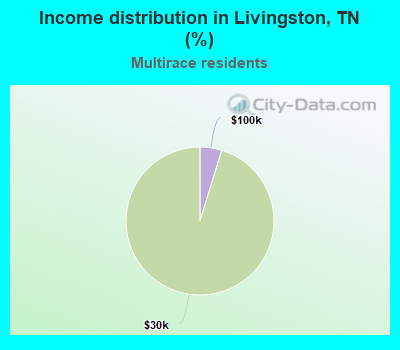
Income statistics for Multirace residents
Number of households with income < $10k:
Livingston:
0.0% (0)
State:
6.7% (9,867)
Number of households with income $10k - 20k:
Livingston:
0.0% (0)
Tennessee:
8.6% (12,639)
Number of households with income $20k - 30k:
Livingston:
95.2% (40)
Tennessee:
9.2% (13,555)
Number of households with income $30k - 40k:
Livingston:
0.0% (0)
Tennessee:
10.3% (15,117)
Number of households with income $40k - 50k:
Livingston:
0.0% (0)
State:
9.4% (13,829)
Number of households with income $50k - 60k:
Livingston:
0.0% (0)
Tennessee:
7.5% (10,969)
Number of households with income $60k - 75k:
Livingston:
0.0% (0)
Tennessee:
9.2% (13,568)
Number of households with income $75k - 100k:
Livingston:
4.8% (2)
State:
12.6% (18,516)
Number of households with income $100k - 125k:
Livingston:
0.0% (0)
State:
8.6% (12,656)
Number of households with income $125k - 150k:
Livingston:
0.0% (0)
State:
5.9% (8,674)
Number of households with income $150k - 200k:
Livingston:
0.0% (0)
State:
7.2% (10,611)
Number of households with income > $200k:
Livingston:
0.0% (0)
Tennessee:
4.8% (6,986)
Median per capita income in Livingston in 2022:
Livingston:
$8,518
State:
$24,436
Discuss Livingston, Tennessee (TN) on our hugely popular Tennessee forum.