Lumberland, New York (NY) income map, earnings map, and wages data
The median household income in Lumberland, NY in 2022 was $73,476, which was 8.3% less than the median annual income of $79,557 across the entire state of New York. Compared to the median income of $42,625 in 2000 this represents an increase of 42.0%. The per capita income in 2022 was $45,249, which means an increase of 56.5% compared to 2000 when it was $19,665.
Income statistics for all residents
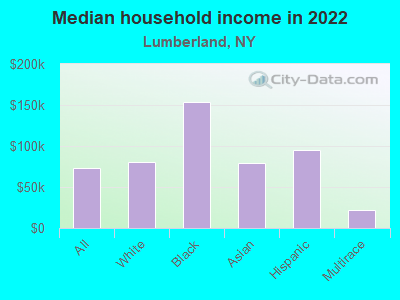
Median household income in Lumberland, NY in 2022:| Lumberland: | $73,477 |
| New York: | $79,557 |
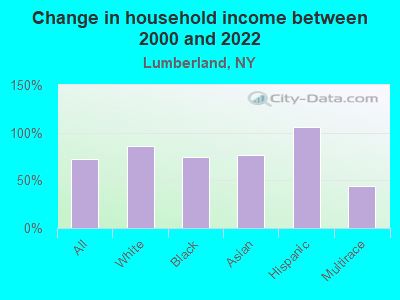
Change in median household income between 2000 and 2022:| Lumberland, New York: | +72.4% |
| New York: | +83.3% |
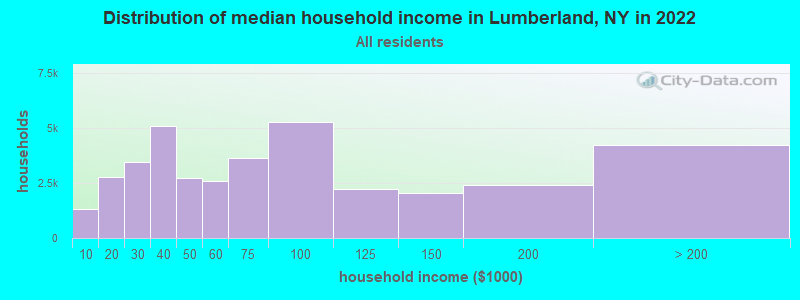
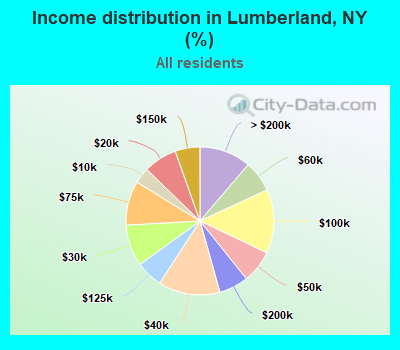
Number of households with income < $10k:| Lumberland: | 3.5% (1,312) |
| New York: | 6.8% (527,598) |
Number of households with income $10k - 20k:| Lumberland: | 7.3% (2,756) |
| State: | 7.4% (574,940) |
Number of households with income $20k - 30k:| Lumberland: | 9.1% (3,439) |
| State: | 6.7% (517,718) |
Number of households with income $30k - 40k:| Lumberland: | 13.5% (5,092) |
| State: | 6.5% (506,674) |
Number of households with income $40k - 50k:| Lumberland: | 7.2% (2,705) |
| New York: | 6.1% (470,439) |
Number of households with income $50k - 60k:| Lumberland: | 6.9% (2,586) |
| New York: | 5.8% (454,042) |
Number of households with income $60k - 75k:| Lumberland: | 9.7% (3,651) |
| New York: | 8.5% (657,508) |
Number of households with income $75k - 100k:| Lumberland: | 14.0% (5,271) |
| New York: | 11.6% (899,824) |
Number of households with income $100k - 125k:| Lumberland: | 5.9% (2,211) |
| State: | 9.3% (723,825) |
Number of households with income $125k - 150k:| Lumberland: | 5.4% (2,043) |
| State: | 7.1% (552,420) |
Number of households with income $150k - 200k:| Lumberland: | 6.4% (2,426) |
| State: | 9.4% (727,051) |
Number of households with income > $200k:| Lumberland: | 11.3% (4,248) |
| State: | 15.0% (1,162,269) |
Aggregate household income in Lumberland in 2022: $94,025,802
Median family income in Lumberland in 2022:| Lumberland: | $89,816 |
| State: | $99,066 |
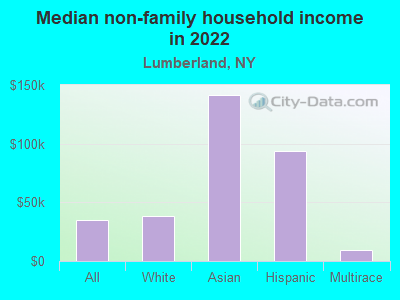
Median non-family income in Lumberland in 2022:| Lumberland: | $35,129 |
| State: | $50,181 |
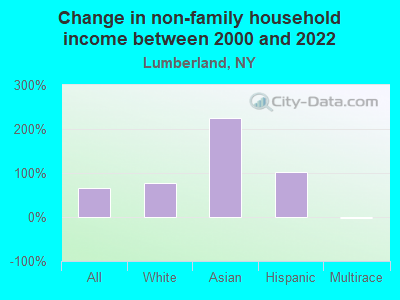
Change in median non-family income between 2000 and 2022:| Lumberland, New York: | +66.4% |
| State: | +85.4% |
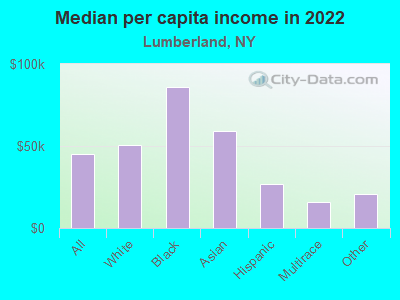
Median per capita income in Lumberland in 2022:| Lumberland: | $45,250 |
| State: | $47,421 |
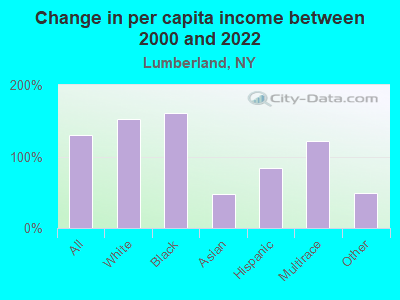
Change in median per capita income between 2000 and 2022:| Lumberland, New York: | +130.1% |
| State: | +102.7% |
Income statistics for White residents
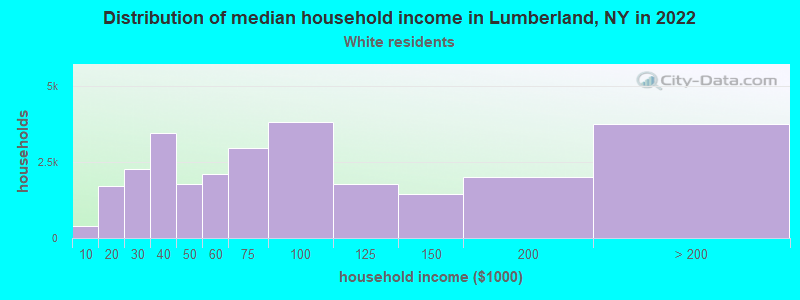
Median household income in Lumberland, NY in 2022:| Lumberland: | $79,925 |
| State: | $89,408 |
Change in median household income between 2000 and 2022:| Lumberland, New York: | +86.1% |
| State: | +85.5% |
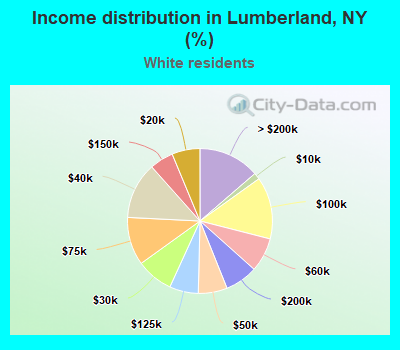
Number of households with income < $10k:| Lumberland: | 1.5% (401) |
| State: | 4.8% (225,550) |
Number of households with income $10k - 20k:| Lumberland: | 6.3% (1,726) |
| State: | 6.1% (289,425) |
Number of households with income $20k - 30k:| Lumberland: | 8.2% (2,270) |
| State: | 5.9% (280,254) |
Number of households with income $30k - 40k:| Lumberland: | 12.6% (3,473) |
| State: | 6.1% (288,263) |
Number of households with income $40k - 50k:| Lumberland: | 6.5% (1,777) |
| State: | 5.9% (278,079) |
Number of households with income $50k - 60k:| Lumberland: | 7.6% (2,099) |
| State: | 5.7% (267,554) |
Number of households with income $60k - 75k:| Lumberland: | 10.7% (2,956) |
| State: | 8.4% (398,344) |
Number of households with income $75k - 100k:| Lumberland: | 13.9% (3,822) |
| State: | 11.8% (554,841) |
Number of households with income $100k - 125k:| Lumberland: | 6.4% (1,775) |
| State: | 10.0% (469,794) |
Number of households with income $125k - 150k:| Lumberland: | 5.3% (1,464) |
| New York: | 7.6% (360,467) |
Number of households with income $150k - 200k:| Lumberland: | 7.3% (2,014) |
| State: | 10.1% (477,078) |
Number of households with income > $200k:| Lumberland: | 13.7% (3,762) |
| State: | 17.6% (829,233) |
Aggregate household income in Lumberland in 2022: $84,479,251
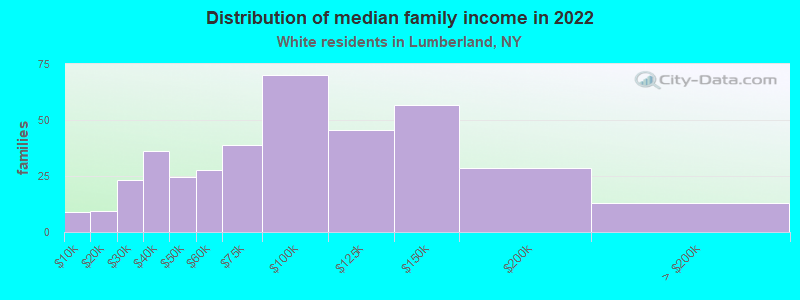
Median family income in Lumberland in 2022:| Lumberland: | $95,838 |
| New York: | $115,170 |
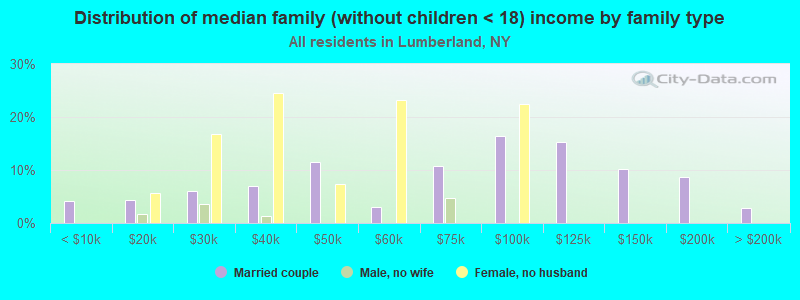
Number of families with income < $10k:| Lumberland: | 2.3% (9) |
| New York: | 2.5% (68,851) |
Number of families with income $10k - 20k:| Lumberland: | 2.4% (9) |
| State: | 3.0% (83,127) |
Number of families with income $20k - 30k:| Lumberland: | 6.0% (23) |
| New York: | 3.5% (97,578) |
Number of families with income $30k - 40k:| Lumberland: | 9.4% (36) |
| State: | 4.1% (114,108) |
Number of families with income $40k - 50k:| Lumberland: | 6.4% (24) |
| State: | 4.7% (130,902) |
Number of families with income $50k - 60k:| Lumberland: | 7.2% (28) |
| New York: | 4.9% (135,118) |
Number of families with income $60k - 75k:| Lumberland: | 10.2% (39) |
| State: | 7.8% (216,254) |
Number of families with income $75k - 100k:| Lumberland: | 18.4% (70) |
| State: | 12.4% (342,382) |
Number of families with income $100k - 125k:| Lumberland: | 11.9% (46) |
| State: | 11.4% (314,917) |
Number of families with income $125k - 150k:| Lumberland: | 14.8% (57) |
| State: | 9.4% (260,489) |
Number of families with income $150k - 200k:| Lumberland: | 7.5% (29) |
| New York: | 13.2% (365,586) |
Number of families with income > $200k:| Lumberland: | 3.4% (13) |
| State: | 23.2% (642,319) |
Median non-family income in Lumberland in 2022:| Lumberland: | $38,649 |
| New York: | $54,783 |
Change in median non-family income between 2000 and 2022:| Lumberland, New York: | +78.4% |
| State: | +87.9% |
Median per capita income in Lumberland in 2022:| Lumberland: | $50,312 |
| New York: | $57,640 |
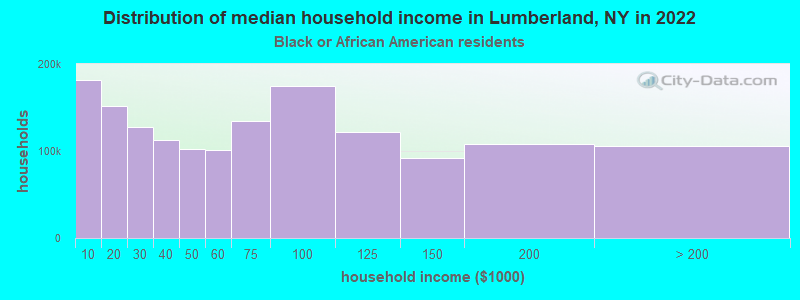
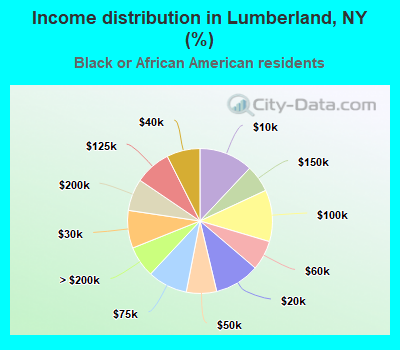
Income statistics for Black or African American residents
Median household income in Lumberland, NY in 2022:| Lumberland: | $154,060 |
| State: | $57,898 |
Change in median household income between 2000 and 2022:| Lumberland, New York: | +73.6% |
| New York: | +84.6% |
Number of households with income < $10k:| Lumberland: | 12.0% (181,951) |
| State: | 12.0% (128,500) |
Number of households with income $10k - 20k:| Lumberland: | 10.0% (152,122) |
| New York: | 10.0% (107,541) |
Number of households with income $20k - 30k:| Lumberland: | 8.4% (127,671) |
| State: | 8.4% (90,192) |
Number of households with income $30k - 40k:| Lumberland: | 7.4% (112,522) |
| State: | 7.4% (79,579) |
Number of households with income $40k - 50k:| Lumberland: | 6.8% (102,600) |
| State: | 6.8% (72,491) |
Number of households with income $50k - 60k:| Lumberland: | 6.6% (100,627) |
| State: | 6.7% (71,309) |
Number of households with income $60k - 75k:| Lumberland: | 8.9% (134,528) |
| State: | 8.9% (95,050) |
Number of households with income $75k - 100k:| Lumberland: | 11.5% (174,548) |
| State: | 11.5% (123,569) |
Number of households with income $100k - 125k:| Lumberland: | 8.1% (122,195) |
| State: | 8.1% (86,632) |
Number of households with income $125k - 150k:| Lumberland: | 6.1% (91,676) |
| New York: | 6.0% (64,788) |
Number of households with income $150k - 200k:| Lumberland: | 7.1% (108,176) |
| New York: | 7.2% (76,644) |
Number of households with income > $200k:| Lumberland: | 7.0% (105,639) |
| New York: | 7.0% (75,062) |
Aggregate household income in Lumberland in 2022: $571,234
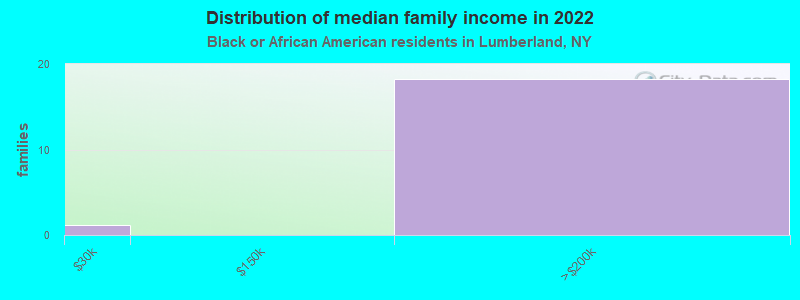
Median family income in Lumberland in 2022:| Lumberland: | $175,858 |
| State: | $72,528 |
Number of families with income $20k - 30k:| Lumberland: | 6.2% (1) |
| State: | 7.0% (44,139) |
Number of families with income $150k - 200k:| Lumberland: | 93.8% (18) |
| State: | 9.4% (59,260) |
Median per capita income in Lumberland in 2022:| Lumberland: | $86,020 |
| State: | $31,947 |
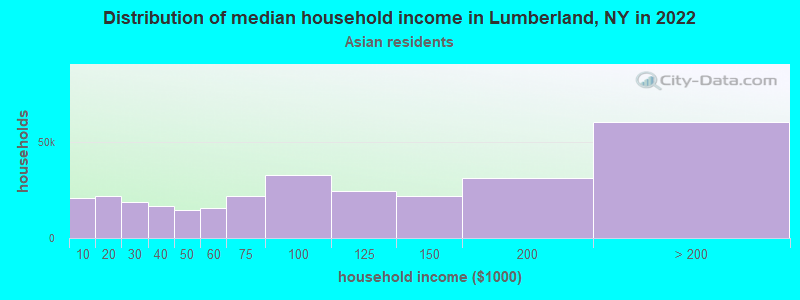
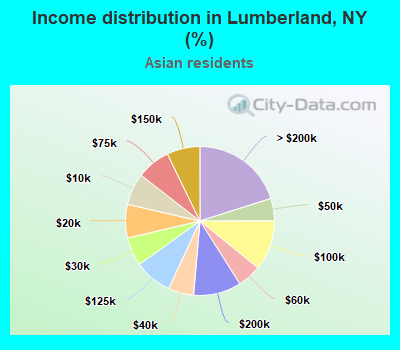
Income statistics for Asian residents
Median household income in Lumberland, NY in 2022:| Lumberland: | $79,038 |
| New York: | $89,947 |
Change in median household income between 2000 and 2022:| Lumberland, New York: | +77.3% |
| State: | +98.1% |
Number of households with income < $10k:| Lumberland: | 6.9% (20,882) |
| New York: | 6.9% (42,537) |
Number of households with income $10k - 20k:| Lumberland: | 7.3% (21,971) |
| State: | 7.3% (44,745) |
Number of households with income $20k - 30k:| Lumberland: | 6.2% (18,813) |
| New York: | 6.2% (38,249) |
Number of households with income $30k - 40k:| Lumberland: | 5.5% (16,689) |
| State: | 5.5% (33,993) |
Number of households with income $40k - 50k:| Lumberland: | 4.9% (14,648) |
| State: | 4.8% (29,795) |
Number of households with income $50k - 60k:| Lumberland: | 5.2% (15,668) |
| New York: | 5.2% (32,100) |
Number of households with income $60k - 75k:| Lumberland: | 7.3% (21,891) |
| State: | 7.3% (44,615) |
Number of households with income $75k - 100k:| Lumberland: | 10.9% (32,733) |
| State: | 10.8% (66,687) |
Number of households with income $100k - 125k:| Lumberland: | 8.2% (24,593) |
| State: | 8.2% (50,233) |
Number of households with income $125k - 150k:| Lumberland: | 7.2% (21,731) |
| State: | 7.2% (44,299) |
Number of households with income $150k - 200k:| Lumberland: | 10.4% (31,265) |
| State: | 10.4% (63,837) |
Number of households with income > $200k:| Lumberland: | 20.1% (60,674) |
| State: | 20.1% (123,891) |
Aggregate household income in Lumberland in 2022: $846,900
Median family income in Lumberland in 2022:| Lumberland: | $71,932 |
| New York: | $98,136 |
Median non-family income in Lumberland in 2022:| Lumberland: | $141,608 |
| New York: | $63,573 |
Median per capita income in Lumberland in 2022:| Lumberland: | $59,307 |
| State: | $46,726 |
Change in median per capita income between 2000 and 2022:| Lumberland, New York: | +47.7% |
| New York: | +126.6% |
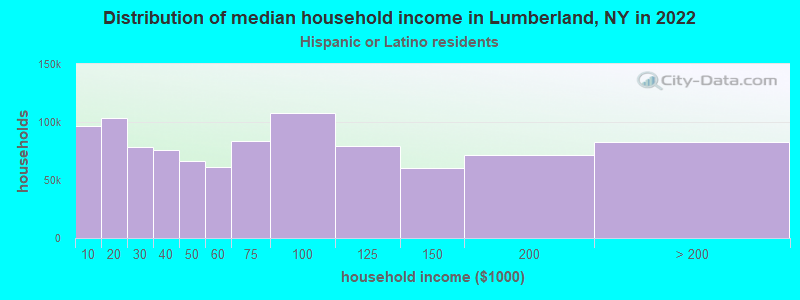
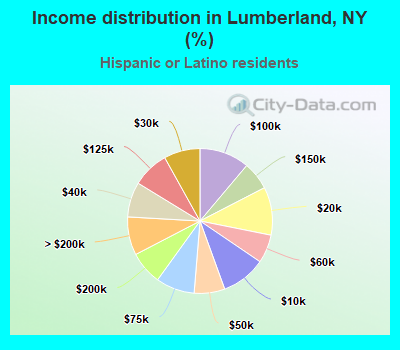
Income statistics for Hispanic or Latino residents
Median household income in Lumberland, NY in 2022:| Lumberland: | $95,047 |
| New York: | $60,468 |
Change in median household income between 2000 and 2022:| Lumberland, New York: | +105.5% |
| State: | +98.3% |
Number of households with income < $10k:| Lumberland: | 10.0% (96,372) |
| State: | 9.9% (127,185) |
Number of households with income $10k - 20k:| Lumberland: | 10.7% (103,740) |
| State: | 10.7% (136,699) |
Number of households with income $20k - 30k:| Lumberland: | 8.1% (78,117) |
| New York: | 8.1% (102,991) |
Number of households with income $30k - 40k:| Lumberland: | 7.8% (75,665) |
| State: | 7.8% (100,149) |
Number of households with income $40k - 50k:| Lumberland: | 6.8% (66,201) |
| New York: | 6.9% (87,760) |
Number of households with income $50k - 60k:| Lumberland: | 6.3% (61,303) |
| New York: | 6.3% (80,968) |
Number of households with income $60k - 75k:| Lumberland: | 8.6% (83,557) |
| New York: | 8.7% (110,631) |
Number of households with income $75k - 100k:| Lumberland: | 11.2% (107,854) |
| New York: | 11.2% (142,787) |
Number of households with income $100k - 125k:| Lumberland: | 8.2% (79,033) |
| State: | 8.2% (104,850) |
Number of households with income $125k - 150k:| Lumberland: | 6.3% (60,640) |
| State: | 6.3% (80,274) |
Number of households with income $150k - 200k:| Lumberland: | 7.4% (71,686) |
| New York: | 7.4% (95,117) |
Number of households with income > $200k:| Lumberland: | 8.6% (82,674) |
| State: | 8.6% (109,514) |
Aggregate household income in Lumberland in 2022: $5,838,521
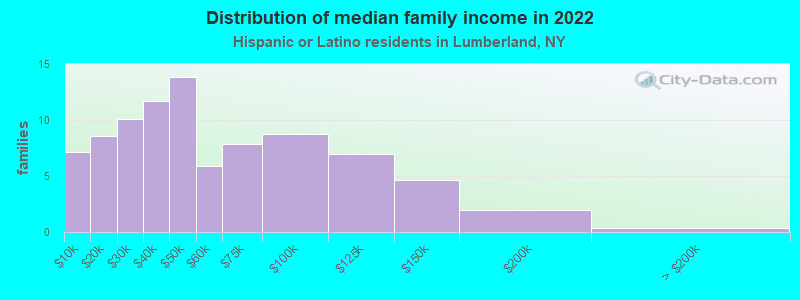
Median family income in Lumberland in 2022:| Lumberland: | $114,245 |
| State: | $68,770 |
Number of families with income < $10k:| Lumberland: | 8.2% (7) |
| State: | 6.9% (58,565) |
Number of families with income $10k - 20k:| Lumberland: | 9.7% (9) |
| New York: | 7.0% (59,058) |
Number of families with income $20k - 30k:| Lumberland: | 11.5% (10) |
| State: | 8.0% (68,048) |
Number of families with income $30k - 40k:| Lumberland: | 13.3% (12) |
| New York: | 8.4% (70,668) |
Number of families with income $40k - 50k:| Lumberland: | 15.8% (14) |
| State: | 7.4% (62,941) |
Number of families with income $50k - 60k:| Lumberland: | 6.7% (6) |
| State: | 6.6% (55,592) |
Number of families with income $60k - 75k:| Lumberland: | 9.0% (8) |
| State: | 9.3% (78,564) |
Number of families with income $75k - 100k:| Lumberland: | 10.0% (9) |
| New York: | 12.6% (106,685) |
Number of families with income $100k - 125k:| Lumberland: | 8.0% (7) |
| State: | 9.4% (79,139) |
Number of families with income $125k - 150k:| Lumberland: | 5.3% (5) |
| New York: | 6.9% (58,255) |
Number of families with income $150k - 200k:| Lumberland: | 2.2% (2) |
| New York: | 8.3% (69,877) |
Number of families with income > $200k:| Lumberland: | 0.4% (0) |
| State: | 9.3% (78,555) |
Median non-family income in Lumberland in 2022:| Lumberland: | $93,880 |
| State: | $34,000 |
Change in median non-family income between 2000 and 2022:| Lumberland, New York: | +103.0% |
| State: | +93.9% |
Median per capita income in Lumberland in 2022:| Lumberland: | $26,973 |
| State: | $29,761 |
Change in median per capita income between 2000 and 2022:| Lumberland, New York: | +84.1% |
| New York: | +132.7% |
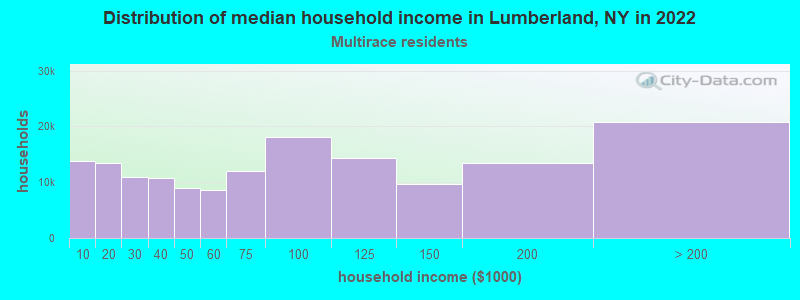
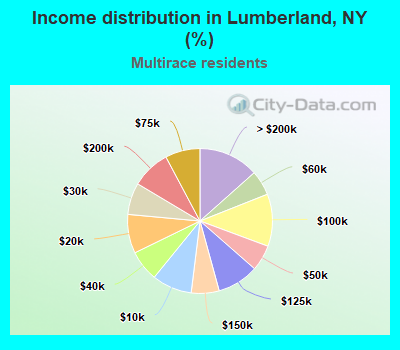
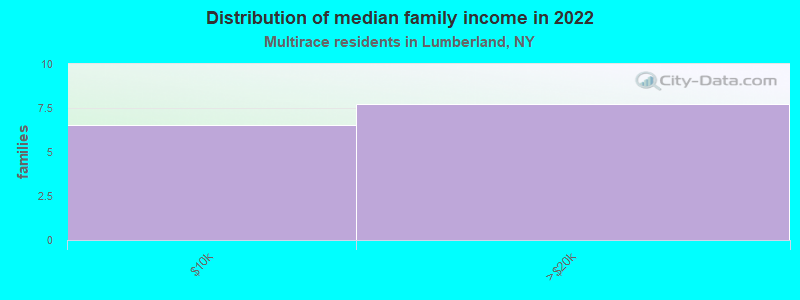
Income statistics for Multirace residents
Median household income in Lumberland, NY in 2022:| Lumberland: | $22,455 |
| State: | $73,557 |
Change in median household income between 2000 and 2022:| Lumberland, New York: | +43.7% |
| State: | +123.9% |
Number of households with income < $10k:| Lumberland: | 8.9% (13,792) |
| New York: | 8.9% (57,924) |
Number of households with income $10k - 20k:| Lumberland: | 8.7% (13,451) |
| State: | 8.7% (56,590) |
Number of households with income $20k - 30k:| Lumberland: | 7.1% (10,995) |
| State: | 7.1% (46,287) |
Number of households with income $30k - 40k:| Lumberland: | 6.9% (10,709) |
| State: | 6.9% (45,132) |
Number of households with income $40k - 50k:| Lumberland: | 5.8% (8,987) |
| State: | 5.8% (37,946) |
Number of households with income $50k - 60k:| Lumberland: | 5.6% (8,634) |
| New York: | 5.6% (36,410) |
Number of households with income $60k - 75k:| Lumberland: | 7.8% (12,044) |
| State: | 7.8% (50,819) |
Number of households with income $75k - 100k:| Lumberland: | 11.7% (18,048) |
| State: | 11.7% (76,024) |
Number of households with income $100k - 125k:| Lumberland: | 9.3% (14,362) |
| State: | 9.3% (60,635) |
Number of households with income $125k - 150k:| Lumberland: | 6.2% (9,623) |
| New York: | 6.2% (40,533) |
Number of households with income $150k - 200k:| Lumberland: | 8.6% (13,386) |
| State: | 8.6% (56,409) |
Number of households with income > $200k:| Lumberland: | 13.4% (20,782) |
| State: | 13.4% (87,442) |
Aggregate household income in Lumberland in 2022: $1,737,887
Median family income in Lumberland in 2022:| Lumberland: | $21,765 |
| State: | $85,788 |
Number of families with income < $10k:| Lumberland: | 45.7% (7) |
| State: | 6.2% (24,976) |
Number of families with income $10k - 20k:| Lumberland: | 54.3% (8) |
| State: | 5.6% (22,512) |
Median non-family income in Lumberland in 2022:| Lumberland: | $9,662 |
| New York: | $46,403 |
Median per capita income in Lumberland in 2022:| Lumberland: | $15,944 |
| State: | $36,931 |
Change in median per capita income between 2000 and 2022:| Lumberland, New York: | +120.9% |
| State: | +158.8% |
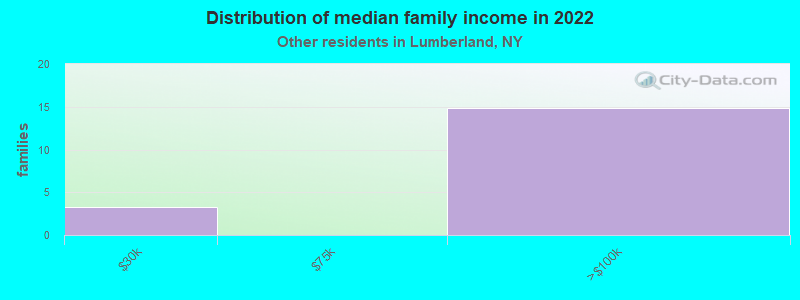
Income statistics for other residents
Number of households with income < $10k:| Lumberland: | 10.9% (7) |
| State: | 10.3% (69,252) |
Number of households with income $10k - 20k:| Lumberland: | 9.4% (6) |
| State: | 11.0% (73,890) |
Number of households with income $20k - 30k:| Lumberland: | 6.2% (4) |
| State: | 8.8% (59,096) |
Number of households with income $30k - 40k:| Lumberland: | 7.8% (5) |
| New York: | 8.1% (54,418) |
Number of households with income $40k - 50k:| Lumberland: | 7.8% (5) |
| New York: | 7.3% (49,042) |
Number of households with income $50k - 60k:| Lumberland: | 6.2% (4) |
| State: | 6.5% (43,945) |
Number of households with income $60k - 75k:| Lumberland: | 9.4% (6) |
| State: | 9.5% (64,087) |
Number of households with income $75k - 100k:| Lumberland: | 10.9% (7) |
| New York: | 10.9% (73,094) |
Number of households with income $100k - 125k:| Lumberland: | 9.4% (6) |
| State: | 7.9% (53,055) |
Number of households with income $125k - 150k:| Lumberland: | 4.7% (3) |
| State: | 5.9% (39,446) |
Number of households with income $150k - 200k:| Lumberland: | 9.4% (6) |
| State: | 7.2% (48,653) |
Number of households with income > $200k:| Lumberland: | 7.8% (5) |
| New York: | 6.6% (44,703) |
Aggregate household income in Lumberland in 2022: $1,671,633
Median family income in Lumberland in 2022:| Lumberland: | $108,433 |
| State: | $63,465 |
Number of families with income $20k - 30k:| Lumberland: | 17.9% (3) |
| State: | 9.2% (43,198) |
Number of families with income $75k - 100k:| Lumberland: | 82.1% (15) |
| State: | 12.5% (58,659) |
Median per capita income in Lumberland in 2022:| Lumberland: | $20,931 |
| State: | $26,975 |
Change in median per capita income between 2000 and 2022:| Lumberland, New York: | +49.4% |
| State: | +144.6% |