Magnolia, Delaware (DE) income map, earnings map, and wages data
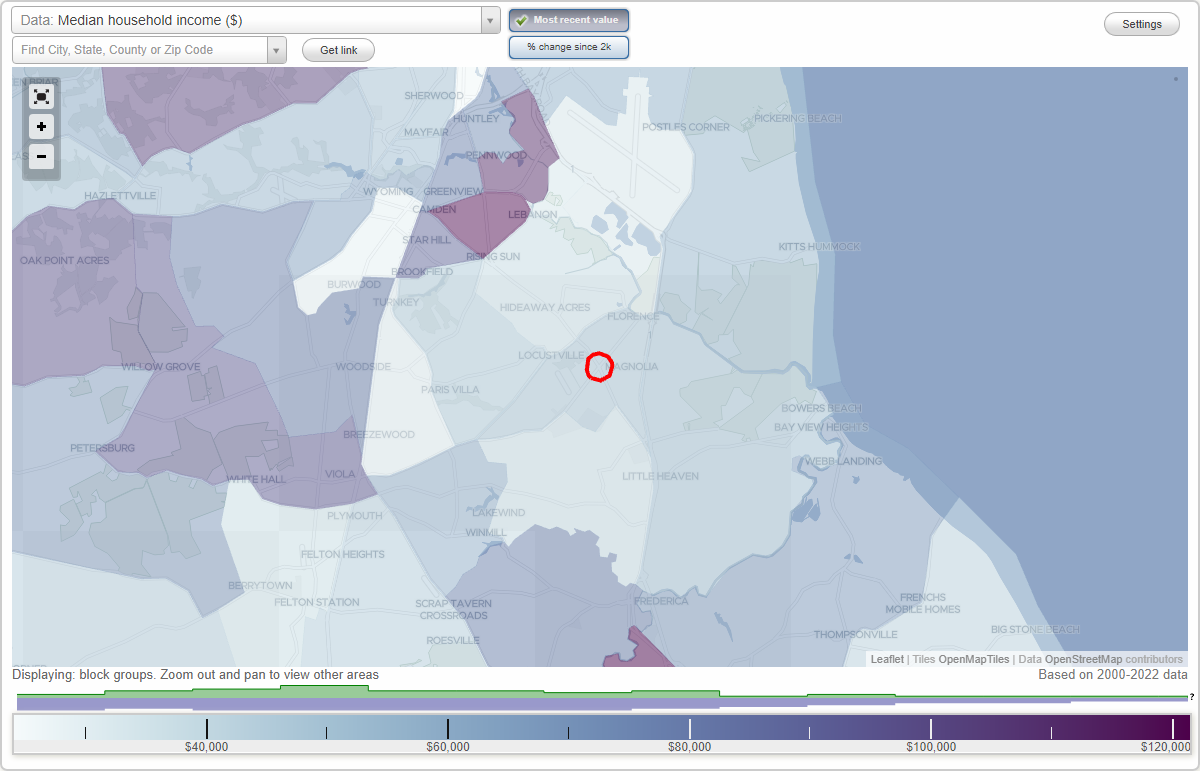
Data:
The per capita income in 2022 was $25,631, which means an increase of 33.7% compared to 2000 when it was $17,001.
Whole page based on the data from 2000 / 2022 when the population of Magnolia, Delaware was 226 / 270
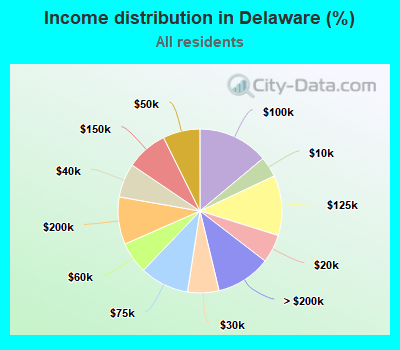
Income statistics for all residents
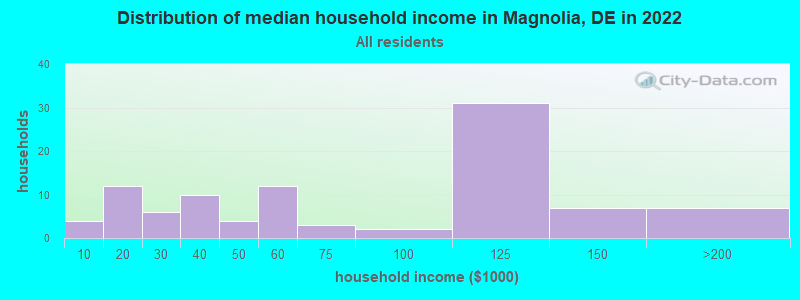
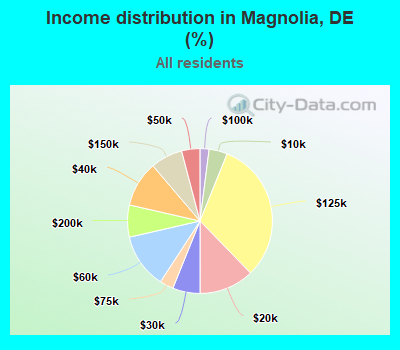
Number of households with income < $10k:| Magnolia: | 4.1% (4) |
| State: | 4.0% (16,288) |
Number of households with income $10k - 20k:| Magnolia: | 12.2% (12) |
| Delaware: | 5.6% (22,545) |
Number of households with income $20k - 30k:| Magnolia: | 6.1% (6) |
| State: | 6.2% (24,941) |
Number of households with income $30k - 40k:| Magnolia: | 10.2% (10) |
| State: | 6.7% (27,051) |
Number of households with income $40k - 50k:| Magnolia: | 4.1% (4) |
| State: | 7.3% (29,468) |
Number of households with income $50k - 60k:| Magnolia: | 12.2% (12) |
| Delaware: | 6.3% (25,207) |
Number of households with income $60k - 75k:| Magnolia: | 3.1% (3) |
| State: | 9.7% (38,914) |
Number of households with income $75k - 100k:| Magnolia: | 2.0% (2) |
| State: | 13.9% (56,111) |
Number of households with income $100k - 125k:| Magnolia: | 31.6% (31) |
| Delaware: | 11.8% (47,641) |
Number of households with income $125k - 150k:| Magnolia: | 7.1% (7) |
| State: | 8.2% (32,964) |
Number of households with income $150k - 200k:| Magnolia: | 7.1% (7) |
| Delaware: | 9.4% (37,675) |
Number of households with income > $200k:| Magnolia: | 0.0% (0) |
| State: | 10.8% (43,529) |
Aggregate household income in Magnolia in 2022: $7,748,716
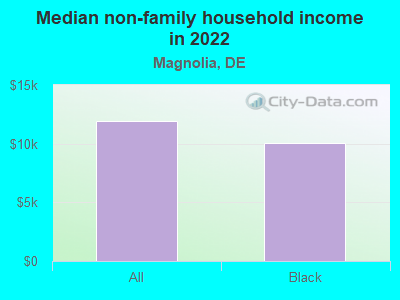
Median non-family income in Magnolia in 2022:| Magnolia: | $11,947 |
| State: | $46,579 |
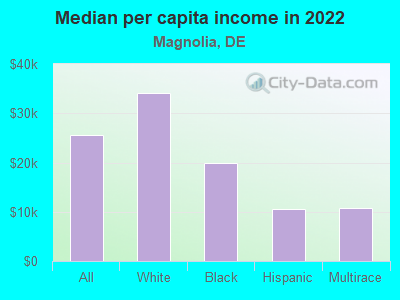
Median per capita income in Magnolia in 2022:| Magnolia: | $25,632 |
| State: | $42,571 |
Change in median per capita income between 2000 and 2022:| Magnolia, Delaware: | +50.8% |
| State: | +82.7% |
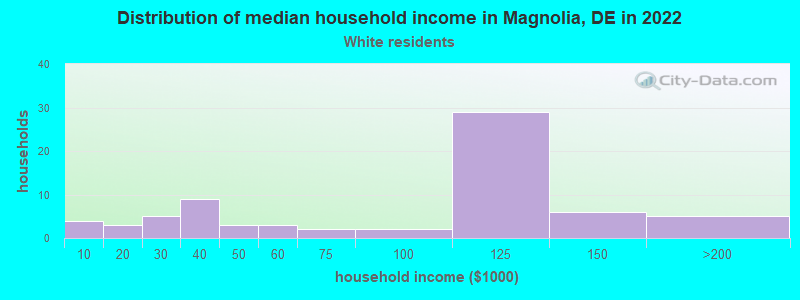
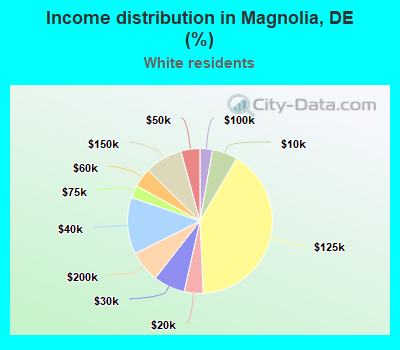
Income statistics for White residents
Median household income in Magnolia, DE in 2022:| Magnolia: | $117,632 |
| State: | $89,351 |
Number of households with income < $10k:| Magnolia: | 5.6% (4) |
| Delaware: | 3.4% (9,074) |
Number of households with income $10k - 20k:| Magnolia: | 4.2% (3) |
| Delaware: | 4.1% (10,674) |
Number of households with income $20k - 30k:| Magnolia: | 7.0% (5) |
| Delaware: | 5.5% (14,529) |
Number of households with income $30k - 40k:| Magnolia: | 12.7% (9) |
| Delaware: | 5.9% (15,596) |
Number of households with income $40k - 50k:| Magnolia: | 4.2% (3) |
| Delaware: | 6.5% (17,134) |
Number of households with income $50k - 60k:| Magnolia: | 4.2% (3) |
| State: | 6.2% (16,208) |
Number of households with income $60k - 75k:| Magnolia: | 2.8% (2) |
| State: | 9.9% (26,007) |
Number of households with income $75k - 100k:| Magnolia: | 2.8% (2) |
| Delaware: | 14.7% (38,630) |
Number of households with income $100k - 125k:| Magnolia: | 40.8% (29) |
| State: | 12.4% (32,584) |
Number of households with income $125k - 150k:| Magnolia: | 8.5% (6) |
| State: | 9.5% (24,918) |
Number of households with income $150k - 200k:| Magnolia: | 7.0% (5) |
| Delaware: | 10.2% (27,001) |
Number of households with income > $200k:| Magnolia: | 0.0% (0) |
| State: | 11.8% (31,108) |
Aggregate household income in Magnolia in 2022: $6,096,437
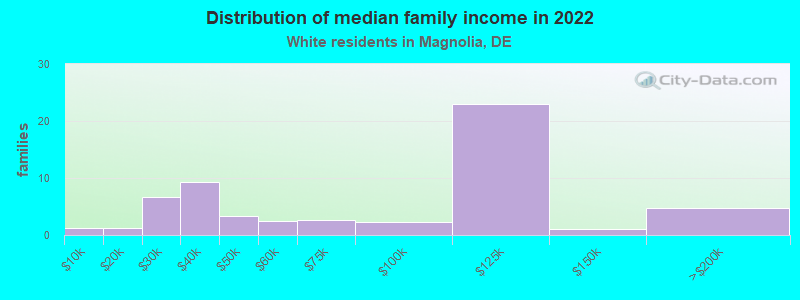
Median family income in Magnolia in 2022:| Magnolia: | $110,220 |
| Delaware: | $107,254 |
Number of families with income < $10k:| Magnolia: | 2.1% (1) |
| State: | 1.6% (2,775) |
Number of families with income $10k - 20k:| Magnolia: | 2.0% (1) |
| State: | 1.9% (3,364) |
Number of families with income $20k - 30k:| Magnolia: | 11.4% (7) |
| State: | 2.1% (3,677) |
Number of families with income $30k - 40k:| Magnolia: | 16.2% (9) |
| State: | 3.4% (5,879) |
Number of families with income $40k - 50k:| Magnolia: | 5.7% (3) |
| State: | 5.0% (8,600) |
Number of families with income $50k - 60k:| Magnolia: | 4.2% (2) |
| Delaware: | 5.6% (9,745) |
Number of families with income $60k - 75k:| Magnolia: | 4.5% (3) |
| State: | 10.0% (17,322) |
Number of families with income $75k - 100k:| Magnolia: | 3.9% (2) |
| State: | 15.9% (27,642) |
Number of families with income $100k - 125k:| Magnolia: | 39.8% (23) |
| Delaware: | 14.4% (25,049) |
Number of families with income $125k - 150k:| Magnolia: | 2.0% (1) |
| Delaware: | 11.0% (19,185) |
Number of families with income $150k - 200k:| Magnolia: | 8.1% (5) |
| State: | 13.4% (23,326) |
Median per capita income in Magnolia in 2022:| Magnolia: | $34,129 |
| State: | $49,694 |
Change in median per capita income between 2000 and 2022:| Magnolia, Delaware: | +99.2% |
| State: | +94.2% |
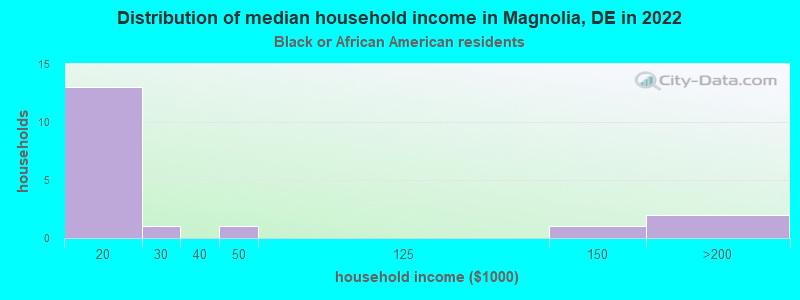
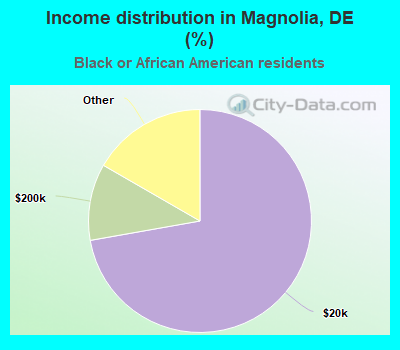
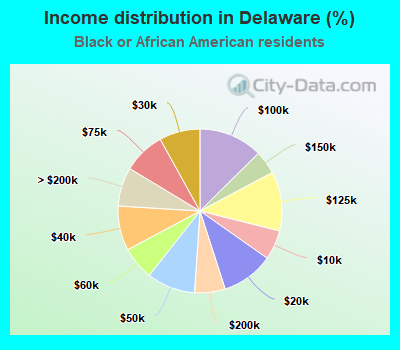
Income statistics for Black or African American residents
Number of households with income < $10k:| Magnolia: | 0.0% (0) |
| State: | 5.8% (4,827) |
Number of households with income $10k - 20k:| Magnolia: | 72.2% (13) |
| State: | 10.3% (8,504) |
Number of households with income $20k - 30k:| Magnolia: | 5.6% (1) |
| State: | 8.0% (6,660) |
Number of households with income $30k - 40k:| Magnolia: | 0.0% (0) |
| Delaware: | 8.8% (7,277) |
Number of households with income $40k - 50k:| Magnolia: | 5.6% (1) |
| State: | 9.6% (7,918) |
Number of households with income $50k - 60k:| Magnolia: | 0.0% (0) |
| State: | 6.6% (5,428) |
Number of households with income $60k - 75k:| Magnolia: | 0.0% (0) |
| State: | 8.3% (6,859) |
Number of households with income $75k - 100k:| Magnolia: | 0.0% (0) |
| State: | 12.6% (10,436) |
Number of households with income $100k - 125k:| Magnolia: | 0.0% (0) |
| State: | 11.7% (9,680) |
Number of households with income $125k - 150k:| Magnolia: | 5.6% (1) |
| Delaware: | 4.6% (3,826) |
Number of households with income $150k - 200k:| Magnolia: | 11.1% (2) |
| State: | 6.0% (4,991) |
Number of households with income > $200k:| Magnolia: | 0.0% (0) |
| State: | 7.7% (6,355) |
Aggregate household income in Magnolia in 2022: $801,281
Median non-family income in Magnolia in 2022:| Magnolia: | $10,035 |
| Delaware: | $36,936 |
Median per capita income in Magnolia in 2022:| Magnolia: | $19,933 |
| State: | $32,135 |
Change in median per capita income between 2000 and 2022:| Magnolia, Delaware: | +46.8% |
| State: | +98.7% |
Income statistics for Hispanic or Latino residents
Median per capita income in Magnolia in 2022:| Magnolia: | $10,628 |
| State: | $25,402 |
Income statistics for Multirace residents
Median per capita income in Magnolia in 2022:| Magnolia: | $10,681 |
| State: | $25,790 |