Marysville Rural, California (CA) income map, earnings map, and wages data
The median household income in Marysville Rural, CA in 2022 was $91,489, which was about the same as the median annual income of $91,551 across the entire state of California. Compared to the median income of $42,839 in 2000 this represents an increase of 53.2%. The per capita income in 2022 was $50,316, which means an increase of 56.5% compared to 2000 when it was $21,891.
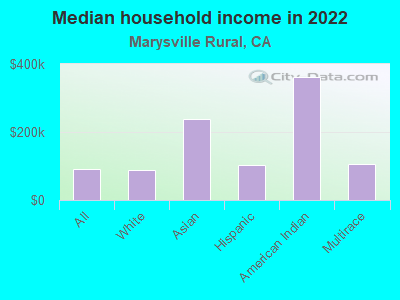
Income statistics for all residents
Median household income in Marysville Rural, CA in 2022:| Marysville Rural: | $91,489 |
| State: | $91,551 |
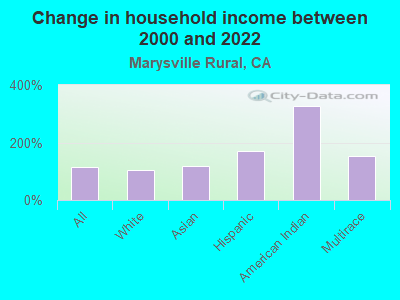
Change in median household income between 2000 and 2022:| Marysville Rural, California: | +113.6% |
| State: | +92.8% |
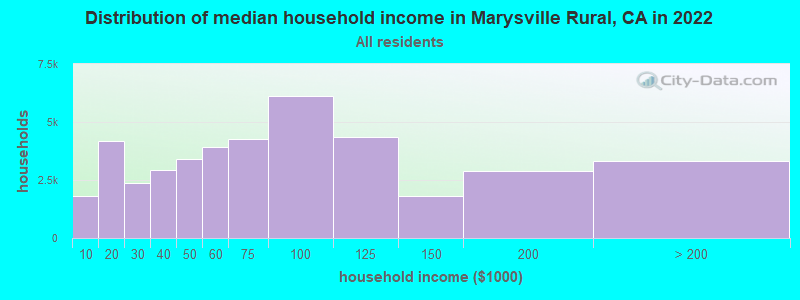
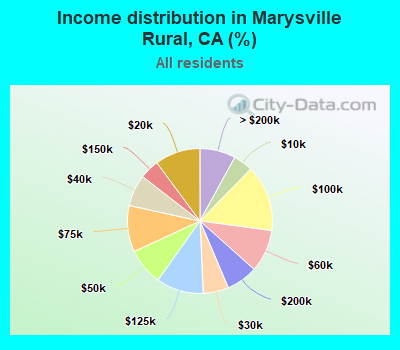
Number of households with income < $10k:| Marysville Rural: | 4.3% (1,790) |
| State: | 4.8% (654,370) |
Number of households with income $10k - 20k:| Marysville Rural: | 10.1% (4,198) |
| State: | 5.8% (789,493) |
Number of households with income $20k - 30k:| Marysville Rural: | 5.7% (2,350) |
| California: | 5.7% (778,318) |
Number of households with income $30k - 40k:| Marysville Rural: | 7.1% (2,920) |
| California: | 5.8% (783,170) |
Number of households with income $40k - 50k:| Marysville Rural: | 8.2% (3,412) |
| California: | 5.8% (781,352) |
Number of households with income $50k - 60k:| Marysville Rural: | 9.5% (3,927) |
| California: | 5.6% (760,175) |
Number of households with income $60k - 75k:| Marysville Rural: | 10.3% (4,282) |
| State: | 8.2% (1,104,699) |
Number of households with income $75k - 100k:| Marysville Rural: | 14.8% (6,138) |
| California: | 12.0% (1,627,633) |
Number of households with income $100k - 125k:| Marysville Rural: | 10.6% (4,367) |
| State: | 10.0% (1,358,619) |
Number of households with income $125k - 150k:| Marysville Rural: | 4.4% (1,806) |
| State: | 7.6% (1,027,455) |
Number of households with income $150k - 200k:| Marysville Rural: | 7.0% (2,899) |
| State: | 10.6% (1,439,811) |
Number of households with income > $200k:| Marysville Rural: | 8.0% (3,302) |
| California: | 18.0% (2,445,491) |
Aggregate household income in Marysville Rural in 2022: $429,555,744
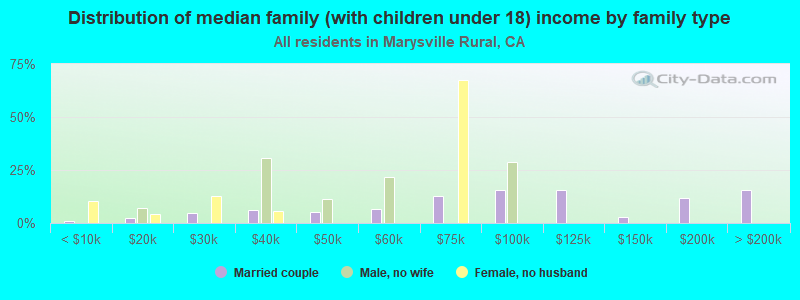
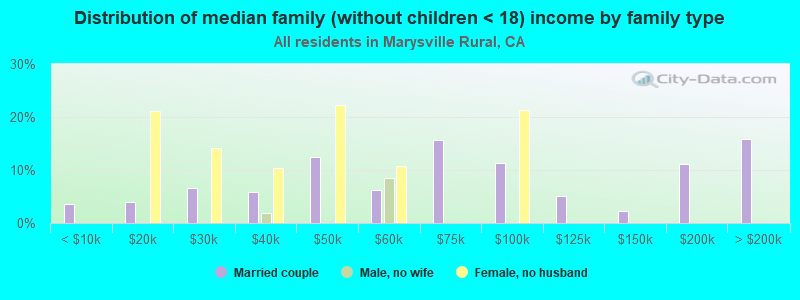
Median family income in Marysville Rural in 2022:| Marysville Rural: | $106,594 |
| State: | $104,823 |
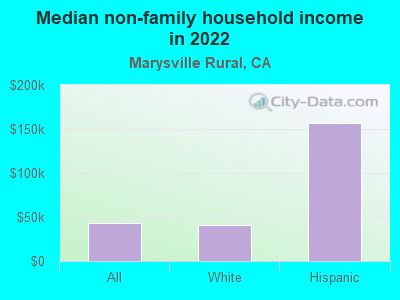
Median non-family income in Marysville Rural in 2022:| Marysville Rural: | $43,582 |
| State: | $59,348 |
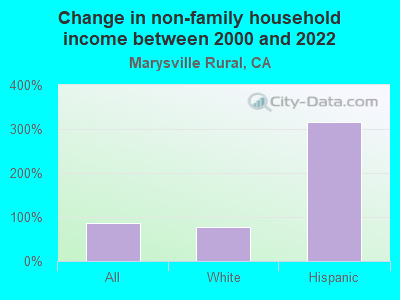
Change in median non-family income between 2000 and 2022:| Marysville Rural, California: | +87.3% |
| State: | +85.3% |
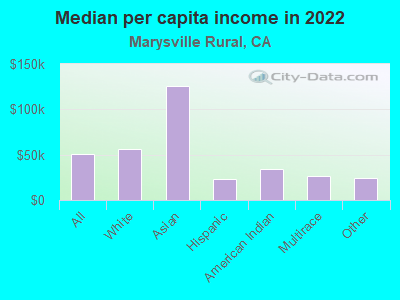
Median per capita income in Marysville Rural in 2022:| Marysville Rural: | $50,316 |
| State: | $46,661 |
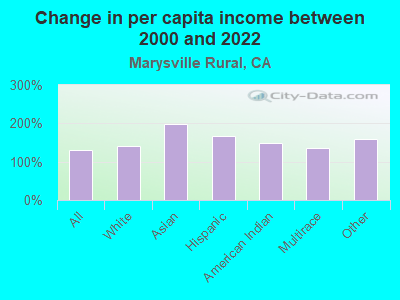
Change in median per capita income between 2000 and 2022:| Marysville Rural, California: | +129.8% |
| California: | +105.5% |
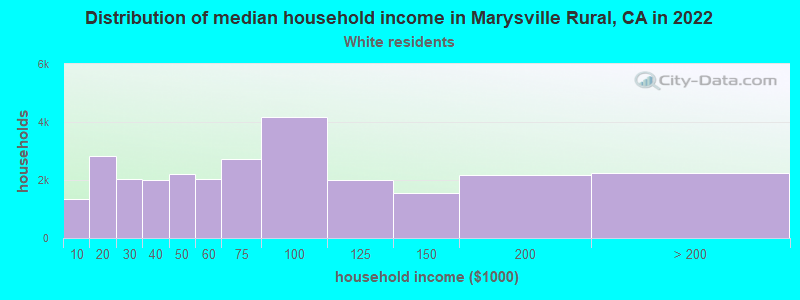
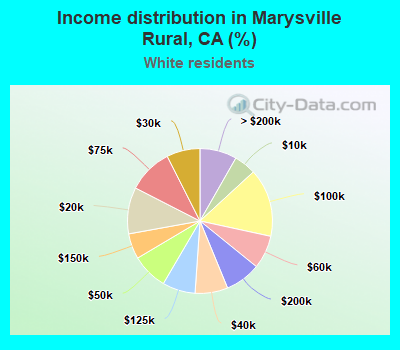
Income statistics for White residents
Median household income in Marysville Rural, CA in 2022:| Marysville Rural: | $88,728 |
| State: | $100,917 |
Change in median household income between 2000 and 2022:| Marysville Rural, California: | +105.8% |
| State: | +96.8% |
Number of households with income < $10k:| Marysville Rural: | 4.9% (1,344) |
| State: | 4.4% (284,109) |
Number of households with income $10k - 20k:| Marysville Rural: | 10.4% (2,839) |
| State: | 5.3% (340,330) |
Number of households with income $20k - 30k:| Marysville Rural: | 7.5% (2,041) |
| State: | 5.3% (343,145) |
Number of households with income $30k - 40k:| Marysville Rural: | 7.3% (1,995) |
| State: | 5.1% (330,146) |
Number of households with income $40k - 50k:| Marysville Rural: | 8.0% (2,195) |
| State: | 5.2% (335,310) |
Number of households with income $50k - 60k:| Marysville Rural: | 7.4% (2,030) |
| State: | 5.1% (326,299) |
Number of households with income $60k - 75k:| Marysville Rural: | 10.0% (2,738) |
| State: | 7.6% (487,640) |
Number of households with income $75k - 100k:| Marysville Rural: | 15.2% (4,170) |
| State: | 11.5% (736,578) |
Number of households with income $100k - 125k:| Marysville Rural: | 7.3% (2,010) |
| California: | 10.1% (648,782) |
Number of households with income $125k - 150k:| Marysville Rural: | 5.7% (1,555) |
| State: | 7.8% (499,671) |
Number of households with income $150k - 200k:| Marysville Rural: | 8.0% (2,181) |
| State: | 11.4% (729,603) |
Number of households with income > $200k:| Marysville Rural: | 8.3% (2,258) |
| State: | 21.2% (1,364,246) |
Aggregate household income in Marysville Rural in 2022: $342,156,328
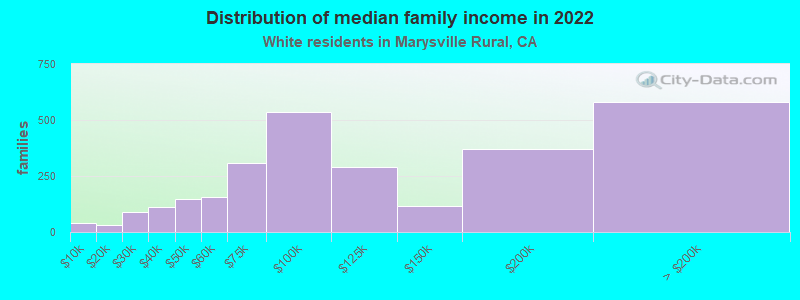
Median family income in Marysville Rural in 2022:| Marysville Rural: | $105,279 |
| State: | $125,379 |
Number of families with income < $10k:| Marysville Rural: | 1.4% (38) |
| State: | 2.2% (87,079) |
Number of families with income $10k - 20k:| Marysville Rural: | 1.2% (33) |
| California: | 2.5% (97,716) |
Number of families with income $20k - 30k:| Marysville Rural: | 3.3% (91) |
| State: | 3.5% (137,295) |
Number of families with income $30k - 40k:| Marysville Rural: | 4.0% (111) |
| California: | 3.9% (152,947) |
Number of families with income $40k - 50k:| Marysville Rural: | 5.3% (147) |
| State: | 4.3% (169,197) |
Number of families with income $50k - 60k:| Marysville Rural: | 5.7% (158) |
| State: | 4.5% (176,192) |
Number of families with income $60k - 75k:| Marysville Rural: | 11.0% (306) |
| State: | 7.0% (274,752) |
Number of families with income $75k - 100k:| Marysville Rural: | 19.2% (535) |
| California: | 11.3% (445,632) |
Number of families with income $100k - 125k:| Marysville Rural: | 10.5% (292) |
| State: | 10.7% (423,630) |
Number of families with income $125k - 150k:| Marysville Rural: | 4.1% (114) |
| State: | 9.1% (357,408) |
Number of families with income $150k - 200k:| Marysville Rural: | 13.3% (371) |
| State: | 13.5% (532,693) |
Number of families with income > $200k:| Marysville Rural: | 21.0% (582) |
| State: | 27.6% (1,086,948) |
Median non-family income in Marysville Rural in 2022:| Marysville Rural: | $40,363 |
| California: | $62,819 |
Change in median non-family income between 2000 and 2022:| Marysville Rural, California: | +77.5% |
| State: | +84.4% |
Median per capita income in Marysville Rural in 2022:| Marysville Rural: | $55,758 |
| State: | $61,706 |
Change in median per capita income between 2000 and 2022:| Marysville Rural, California: | +140.3% |
| California: | +122.7% |
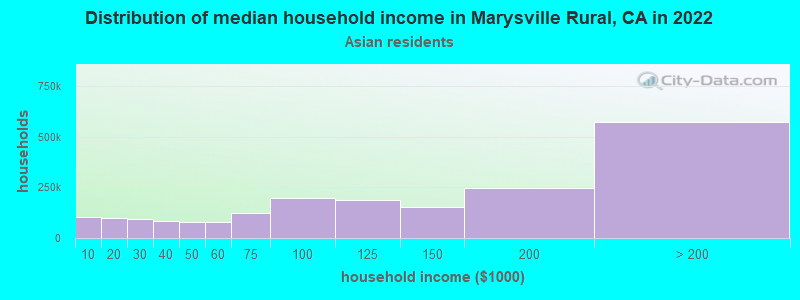
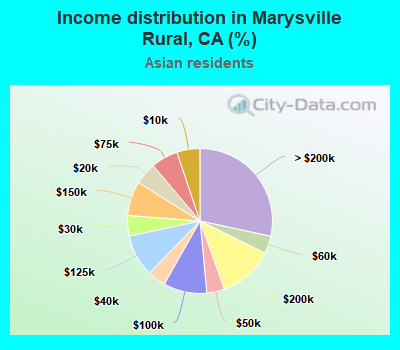
Income statistics for Asian residents
Median household income in Marysville Rural, CA in 2022:| Marysville Rural: | $237,178 |
| State: | $119,861 |
Change in median household income between 2000 and 2022:| Marysville Rural, California: | +119.6% |
| State: | +116.5% |
Number of households with income < $10k:| Marysville Rural: | 5.1% (103,603) |
| State: | 5.1% (106,273) |
Number of households with income $10k - 20k:| Marysville Rural: | 4.9% (99,304) |
| State: | 4.9% (101,815) |
Number of households with income $20k - 30k:| Marysville Rural: | 4.6% (92,046) |
| State: | 4.6% (94,414) |
Number of households with income $30k - 40k:| Marysville Rural: | 4.1% (82,392) |
| State: | 4.1% (84,491) |
Number of households with income $40k - 50k:| Marysville Rural: | 4.0% (79,713) |
| State: | 4.0% (81,758) |
Number of households with income $50k - 60k:| Marysville Rural: | 3.9% (78,910) |
| State: | 3.9% (80,971) |
Number of households with income $60k - 75k:| Marysville Rural: | 6.0% (121,068) |
| California: | 6.0% (124,194) |
Number of households with income $75k - 100k:| Marysville Rural: | 9.7% (195,394) |
| State: | 9.7% (200,337) |
Number of households with income $100k - 125k:| Marysville Rural: | 9.4% (188,631) |
| State: | 9.4% (193,488) |
Number of households with income $125k - 150k:| Marysville Rural: | 7.7% (154,318) |
| State: | 7.7% (158,253) |
Number of households with income $150k - 200k:| Marysville Rural: | 12.2% (245,795) |
| State: | 12.2% (252,139) |
Number of households with income > $200k:| Marysville Rural: | 28.4% (571,844) |
| State: | 28.4% (586,641) |
Aggregate household income in Marysville Rural in 2022: $15,346,229
Median family income in Marysville Rural in 2022:| Marysville Rural: | $196,100 |
| California: | $136,040 |
Median per capita income in Marysville Rural in 2022:| Marysville Rural: | $125,856 |
| State: | $58,824 |
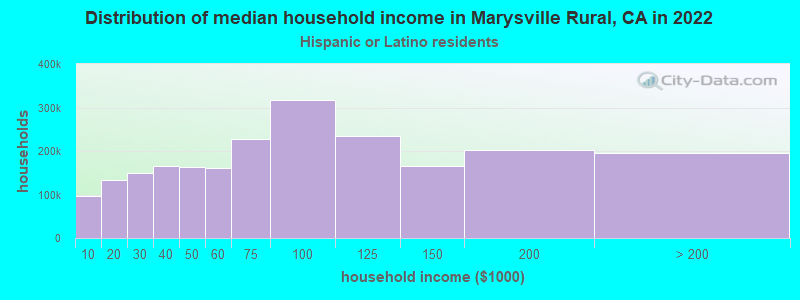
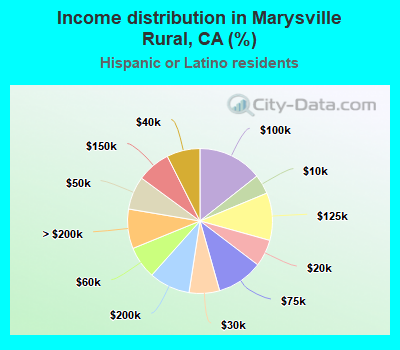
Income statistics for Hispanic or Latino residents
Median household income in Marysville Rural, CA in 2022:| Marysville Rural: | $103,794 |
| California: | $75,698 |
Number of households with income < $10k:| Marysville Rural: | 4.3% (96,246) |
| California: | 4.3% (183,294) |
Number of households with income $10k - 20k:| Marysville Rural: | 6.0% (133,186) |
| California: | 6.0% (253,903) |
Number of households with income $20k - 30k:| Marysville Rural: | 6.8% (150,277) |
| State: | 6.8% (286,386) |
Number of households with income $30k - 40k:| Marysville Rural: | 7.4% (164,589) |
| California: | 7.4% (313,728) |
Number of households with income $40k - 50k:| Marysville Rural: | 7.4% (164,356) |
| State: | 7.4% (313,199) |
Number of households with income $50k - 60k:| Marysville Rural: | 7.2% (160,229) |
| State: | 7.2% (305,366) |
Number of households with income $60k - 75k:| Marysville Rural: | 10.3% (228,101) |
| California: | 10.3% (434,937) |
Number of households with income $75k - 100k:| Marysville Rural: | 14.4% (318,180) |
| State: | 14.4% (607,302) |
Number of households with income $100k - 125k:| Marysville Rural: | 10.6% (234,598) |
| California: | 10.6% (447,424) |
Number of households with income $125k - 150k:| Marysville Rural: | 7.5% (165,495) |
| State: | 7.5% (316,022) |
Number of households with income $150k - 200k:| Marysville Rural: | 9.1% (202,469) |
| State: | 9.2% (386,269) |
Number of households with income > $200k:| Marysville Rural: | 8.8% (195,503) |
| California: | 8.8% (372,651) |
Aggregate household income in Marysville Rural in 2022: $28,142,247
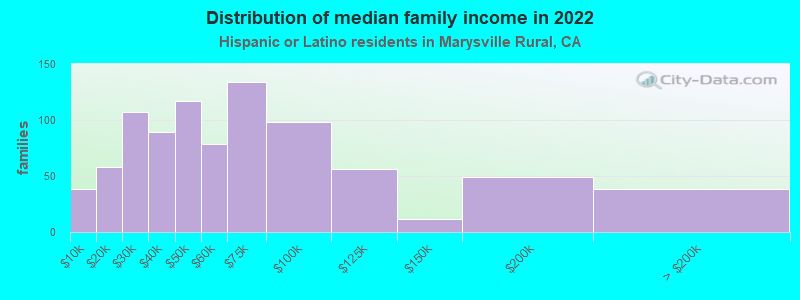
Median family income in Marysville Rural in 2022:| Marysville Rural: | $103,516 |
| California: | $77,589 |
Number of families with income < $10k:| Marysville Rural: | 4.4% (38) |
| State: | 3.9% (129,468) |
Number of families with income $10k - 20k:| Marysville Rural: | 6.7% (58) |
| State: | 4.6% (151,997) |
Number of families with income $20k - 30k:| Marysville Rural: | 12.2% (107) |
| State: | 6.6% (216,764) |
Number of families with income $30k - 40k:| Marysville Rural: | 10.1% (89) |
| California: | 7.6% (249,849) |
Number of families with income $40k - 50k:| Marysville Rural: | 13.3% (117) |
| State: | 7.7% (254,822) |
Number of families with income $50k - 60k:| Marysville Rural: | 9.0% (79) |
| California: | 7.4% (244,815) |
Number of families with income $60k - 75k:| Marysville Rural: | 15.3% (134) |
| State: | 10.5% (345,838) |
Number of families with income $75k - 100k:| Marysville Rural: | 11.2% (98) |
| State: | 14.9% (491,589) |
Number of families with income $100k - 125k:| Marysville Rural: | 6.4% (56) |
| California: | 10.7% (355,400) |
Number of families with income $125k - 150k:| Marysville Rural: | 1.4% (12) |
| State: | 7.8% (259,317) |
Number of families with income $150k - 200k:| Marysville Rural: | 5.6% (49) |
| State: | 9.3% (306,566) |
Number of families with income > $200k:| Marysville Rural: | 4.4% (38) |
| California: | 9.1% (299,984) |
Median non-family income in Marysville Rural in 2022:| Marysville Rural: | $156,613 |
| State: | $49,746 |
Median per capita income in Marysville Rural in 2022:| Marysville Rural: | $22,923 |
| State: | $27,240 |
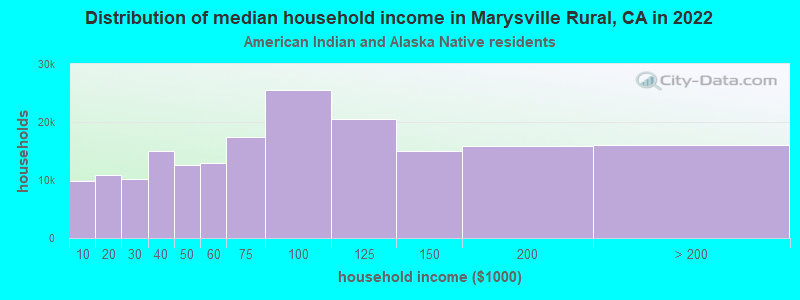
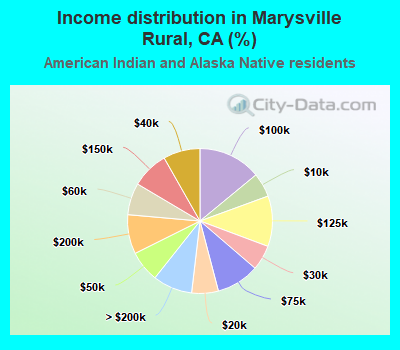
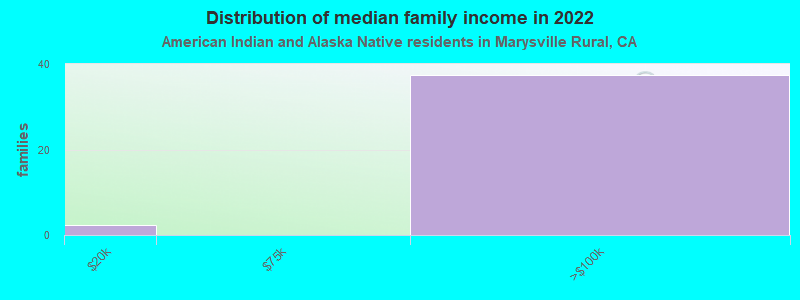
Income statistics for American Indian and Alaska Native residents
Median household income in Marysville Rural, CA in 2022:| Marysville Rural: | $362,168 |
| California: | $76,752 |
Number of households with income < $10k:| Marysville Rural: | 5.4% (9,815) |
| State: | 5.4% (8,471) |
Number of households with income $10k - 20k:| Marysville Rural: | 6.0% (10,831) |
| State: | 6.0% (9,381) |
Number of households with income $20k - 30k:| Marysville Rural: | 5.6% (10,174) |
| State: | 5.5% (8,668) |
Number of households with income $30k - 40k:| Marysville Rural: | 8.2% (14,926) |
| State: | 8.3% (13,030) |
Number of households with income $40k - 50k:| Marysville Rural: | 7.0% (12,630) |
| State: | 6.9% (10,908) |
Number of households with income $50k - 60k:| Marysville Rural: | 7.1% (12,908) |
| State: | 7.1% (11,198) |
Number of households with income $60k - 75k:| Marysville Rural: | 9.6% (17,436) |
| State: | 9.6% (15,190) |
Number of households with income $75k - 100k:| Marysville Rural: | 14.0% (25,470) |
| California: | 14.1% (22,274) |
Number of households with income $100k - 125k:| Marysville Rural: | 11.3% (20,462) |
| State: | 11.2% (17,643) |
Number of households with income $125k - 150k:| Marysville Rural: | 8.3% (14,993) |
| California: | 8.3% (13,117) |
Number of households with income $150k - 200k:| Marysville Rural: | 8.8% (15,933) |
| California: | 8.8% (13,853) |
Number of households with income > $200k:| Marysville Rural: | 8.8% (15,999) |
| California: | 8.8% (13,925) |
Aggregate household income in Marysville Rural in 2022: $5,275,545
Median family income in Marysville Rural in 2022:| Marysville Rural: | $298,074 |
| State: | $81,108 |
Number of families with income $10k - 20k:| Marysville Rural: | 5.9% (2) |
| California: | 3.7% (4,148) |
Number of families with income $75k - 100k:| Marysville Rural: | 94.1% (37) |
| State: | 14.8% (16,731) |
Median per capita income in Marysville Rural in 2022:| Marysville Rural: | $34,722 |
| State: | $30,289 |
Change in median per capita income between 2000 and 2022:| Marysville Rural, California: | +147.5% |
| State: | +98.9% |
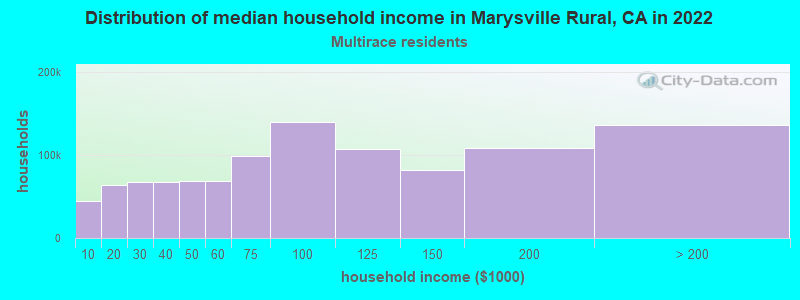
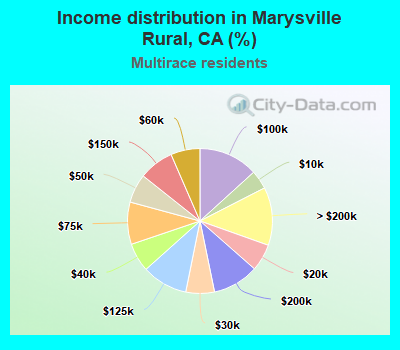
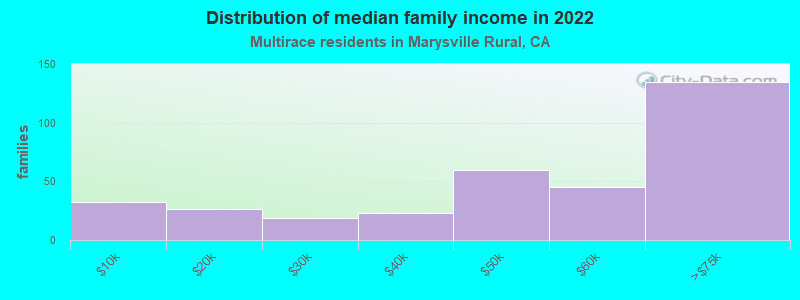
Income statistics for Multirace residents
Median household income in Marysville Rural, CA in 2022:| Marysville Rural: | $105,802 |
| State: | $83,153 |
Number of households with income < $10k:| Marysville Rural: | 4.2% (44,339) |
| California: | 4.2% (85,299) |
Number of households with income $10k - 20k:| Marysville Rural: | 6.1% (63,877) |
| State: | 6.1% (122,966) |
Number of households with income $20k - 30k:| Marysville Rural: | 6.4% (67,262) |
| California: | 6.4% (129,328) |
Number of households with income $30k - 40k:| Marysville Rural: | 6.4% (67,620) |
| State: | 6.4% (130,070) |
Number of households with income $40k - 50k:| Marysville Rural: | 6.5% (68,205) |
| State: | 6.5% (131,254) |
Number of households with income $50k - 60k:| Marysville Rural: | 6.5% (68,791) |
| State: | 6.5% (132,382) |
Number of households with income $60k - 75k:| Marysville Rural: | 9.4% (99,431) |
| State: | 9.4% (191,472) |
Number of households with income $75k - 100k:| Marysville Rural: | 13.3% (139,936) |
| California: | 13.3% (269,691) |
Number of households with income $100k - 125k:| Marysville Rural: | 10.2% (107,659) |
| State: | 10.2% (207,286) |
Number of households with income $125k - 150k:| Marysville Rural: | 7.8% (82,089) |
| State: | 7.8% (158,259) |
Number of households with income $150k - 200k:| Marysville Rural: | 10.3% (108,627) |
| California: | 10.3% (209,227) |
Number of households with income > $200k:| Marysville Rural: | 13.0% (136,695) |
| State: | 13.0% (263,210) |
Aggregate household income in Marysville Rural in 2022: $42,684,926
Median family income in Marysville Rural in 2022:| Marysville Rural: | $102,539 |
| California: | $87,642 |
Number of families with income < $10k:| Marysville Rural: | 9.5% (32) |
| California: | 3.2% (48,017) |
Number of families with income $10k - 20k:| Marysville Rural: | 7.6% (26) |
| California: | 4.1% (60,419) |
Number of families with income $20k - 30k:| Marysville Rural: | 5.5% (19) |
| State: | 6.1% (89,742) |
Number of families with income $30k - 40k:| Marysville Rural: | 6.9% (23) |
| California: | 6.2% (91,415) |
Number of families with income $40k - 50k:| Marysville Rural: | 17.5% (60) |
| California: | 6.8% (100,085) |
Number of families with income $50k - 60k:| Marysville Rural: | 13.4% (45) |
| State: | 6.7% (98,298) |
Number of families with income $60k - 75k:| Marysville Rural: | 39.6% (135) |
| State: | 9.5% (140,131) |
Median per capita income in Marysville Rural in 2022:| Marysville Rural: | $26,018 |
| California: | $32,124 |
Change in median per capita income between 2000 and 2022:| Marysville Rural, California: | +135.1% |
| State: | +120.4% |
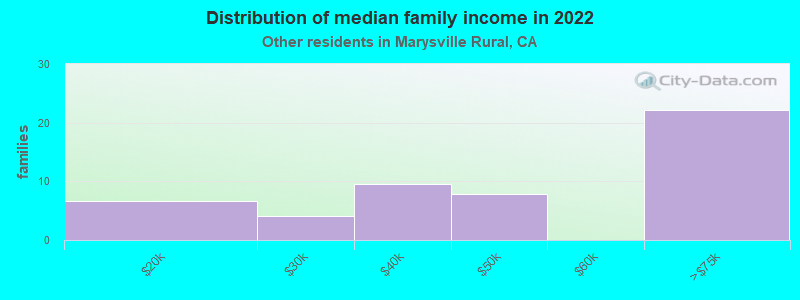
Income statistics for other residents
Number of households with income < $10k:| Marysville Rural: | 4.6% (43) |
| California: | 4.6% (93,035) |
Number of households with income $10k - 20k:| Marysville Rural: | 6.2% (58) |
| California: | 6.3% (126,222) |
Number of households with income $20k - 30k:| Marysville Rural: | 7.1% (66) |
| California: | 7.1% (142,656) |
Number of households with income $30k - 40k:| Marysville Rural: | 8.3% (77) |
| California: | 8.2% (165,018) |
Number of households with income $40k - 50k:| Marysville Rural: | 8.1% (75) |
| State: | 8.0% (161,732) |
Number of households with income $50k - 60k:| Marysville Rural: | 7.5% (70) |
| State: | 7.6% (152,152) |
Number of households with income $60k - 75k:| Marysville Rural: | 10.4% (97) |
| State: | 10.4% (209,951) |
Number of households with income $75k - 100k:| Marysville Rural: | 14.7% (137) |
| State: | 14.7% (296,102) |
Number of households with income $100k - 125k:| Marysville Rural: | 10.6% (99) |
| State: | 10.7% (214,281) |
Number of households with income $125k - 150k:| Marysville Rural: | 7.1% (66) |
| State: | 7.1% (143,092) |
Number of households with income $150k - 200k:| Marysville Rural: | 8.6% (80) |
| State: | 8.6% (172,215) |
Number of households with income > $200k:| Marysville Rural: | 6.7% (62) |
| State: | 6.7% (134,102) |
Aggregate household income in Marysville Rural in 2022: $6,257,602
Median family income in Marysville Rural in 2022:| Marysville Rural: | $91,502 |
| California: | $72,756 |
Number of families with income $10k - 20k:| Marysville Rural: | 13.3% (7) |
| State: | 5.1% (82,116) |
Number of families with income $20k - 30k:| Marysville Rural: | 8.0% (4) |
| State: | 7.0% (112,854) |
Number of families with income $30k - 40k:| Marysville Rural: | 18.9% (9) |
| State: | 8.4% (135,938) |
Number of families with income $40k - 50k:| Marysville Rural: | 15.5% (8) |
| State: | 8.4% (135,353) |
Number of families with income $60k - 75k:| Marysville Rural: | 44.3% (22) |
| California: | 10.7% (173,628) |
Median per capita income in Marysville Rural in 2022:| Marysville Rural: | $24,129 |
| State: | $25,164 |