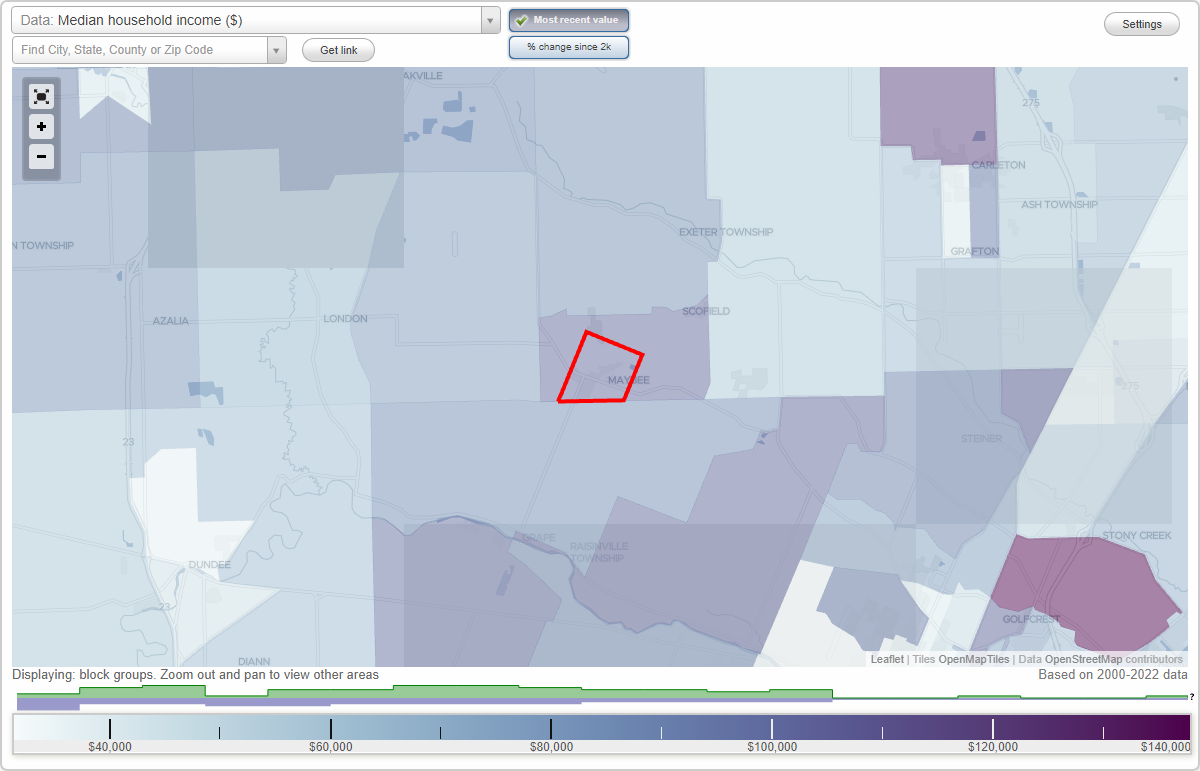
The median household income in Maybee, MI in 2022 was $52,119, which was 28.5% less than the median annual income of $66,986 across the entire state of Michigan. Compared to the median income of $50,962 in 2000 this represents an increase of 2.2%. The per capita income in 2022 was $37,477, which means an increase of 50.1% compared to 2000 when it was $18,716.
Whole page based on the data from 2000 / 2022 when the population of Maybee, Michigan was 505 / 663
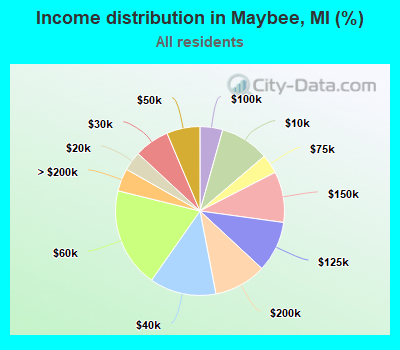
Income statistics for all residents
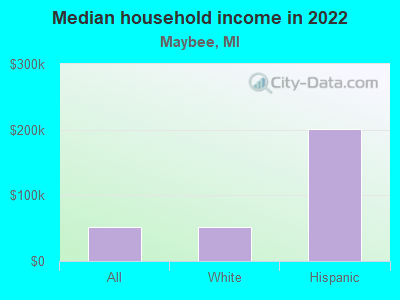
Median household income in Maybee, MI in 2022:
Maybee:
$52,120
Michigan:
$66,986
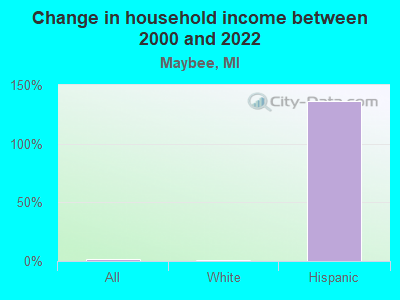
Change in median household income between 2000 and 2022:
Maybee, Michigan:
+2.3%
State:
+50.0%
Number of households with income < $10k:
Maybee:
9.4% (28)
Michigan:
5.7% (231,223)
Number of households with income $10k - 20k:
Maybee:
3.7% (11)
State:
7.5% (306,955)
Number of households with income $20k - 30k:
Maybee:
6.7% (20)
State:
7.9% (324,153)
Number of households with income $30k - 40k:
Maybee:
12.8% (38)
State:
8.3% (341,408)
Number of households with income $40k - 50k:
Maybee:
6.4% (19)
State:
7.9% (322,255)
Number of households with income $50k - 60k:
Maybee:
19.1% (57)
State:
7.5% (305,914)
Number of households with income $60k - 75k:
Maybee:
3.7% (11)
Michigan:
10.1% (414,440)
Number of households with income $75k - 100k:
Maybee:
4.4% (13)
State:
13.2% (538,299)
Number of households with income $100k - 125k:
Maybee:
9.7% (29)
State:
9.7% (396,282)
Number of households with income $125k - 150k:
Maybee:
9.7% (29)
State:
6.7% (273,144)
Number of households with income $150k - 200k:
Maybee:
10.1% (30)
Michigan:
7.5% (305,077)
Number of households with income > $200k:
Maybee:
4.4% (13)
Michigan:
8.1% (330,644)
Aggregate household income in Maybee in 2022: $25,414,836
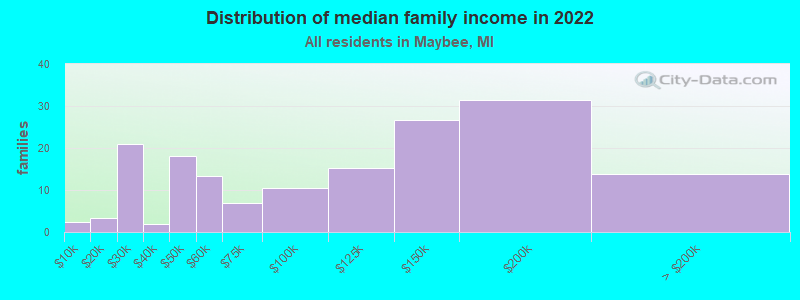
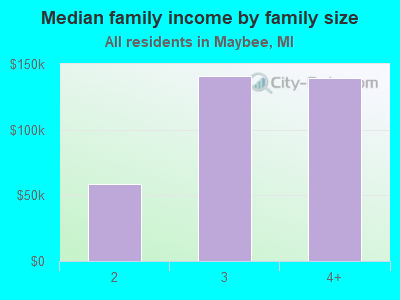
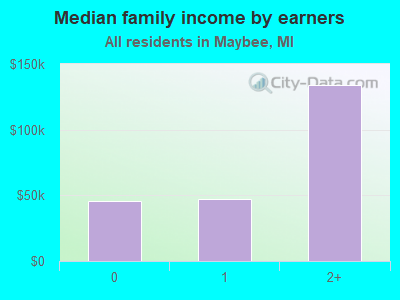
Median family income in Maybee in 2022:
Maybee:
$114,343
Michigan:
$85,865
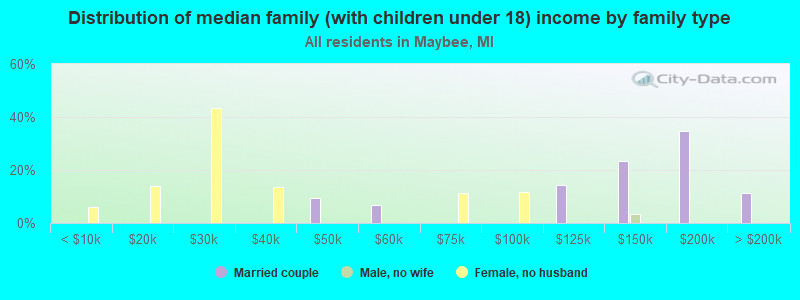
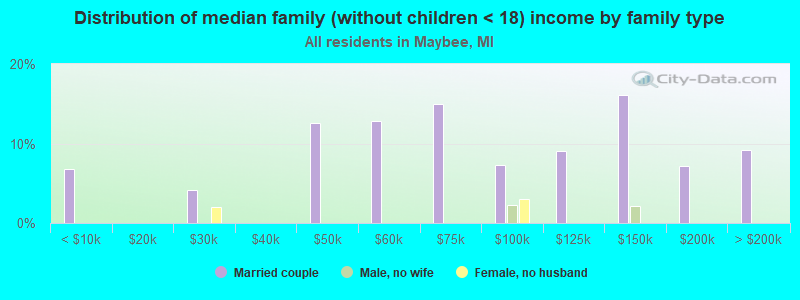
Number of families with income < $10k:
Maybee:
1.5% (2)
State:
3.5% (89,010)
Number of families with income $10k - 20k:
Maybee:
2.1% (3)
Michigan:
3.9% (100,567)
Number of families with income $20k - 30k:
Maybee:
12.7% (21)
State:
5.0% (127,320)
Number of families with income $30k - 40k:
Maybee:
1.1% (2)
State:
6.4% (163,565)
Number of families with income $40k - 50k:
Maybee:
11.0% (18)
State:
6.8% (172,384)
Number of families with income $50k - 60k:
Maybee:
8.1% (13)
State:
7.1% (179,870)
Number of families with income $60k - 75k:
Maybee:
4.2% (7)
Michigan:
10.3% (263,723)
Number of families with income $75k - 100k:
Maybee:
6.4% (11)
Michigan:
15.0% (383,364)
Number of families with income $100k - 125k:
Maybee:
9.2% (15)
State:
11.8% (301,751)
Number of families with income $125k - 150k:
Maybee:
16.2% (27)
State:
8.6% (220,338)
Number of families with income $150k - 200k:
Maybee:
19.1% (31)
State:
10.2% (259,462)
Number of families with income > $200k:
Maybee:
8.4% (14)
Michigan:
11.3% (287,206)
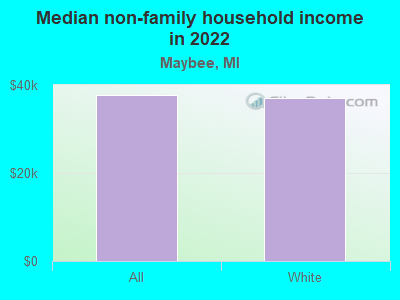
Median non-family income in Maybee in 2022:
Maybee:
$37,629
State:
$40,459
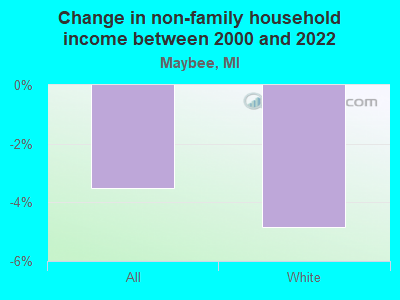
Change in median non-family income between 2000 and 2022:: -3.5%
Maybee, Michigan:
-3.5%
State:
+54.5%
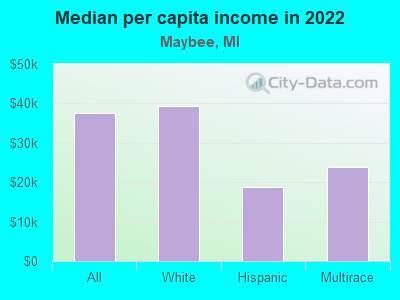
Median per capita income in Maybee in 2022:
Maybee:
$37,477
Michigan:
$38,151
Change in median per capita income between 2000 and 2022:
Maybee, Michigan:
+100.2%
Michigan:
+72.1%
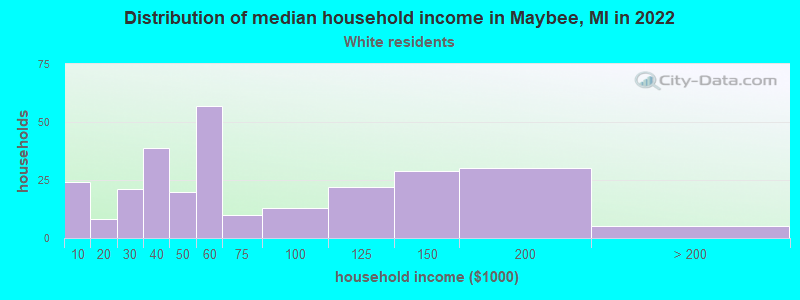
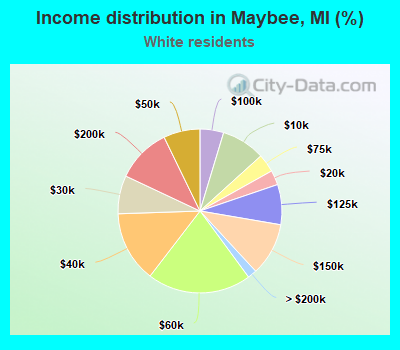
Income statistics for White residents
Median household income in Maybee, MI in 2022:
Maybee:
$51,383
State:
$71,609
Change in median household income between 2000 and 2022:
Maybee, Michigan:
+0.8%
Michigan:
+52.9%
Number of households with income < $10k:
Maybee:
8.6% (24)
State:
4.4% (140,440)
Number of households with income $10k - 20k:
Maybee:
2.9% (8)
Michigan:
6.5% (205,547)
Number of households with income $20k - 30k:
Maybee:
7.6% (21)
State:
7.6% (242,254)
Number of households with income $30k - 40k:
Maybee:
14.0% (39)
Michigan:
8.1% (257,175)
Number of households with income $40k - 50k:
Maybee:
7.2% (20)
Michigan:
7.8% (246,839)
Number of households with income $50k - 60k:
Maybee:
20.5% (57)
Michigan:
7.4% (233,723)
Number of households with income $60k - 75k:
Maybee:
3.6% (10)
State:
10.4% (328,664)
Number of households with income $75k - 100k:
Maybee:
4.7% (13)
State:
13.6% (431,867)
Number of households with income $100k - 125k:
Maybee:
7.9% (22)
State:
10.3% (325,164)
Number of households with income $125k - 150k:
Maybee:
10.4% (29)
Michigan:
7.1% (226,232)
Number of households with income $150k - 200k:
Maybee:
10.8% (30)
State:
8.1% (255,445)
Number of households with income > $200k:
Maybee:
1.8% (5)
State:
8.7% (276,727)
Aggregate household income in Maybee in 2022: $21,693,806
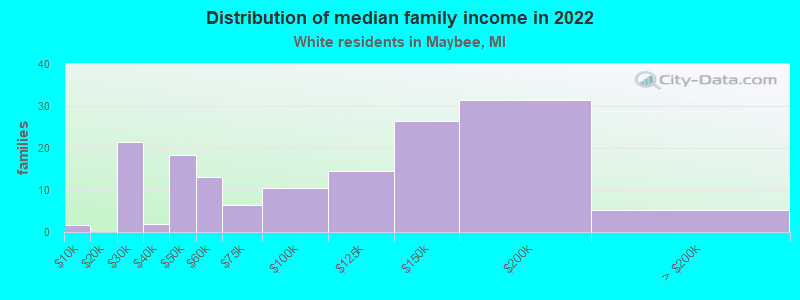
Median family income in Maybee in 2022:
Maybee:
$110,649
Michigan:
$90,317
Number of families with income < $10k:
Maybee:
1.1% (2)
Michigan:
2.5% (49,508)
Number of families with income $20k - 30k:
Maybee:
14.2% (21)
State:
4.6% (91,551)
Number of families with income $30k - 40k:
Maybee:
1.2% (2)
Michigan:
5.9% (117,356)
Number of families with income $40k - 50k:
Maybee:
12.1% (18)
State:
6.4% (127,491)
Number of families with income $50k - 60k:
Maybee:
8.7% (13)
State:
6.8% (135,883)
Number of families with income $60k - 75k:
Maybee:
4.3% (6)
Michigan:
10.5% (209,130)
Number of families with income $75k - 100k:
Maybee:
6.9% (10)
State:
15.5% (309,815)
Number of families with income $100k - 125k:
Maybee:
9.7% (15)
State:
12.4% (248,235)
Number of families with income $125k - 150k:
Maybee:
17.5% (27)
State:
9.2% (182,895)
Number of families with income $150k - 200k:
Maybee:
20.8% (32)
Michigan:
11.0% (218,573)
Number of families with income > $200k:
Maybee:
3.5% (5)
Michigan:
12.0% (239,713)
Median non-family income in Maybee in 2022:
Maybee:
$37,118
Michigan:
$42,438
Change in median non-family income between 2000 and 2022:: -4.8%
Maybee, Michigan:
-4.8%
Michigan:
+56.8%
Median per capita income in Maybee in 2022:
Maybee:
$39,265
State:
$41,514
Change in median per capita income between 2000 and 2022:
Maybee, Michigan:
+109.8%
State:
+75.2%
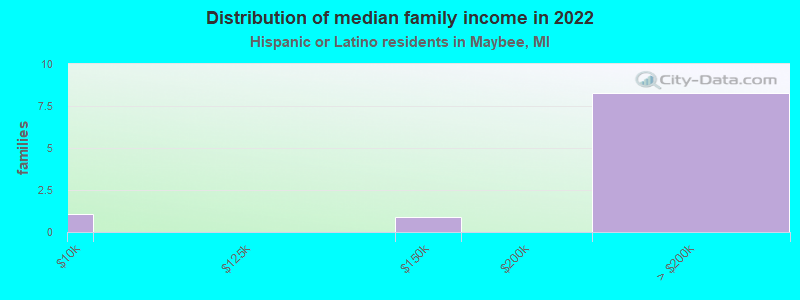
Income statistics for Hispanic or Latino residents
Median household income in Maybee, MI in 2022:
Maybee:
$201,471
Michigan:
$62,497
Change in median household income between 2000 and 2022:
Maybee, Michigan:
+135.7%
Michigan:
+62.4%
Aggregate household income in Maybee in 2022: $785,128
Median family income in Maybee in 2022:
Maybee:
$159,384
State:
$69,994
Median per capita income in Maybee in 2022:
Maybee:
$18,780
State:
$25,462
Change in median per capita income between 2000 and 2022:: -38.6%
Maybee, Michigan:
-38.6%
State:
+83.3%
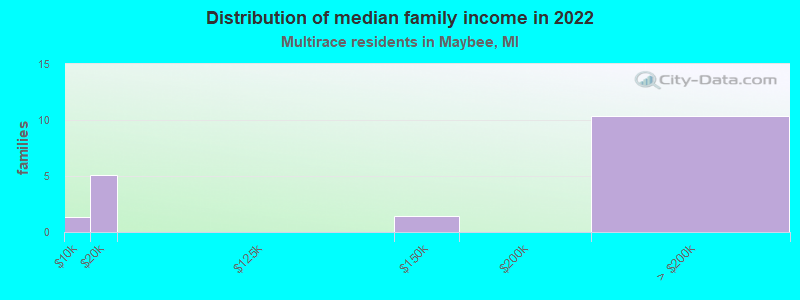
Income statistics for Multirace residents
Number of households with income < $10k:
Maybee:
8.3% (2)
State:
6.1% (12,463)
Number of households with income $10k - 20k:
Maybee:
16.7% (4)
State:
8.7% (17,830)
Number of households with income $20k - 30k:
Maybee:
0.0% (0)
Michigan:
7.6% (15,686)
Number of households with income $30k - 40k:
Maybee:
0.0% (0)
Michigan:
9.5% (19,444)
Number of households with income $40k - 50k:
Maybee:
0.0% (0)
Michigan:
7.5% (15,476)
Number of households with income $50k - 60k:
Maybee:
0.0% (0)
State:
8.1% (16,622)
Number of households with income $60k - 75k:
Maybee:
0.0% (0)
State:
10.6% (21,725)
Number of households with income $75k - 100k:
Maybee:
0.0% (0)
State:
14.4% (29,501)
Number of households with income $100k - 125k:
Maybee:
29.2% (7)
State:
8.9% (18,231)
Number of households with income $125k - 150k:
Maybee:
4.2% (1)
State:
5.8% (11,923)
Number of households with income $150k - 200k:
Maybee:
0.0% (0)
State:
6.8% (13,956)
Number of households with income > $200k:
Maybee:
41.7% (10)
Michigan:
6.2% (12,672)
Aggregate household income in Maybee in 2022: $4,858,051
Median family income in Maybee in 2022:
Maybee:
$255,497
State:
$75,671
Number of families with income < $10k:
Maybee:
7.4% (1)
Michigan:
4.0% (5,293)
Number of families with income $10k - 20k:
Maybee:
27.9% (5)
State:
6.1% (8,152)
Number of families with income $125k - 150k:
Maybee:
7.6% (1)
State:
7.6% (10,084)
Number of families with income > $200k:
Maybee:
57.1% (10)
Michigan:
8.5% (11,351)
Median per capita income in Maybee in 2022:
Maybee:
$23,980
Michigan:
$26,098
Discuss Maybee, Michigan (MI) on our hugely popular Michigan forum.