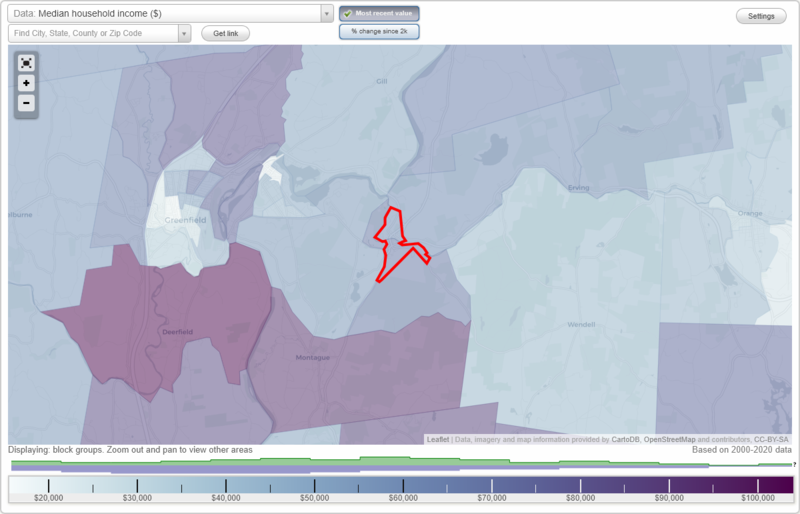
The median household income in Millers Falls, MA in 2022 was $60,388, which was 56.5% less than the median annual income of $94,488 across the entire state of Massachusetts. Compared to the median income of $37,337 in 2000 this represents an increase of 38.2%. The per capita income in 2022 was $32,612, which means an increase of 45.5% compared to 2000 when it was $17,768.
Whole page based on the data from 2000 / 2022 when the population of Millers Falls, Massachusetts was 1,072 / 1,060
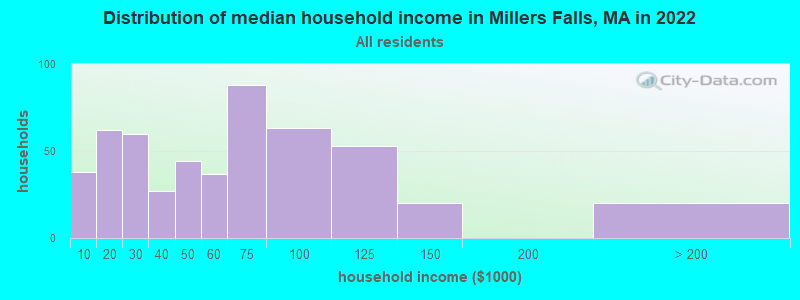
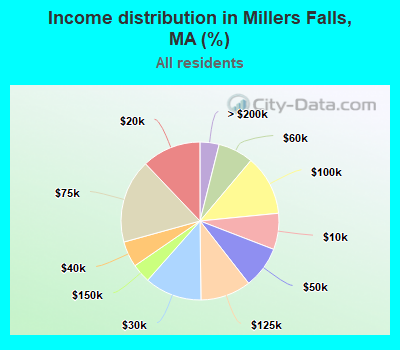
Income statistics for all residents
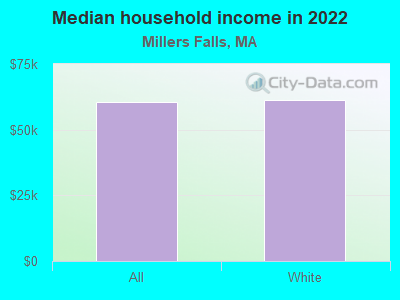
Median household income in Millers Falls, MA in 2022:
Millers Falls:
$60,389
Massachusetts:
$94,488
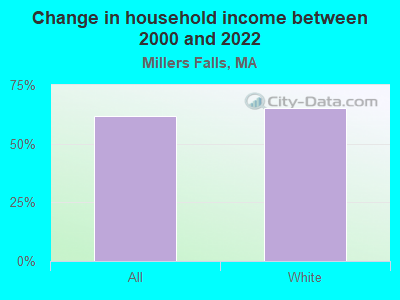
Change in median household income between 2000 and 2022:
Millers Falls, Massachusetts:
+61.7%
State:
+87.1%
Number of households with income < $10k:
Millers Falls:
7.4% (38)
Massachusetts:
5.2% (146,170)
Number of households with income $10k - 20k:
Millers Falls:
12.1% (62)
State:
6.4% (180,001)
Number of households with income $20k - 30k:
Millers Falls:
11.7% (60)
Massachusetts:
5.6% (156,667)
Number of households with income $30k - 40k:
Millers Falls:
5.3% (27)
Massachusetts:
5.6% (157,168)
Number of households with income $40k - 50k:
Millers Falls:
8.6% (44)
State:
5.4% (151,455)
Number of households with income $50k - 60k:
Millers Falls:
7.2% (37)
State:
5.1% (142,726)
Number of households with income $60k - 75k:
Millers Falls:
17.2% (88)
State:
7.6% (212,203)
Number of households with income $75k - 100k:
Millers Falls:
12.3% (63)
Massachusetts:
11.3% (317,064)
Number of households with income $100k - 125k:
Millers Falls:
10.4% (53)
State:
9.7% (270,603)
Number of households with income $125k - 150k:
Millers Falls:
3.9% (20)
State:
8.0% (223,140)
Number of households with income $150k - 200k:
Millers Falls:
0.0% (0)
Massachusetts:
11.0% (308,695)
Number of households with income > $200k:
Millers Falls:
3.9% (20)
State:
19.0% (531,884)
Aggregate household income in Millers Falls in 2022: $35,440,190
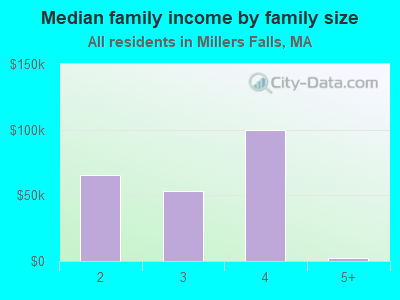
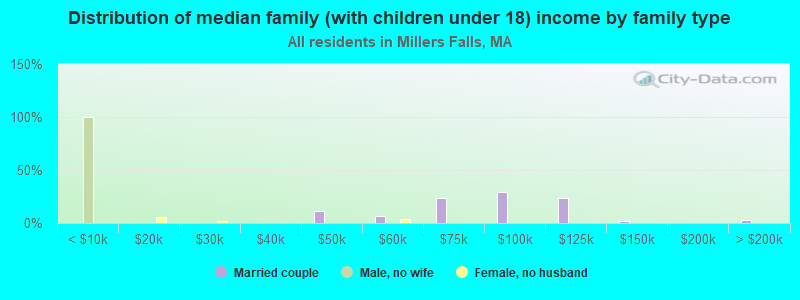
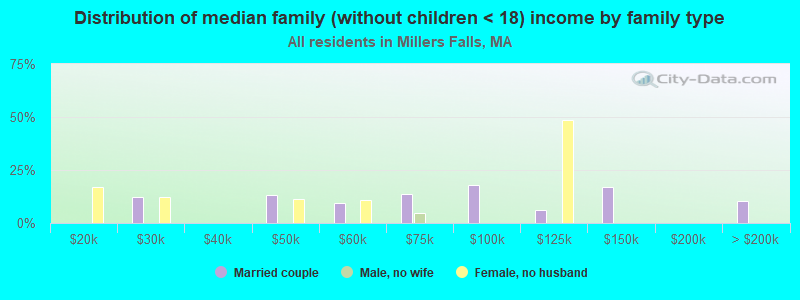
Median family income in Millers Falls in 2022:
Millers Falls:
$63,652
State:
$120,263
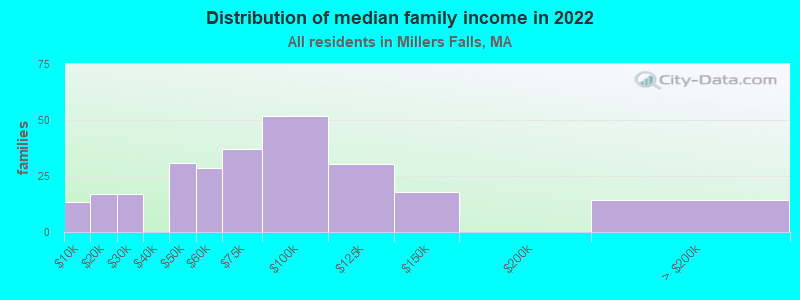
Number of families with income < $10k:
Millers Falls:
5.2% (13)
Massachusetts:
2.9% (49,671)
Number of families with income $10k - 20k:
Millers Falls:
6.6% (17)
Massachusetts:
2.9% (50,542)
Number of families with income $20k - 30k:
Millers Falls:
6.6% (17)
State:
3.9% (66,398)
Number of families with income $40k - 50k:
Millers Falls:
11.9% (31)
State:
4.5% (77,656)
Number of families with income $50k - 60k:
Millers Falls:
11.1% (29)
Massachusetts:
4.5% (77,928)
Number of families with income $60k - 75k:
Millers Falls:
14.3% (37)
Massachusetts:
7.0% (120,295)
Number of families with income $75k - 100k:
Millers Falls:
20.1% (52)
Massachusetts:
11.1% (192,172)
Number of families with income $100k - 125k:
Millers Falls:
11.7% (30)
Massachusetts:
10.6% (182,105)
Number of families with income $125k - 150k:
Millers Falls:
6.9% (18)
Massachusetts:
9.3% (159,566)
Number of families with income > $200k:
Millers Falls:
5.6% (14)
State:
25.4% (438,378)
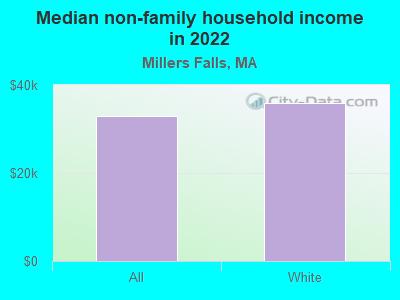
Median non-family income in Millers Falls in 2022:
Millers Falls:
$33,033
Massachusetts:
$55,979
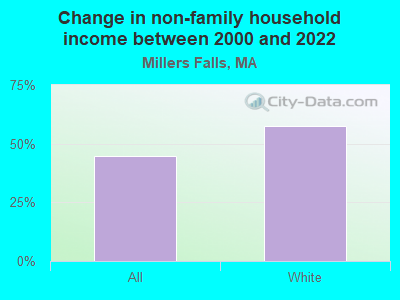
Change in median non-family income between 2000 and 2022:
Millers Falls, Massachusetts:
+44.6%
Massachusetts:
+88.0%
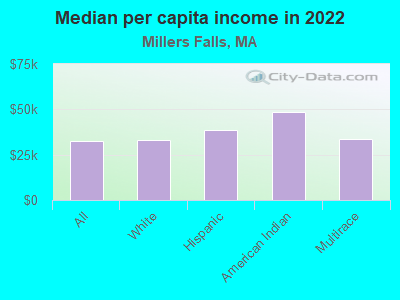
Median per capita income in Millers Falls in 2022:
Millers Falls:
$32,612
State:
$54,025
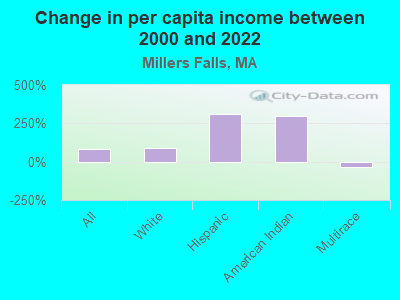
Change in median per capita income between 2000 and 2022:
Millers Falls, Massachusetts:
+83.5%
State:
+108.2%
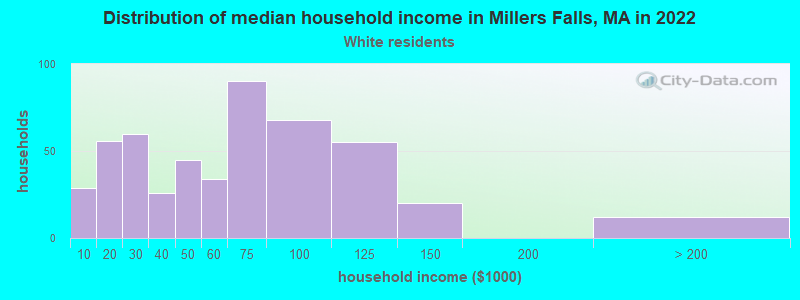
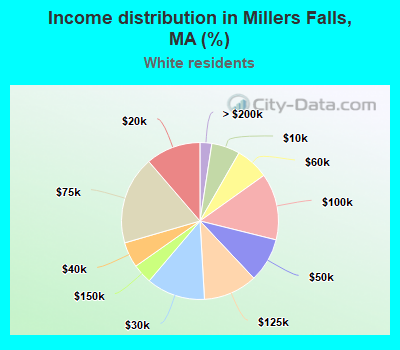
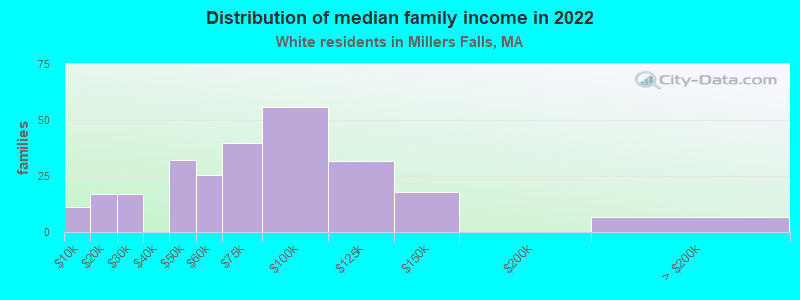
Income statistics for White residents
Median household income in Millers Falls, MA in 2022:
Millers Falls:
$61,483
State:
$101,391
Change in median household income between 2000 and 2022:
Millers Falls, Massachusetts:
+65.2%
Massachusetts:
+93.3%
Number of households with income < $10k:
Millers Falls:
5.9% (29)
State:
4.4% (91,120)
Number of households with income $10k - 20k:
Millers Falls:
11.3% (56)
State:
5.9% (122,055)
Number of households with income $20k - 30k:
Millers Falls:
12.1% (60)
State:
5.1% (105,311)
Number of households with income $30k - 40k:
Millers Falls:
5.3% (26)
State:
5.3% (110,239)
Number of households with income $40k - 50k:
Millers Falls:
9.1% (45)
State:
5.0% (104,636)
Number of households with income $50k - 60k:
Millers Falls:
6.9% (34)
State:
4.8% (99,486)
Number of households with income $60k - 75k:
Millers Falls:
18.2% (90)
Massachusetts:
7.5% (155,124)
Number of households with income $75k - 100k:
Millers Falls:
13.7% (68)
State:
11.4% (236,252)
Number of households with income $100k - 125k:
Millers Falls:
11.1% (55)
Massachusetts:
9.9% (204,731)
Number of households with income $125k - 150k:
Millers Falls:
4.0% (20)
State:
8.5% (175,324)
Number of households with income $150k - 200k:
Millers Falls:
0.0% (0)
State:
11.7% (242,980)
Number of households with income > $200k:
Millers Falls:
2.4% (12)
State:
20.5% (425,966)
Aggregate household income in Millers Falls in 2022: $34,390,729
Median family income in Millers Falls in 2022:
Millers Falls:
$63,414
State:
$133,153
Number of families with income < $10k:
Millers Falls:
4.3% (11)
State:
2.0% (25,038)
Number of families with income $10k - 20k:
Millers Falls:
6.7% (17)
Massachusetts:
2.1% (26,403)
Number of families with income $20k - 30k:
Millers Falls:
6.7% (17)
Massachusetts:
2.6% (32,525)
Number of families with income $40k - 50k:
Millers Falls:
12.6% (32)
State:
3.8% (46,908)
Number of families with income $50k - 60k:
Millers Falls:
9.9% (25)
Massachusetts:
3.8% (46,476)
Number of families with income $60k - 75k:
Millers Falls:
15.6% (40)
Massachusetts:
6.4% (79,040)
Number of families with income $75k - 100k:
Millers Falls:
22.0% (56)
Massachusetts:
11.1% (137,395)
Number of families with income $100k - 125k:
Millers Falls:
12.4% (32)
State:
11.1% (136,771)
Number of families with income $125k - 150k:
Millers Falls:
7.1% (18)
Massachusetts:
10.0% (123,709)
Number of families with income > $200k:
Millers Falls:
2.7% (7)
State:
28.5% (351,887)
Median non-family income in Millers Falls in 2022:
Millers Falls:
$35,873
State:
$59,323
Change in median non-family income between 2000 and 2022:
Millers Falls, Massachusetts:
+57.5%
Massachusetts:
+94.3%
Median per capita income in Millers Falls in 2022:
Millers Falls:
$32,839
Massachusetts:
$60,804
Change in median per capita income between 2000 and 2022:
Millers Falls, Massachusetts:
+87.9%
State:
+118.7%
Income statistics for Hispanic or Latino residents
Aggregate household income in Millers Falls in 2022: $2,374,330
Median per capita income in Millers Falls in 2022:
Millers Falls:
$38,687
Massachusetts:
$28,993
Income statistics for American Indian and Alaska Native residents
Aggregate household income in Millers Falls in 2022: $690,544
Median per capita income in Millers Falls in 2022:
Millers Falls:
$48,404
State:
$39,434
Income statistics for Multirace residents
Aggregate household income in Millers Falls in 2022: $1,085,560
Median per capita income in Millers Falls in 2022:
Millers Falls:
$33,550
State:
$34,029
Change in median per capita income between 2000 and 2022:: -36.3%
Millers Falls, Massachusetts:
-36.3%
State:
+132.1%
Discuss Millers Falls, Massachusetts (MA) on our hugely popular Massachusetts forum.