Morgan Farm Area, Texas (TX) income map, earnings map, and wages data
The median household income in Morgan Farm Area, TX in 2022 was $90,134, which was 19.8% greater than the median annual income of $72,284 across the entire state of Texas. Compared to the median income of $48,500 in 2000 this represents an increase of 46.2%. The per capita income in 2022 was $24,437, which means an increase of 45.0% compared to 2000 when it was $13,443.
Income statistics for all residents
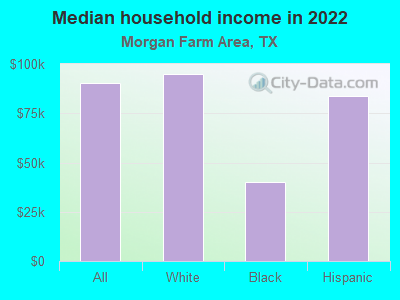
Median household income in Morgan Farm Area, TX in 2022:| Morgan Farm Area: | $90,135 |
| State: | $72,284 |
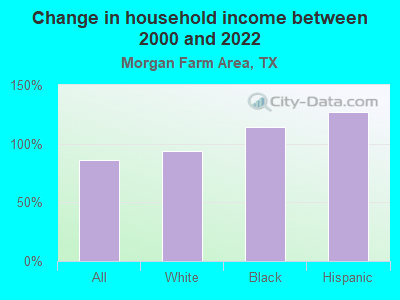
Change in median household income between 2000 and 2022:| Morgan Farm Area, Texas: | +85.8% |
| Texas: | +81.0% |
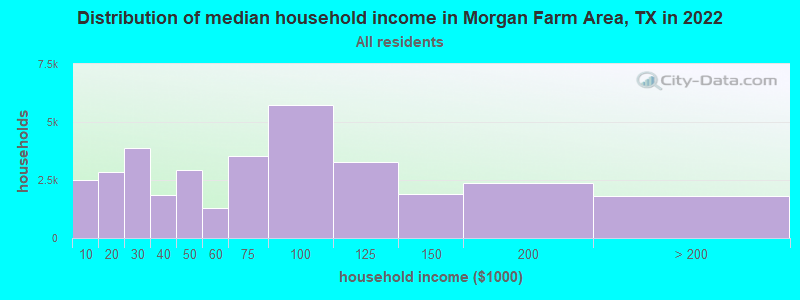
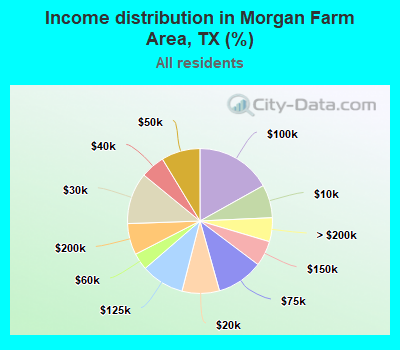
Number of households with income < $10k:| Morgan Farm Area: | 7.4% (2,509) |
| Texas: | 5.5% (611,011) |
Number of households with income $10k - 20k:| Morgan Farm Area: | 8.3% (2,833) |
| State: | 6.7% (743,157) |
Number of households with income $20k - 30k:| Morgan Farm Area: | 11.5% (3,900) |
| Texas: | 7.2% (803,381) |
Number of households with income $30k - 40k:| Morgan Farm Area: | 5.4% (1,836) |
| Texas: | 7.8% (866,080) |
Number of households with income $40k - 50k:| Morgan Farm Area: | 8.7% (2,940) |
| State: | 7.3% (810,440) |
Number of households with income $50k - 60k:| Morgan Farm Area: | 3.8% (1,277) |
| State: | 7.2% (799,783) |
Number of households with income $60k - 75k:| Morgan Farm Area: | 10.4% (3,533) |
| Texas: | 9.9% (1,095,384) |
Number of households with income $75k - 100k:| Morgan Farm Area: | 16.9% (5,733) |
| Texas: | 12.8% (1,419,057) |
Number of households with income $100k - 125k:| Morgan Farm Area: | 9.6% (3,273) |
| State: | 9.5% (1,054,577) |
Number of households with income $125k - 150k:| Morgan Farm Area: | 5.6% (1,917) |
| Texas: | 6.7% (741,518) |
Number of households with income $150k - 200k:| Morgan Farm Area: | 7.0% (2,379) |
| State: | 8.7% (961,776) |
Number of households with income > $200k:| Morgan Farm Area: | 5.3% (1,806) |
| State: | 10.7% (1,181,544) |
Aggregate household income in Morgan Farm Area in 2022: $13,171,075
Median family income in Morgan Farm Area in 2022:| Morgan Farm Area: | $63,603 |
| State: | $86,267 |
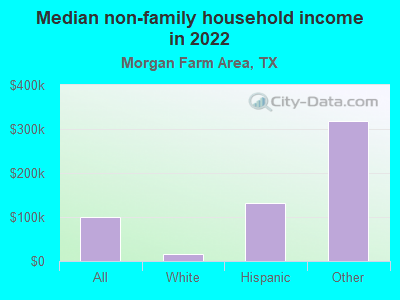
Median non-family income in Morgan Farm Area in 2022:| Morgan Farm Area: | $99,097 |
| Texas: | $45,999 |
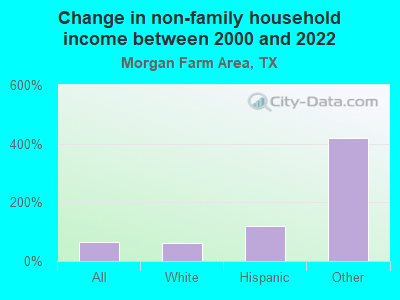
Change in median non-family income between 2000 and 2022:| Morgan Farm Area, Texas: | +64.9% |
| State: | +79.5% |
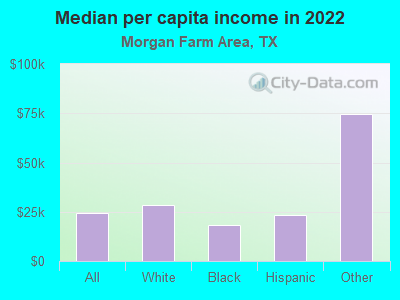
Median per capita income in Morgan Farm Area in 2022:| Morgan Farm Area: | $24,438 |
| Texas: | $38,123 |
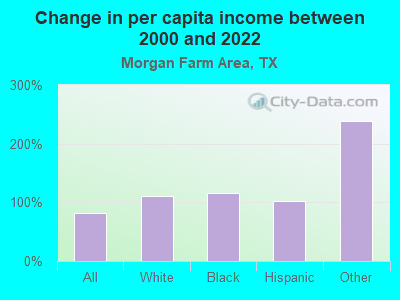
Change in median per capita income between 2000 and 2022:| Morgan Farm Area, Texas: | +81.8% |
| State: | +94.3% |
Income statistics for White residents
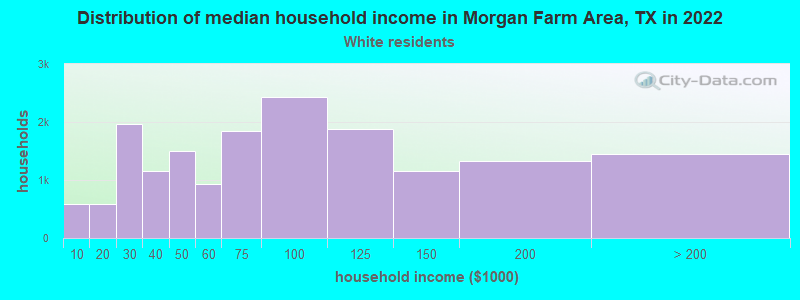
Median household income in Morgan Farm Area, TX in 2022:| Morgan Farm Area: | $94,775 |
| State: | $82,032 |
Change in median household income between 2000 and 2022:| Morgan Farm Area, Texas: | +94.4% |
| Texas: | +91.0% |
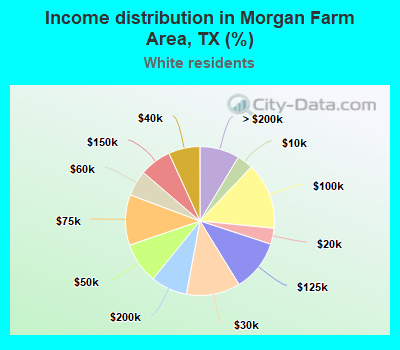
Number of households with income < $10k:| Morgan Farm Area: | 3.5% (583) |
| Texas: | 4.7% (273,716) |
Number of households with income $10k - 20k:| Morgan Farm Area: | 3.5% (582) |
| State: | 5.5% (322,702) |
Number of households with income $20k - 30k:| Morgan Farm Area: | 11.7% (1,964) |
| Texas: | 6.2% (363,947) |
Number of households with income $30k - 40k:| Morgan Farm Area: | 6.8% (1,147) |
| State: | 6.8% (399,275) |
Number of households with income $40k - 50k:| Morgan Farm Area: | 8.9% (1,492) |
| State: | 6.5% (383,417) |
Number of households with income $50k - 60k:| Morgan Farm Area: | 5.6% (931) |
| State: | 6.6% (388,535) |
Number of households with income $60k - 75k:| Morgan Farm Area: | 11.0% (1,840) |
| State: | 9.7% (566,295) |
Number of households with income $75k - 100k:| Morgan Farm Area: | 14.5% (2,429) |
| State: | 13.0% (760,276) |
Number of households with income $100k - 125k:| Morgan Farm Area: | 11.2% (1,876) |
| State: | 10.2% (597,596) |
Number of households with income $125k - 150k:| Morgan Farm Area: | 6.9% (1,155) |
| Texas: | 7.4% (436,830) |
Number of households with income $150k - 200k:| Morgan Farm Area: | 7.9% (1,327) |
| State: | 9.9% (583,067) |
Number of households with income > $200k:| Morgan Farm Area: | 8.6% (1,446) |
| State: | 13.5% (792,647) |
Aggregate household income in Morgan Farm Area in 2022: $7,747,169
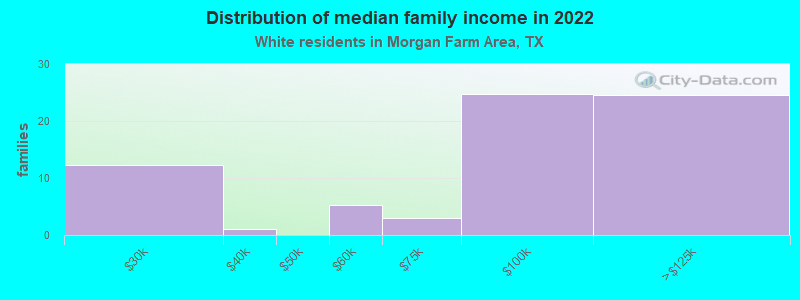
Median family income in Morgan Farm Area in 2022:| Morgan Farm Area: | $98,894 |
| State: | $101,788 |
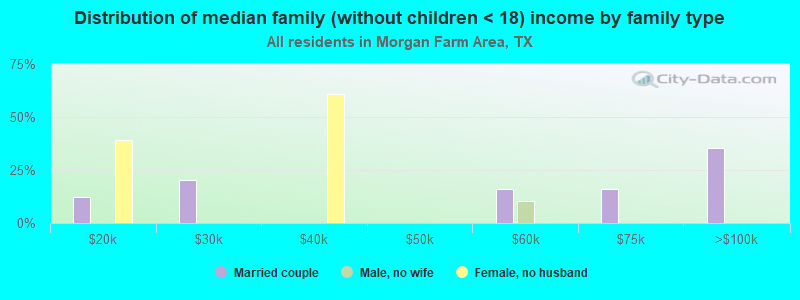
Number of families with income $20k - 30k:| Morgan Farm Area: | 17.2% (12) |
| Texas: | 4.1% (157,688) |
Number of families with income $30k - 40k:| Morgan Farm Area: | 1.5% (1) |
| State: | 5.2% (198,847) |
Number of families with income $50k - 60k:| Morgan Farm Area: | 7.5% (5) |
| State: | 5.7% (220,689) |
Number of families with income $60k - 75k:| Morgan Farm Area: | 4.3% (3) |
| Texas: | 9.0% (346,106) |
Number of families with income $75k - 100k:| Morgan Farm Area: | 35.0% (25) |
| State: | 13.7% (527,363) |
Number of families with income $100k - 125k:| Morgan Farm Area: | 34.5% (24) |
| State: | 11.6% (448,411) |
Median non-family income in Morgan Farm Area in 2022:| Morgan Farm Area: | $15,762 |
| State: | $50,587 |
Change in median non-family income between 2000 and 2022:| Morgan Farm Area, Texas: | +63.5% |
| State: | +87.7% |
Median per capita income in Morgan Farm Area in 2022:| Morgan Farm Area: | $28,220 |
| Texas: | $47,740 |
Change in median per capita income between 2000 and 2022:| Morgan Farm Area, Texas: | +111.5% |
| State: | +114.3% |
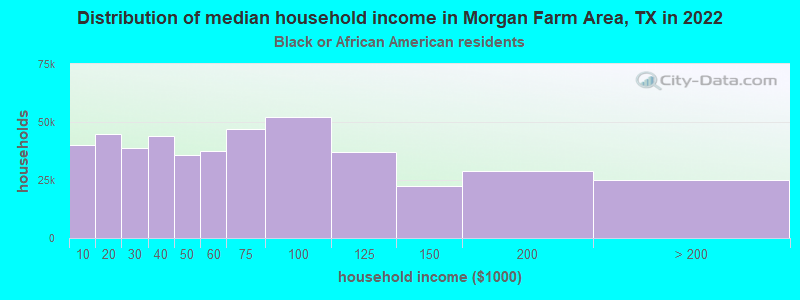
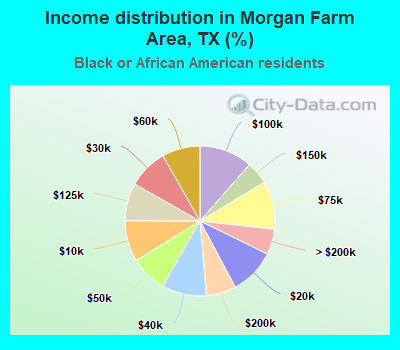
Income statistics for Black or African American residents
Median household income in Morgan Farm Area, TX in 2022:| Morgan Farm Area: | $40,039 |
| State: | $55,759 |
Change in median household income between 2000 and 2022:| Morgan Farm Area, Texas: | +113.5% |
| State: | +90.3% |
Number of households with income < $10k:| Morgan Farm Area: | 8.9% (40,282) |
| State: | 8.9% (126,378) |
Number of households with income $10k - 20k:| Morgan Farm Area: | 9.9% (45,035) |
| State: | 9.9% (140,369) |
Number of households with income $20k - 30k:| Morgan Farm Area: | 8.5% (38,745) |
| State: | 8.5% (120,639) |
Number of households with income $30k - 40k:| Morgan Farm Area: | 9.7% (43,806) |
| State: | 9.7% (137,517) |
Number of households with income $40k - 50k:| Morgan Farm Area: | 7.9% (35,987) |
| Texas: | 8.0% (112,973) |
Number of households with income $50k - 60k:| Morgan Farm Area: | 8.2% (37,290) |
| State: | 8.3% (117,156) |
Number of households with income $60k - 75k:| Morgan Farm Area: | 10.4% (47,073) |
| State: | 10.4% (147,462) |
Number of households with income $75k - 100k:| Morgan Farm Area: | 11.5% (51,976) |
| State: | 11.5% (162,718) |
Number of households with income $100k - 125k:| Morgan Farm Area: | 8.1% (36,903) |
| State: | 8.2% (115,829) |
Number of households with income $125k - 150k:| Morgan Farm Area: | 4.9% (22,363) |
| Texas: | 4.9% (69,556) |
Number of households with income $150k - 200k:| Morgan Farm Area: | 6.4% (28,964) |
| State: | 6.4% (90,701) |
Number of households with income > $200k:| Morgan Farm Area: | 5.5% (24,883) |
| State: | 5.5% (77,988) |
Aggregate household income in Morgan Farm Area in 2022: $1,945,404
Median per capita income in Morgan Farm Area in 2022:| Morgan Farm Area: | $18,412 |
| State: | $30,490 |
Change in median per capita income between 2000 and 2022:| Morgan Farm Area, Texas: | +116.3% |
| Texas: | +113.9% |
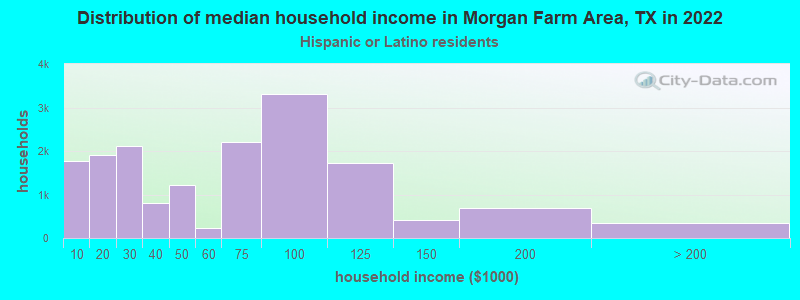
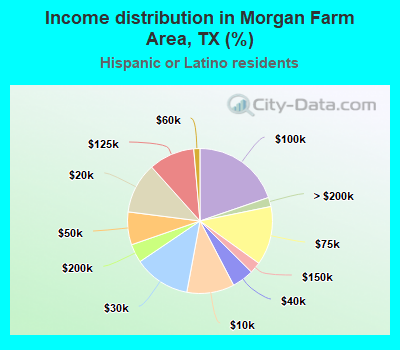
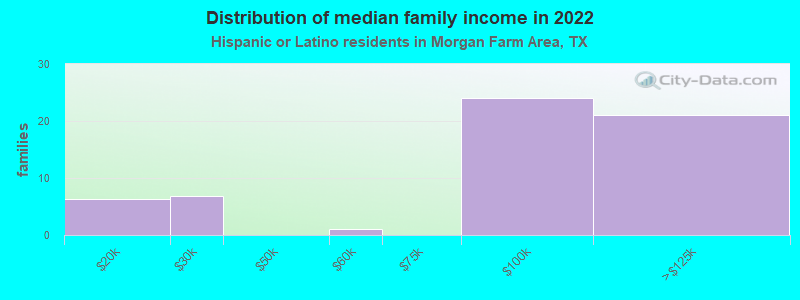
Income statistics for Hispanic or Latino residents
Median household income in Morgan Farm Area, TX in 2022:| Morgan Farm Area: | $83,781 |
| Texas: | $60,504 |
Change in median household income between 2000 and 2022:| Morgan Farm Area, Texas: | +127.2% |
| Texas: | +102.5% |
Number of households with income < $10k:| Morgan Farm Area: | 10.6% (1,779) |
| State: | 5.8% (213,953) |
Number of households with income $10k - 20k:| Morgan Farm Area: | 11.4% (1,904) |
| Texas: | 8.0% (297,456) |
Number of households with income $20k - 30k:| Morgan Farm Area: | 12.6% (2,114) |
| State: | 9.2% (340,166) |
Number of households with income $30k - 40k:| Morgan Farm Area: | 4.9% (816) |
| State: | 9.5% (354,336) |
Number of households with income $40k - 50k:| Morgan Farm Area: | 7.3% (1,229) |
| State: | 8.8% (327,013) |
Number of households with income $50k - 60k:| Morgan Farm Area: | 1.4% (230) |
| State: | 8.3% (308,818) |
Number of households with income $60k - 75k:| Morgan Farm Area: | 13.1% (2,202) |
| State: | 10.9% (405,109) |
Number of households with income $75k - 100k:| Morgan Farm Area: | 19.8% (3,313) |
| State: | 13.8% (511,639) |
Number of households with income $100k - 125k:| Morgan Farm Area: | 10.3% (1,719) |
| State: | 8.6% (319,728) |
Number of households with income $125k - 150k:| Morgan Farm Area: | 2.5% (424) |
| State: | 5.7% (210,932) |
Number of households with income $150k - 200k:| Morgan Farm Area: | 4.2% (697) |
| Texas: | 6.4% (236,055) |
Number of households with income > $200k:| Morgan Farm Area: | 2.0% (343) |
| State: | 5.1% (189,259) |
Aggregate household income in Morgan Farm Area in 2022: $8,779,427
Median family income in Morgan Farm Area in 2022:| Morgan Farm Area: | $48,428 |
| State: | $65,080 |
Number of families with income $10k - 20k:| Morgan Farm Area: | 10.5% (6) |
| Texas: | 6.3% (174,531) |
Number of families with income $20k - 30k:| Morgan Farm Area: | 11.6% (7) |
| State: | 8.6% (238,528) |
Number of families with income $50k - 60k:| Morgan Farm Area: | 1.9% (1) |
| Texas: | 8.0% (223,566) |
Number of families with income $75k - 100k:| Morgan Farm Area: | 40.5% (24) |
| State: | 14.3% (398,554) |
Number of families with income $100k - 125k:| Morgan Farm Area: | 35.5% (21) |
| State: | 9.5% (264,007) |
Median non-family income in Morgan Farm Area in 2022:| Morgan Farm Area: | $132,701 |
| Texas: | $39,934 |
Change in median non-family income between 2000 and 2022:| Morgan Farm Area, Texas: | +120.8% |
| State: | +109.1% |
Median per capita income in Morgan Farm Area in 2022:| Morgan Farm Area: | $23,151 |
| Texas: | $24,862 |
Change in median per capita income between 2000 and 2022:| Morgan Farm Area, Texas: | +102.5% |
| State: | +130.8% |
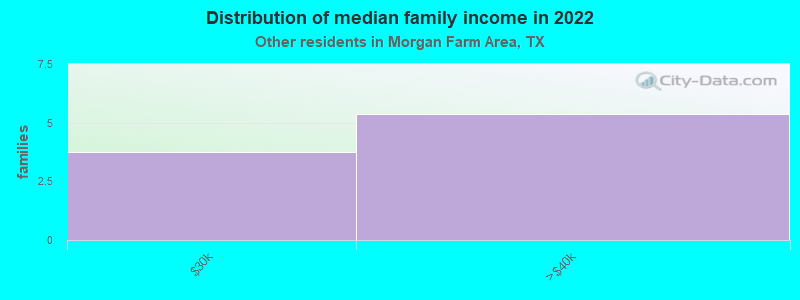
Income statistics for other residents
Number of households with income < $10k:| Morgan Farm Area: | 5.8% (14) |
| State: | 5.9% (54,162) |
Number of households with income $10k - 20k:| Morgan Farm Area: | 6.6% (16) |
| State: | 6.8% (62,891) |
Number of households with income $20k - 30k:| Morgan Farm Area: | 10.7% (26) |
| State: | 10.6% (97,294) |
Number of households with income $30k - 40k:| Morgan Farm Area: | 10.7% (26) |
| Texas: | 10.8% (99,670) |
Number of households with income $40k - 50k:| Morgan Farm Area: | 9.5% (23) |
| Texas: | 9.3% (85,548) |
Number of households with income $50k - 60k:| Morgan Farm Area: | 9.1% (22) |
| State: | 9.0% (82,757) |
Number of households with income $60k - 75k:| Morgan Farm Area: | 10.7% (26) |
| State: | 10.9% (100,326) |
Number of households with income $75k - 100k:| Morgan Farm Area: | 14.0% (34) |
| State: | 14.0% (128,767) |
Number of households with income $100k - 125k:| Morgan Farm Area: | 8.3% (20) |
| Texas: | 8.2% (75,218) |
Number of households with income $125k - 150k:| Morgan Farm Area: | 5.0% (12) |
| State: | 4.8% (44,223) |
Number of households with income $150k - 200k:| Morgan Farm Area: | 5.4% (13) |
| State: | 5.6% (51,376) |
Number of households with income > $200k:| Morgan Farm Area: | 4.1% (10) |
| State: | 4.0% (36,393) |
Aggregate household income in Morgan Farm Area in 2022: $1,701,832
Median family income in Morgan Farm Area in 2022:| Morgan Farm Area: | $63,703 |
| Texas: | $60,064 |
Median non-family income in Morgan Farm Area in 2022:| Morgan Farm Area: | $318,918 |
| Texas: | $38,690 |
Median per capita income in Morgan Farm Area in 2022:| Morgan Farm Area: | $74,443 |
| State: | $23,899 |