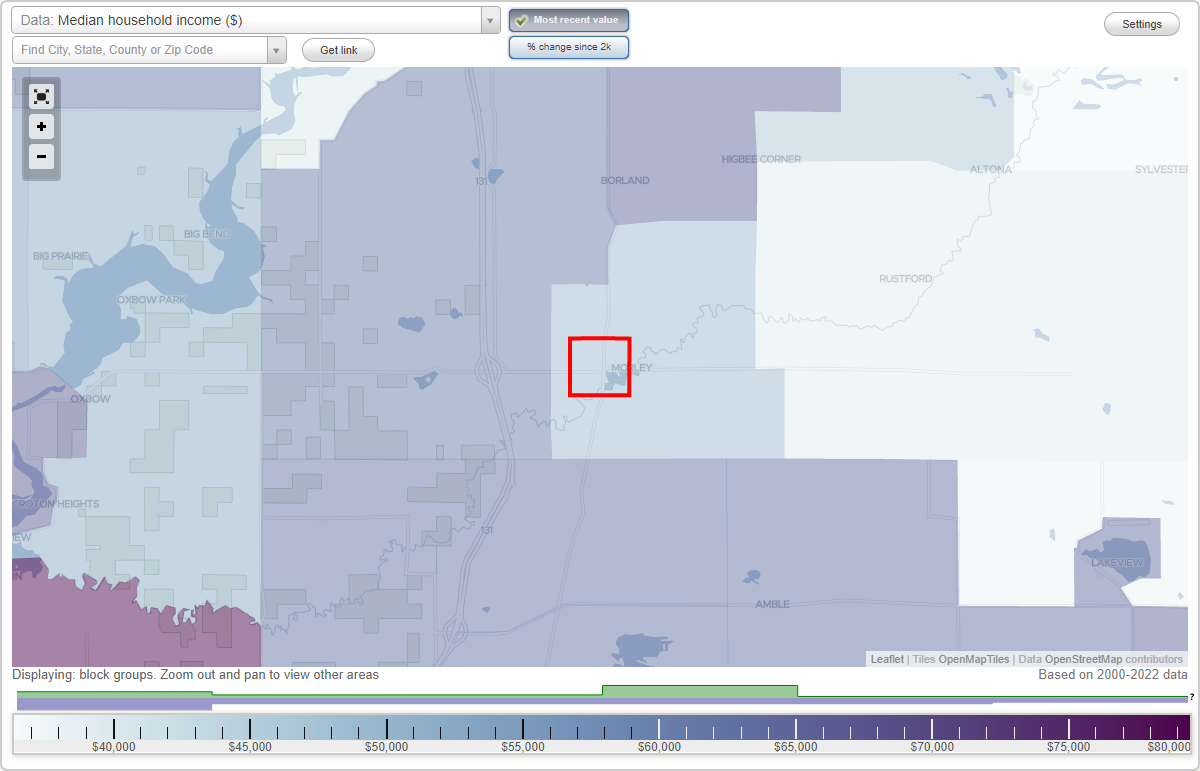
The median household income in Morley, MI in 2022 was $33,001, which was 103.0% less than the median annual income of $66,986 across the entire state of Michigan. Compared to the median income of $31,442 in 2000 this represents an increase of 4.7%. The per capita income in 2022 was $19,910, which means an increase of 41.6% compared to 2000 when it was $11,634.
Whole page based on the data from 2000 / 2022 when the population of Morley, Michigan was 495 / 647
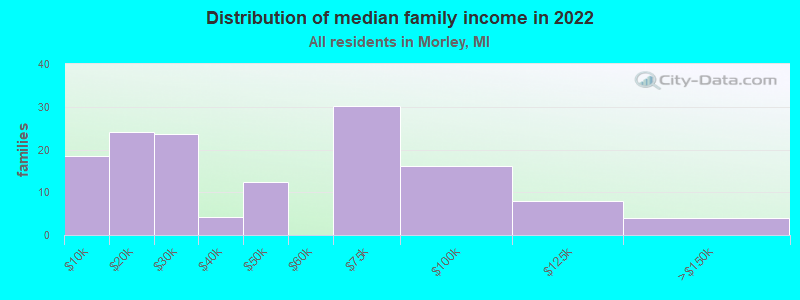
Income statistics for all residents
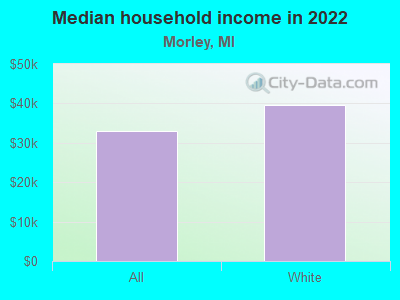
Median household income in Morley, MI in 2022:
Morley:
$33,002
State:
$66,986
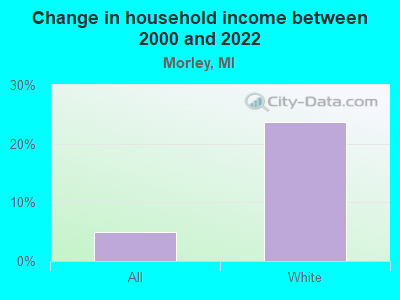
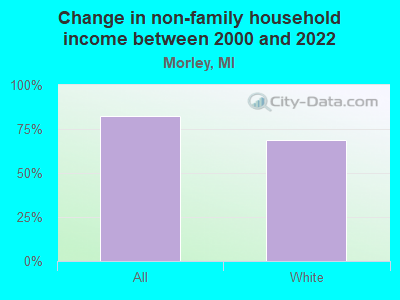
Change in median household income between 2000 and 2022:
Morley, Michigan:
+5.0%
State:
+50.0%
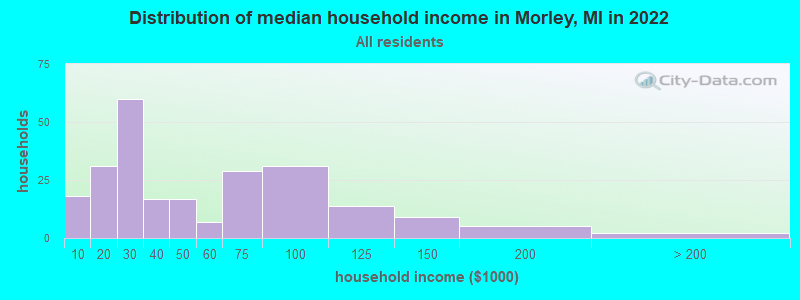
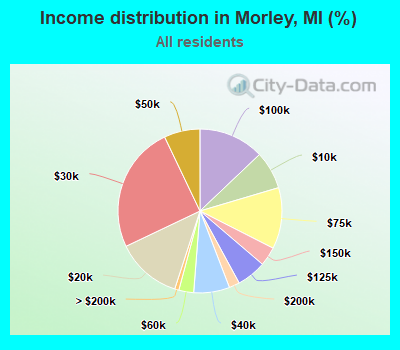
Number of households with income < $10k:
Morley:
7.5% (18)
Michigan:
5.7% (231,223)
Number of households with income $10k - 20k:
Morley:
12.9% (31)
State:
7.5% (306,955)
Number of households with income $20k - 30k:
Morley:
25.0% (60)
Michigan:
7.9% (324,153)
Number of households with income $30k - 40k:
Morley:
7.1% (17)
State:
8.3% (341,408)
Number of households with income $40k - 50k:
Morley:
7.1% (17)
State:
7.9% (322,255)
Number of households with income $50k - 60k:
Morley:
2.9% (7)
State:
7.5% (305,914)
Number of households with income $60k - 75k:
Morley:
12.1% (29)
State:
10.1% (414,440)
Number of households with income $75k - 100k:
Morley:
12.9% (31)
Michigan:
13.2% (538,299)
Number of households with income $100k - 125k:
Morley:
5.8% (14)
Michigan:
9.7% (396,282)
Number of households with income $125k - 150k:
Morley:
3.8% (9)
State:
6.7% (273,144)
Number of households with income $150k - 200k:
Morley:
2.1% (5)
Michigan:
7.5% (305,077)
Number of households with income > $200k:
Morley:
0.8% (2)
State:
8.1% (330,644)
Aggregate household income in Morley in 2022: $12,885,579
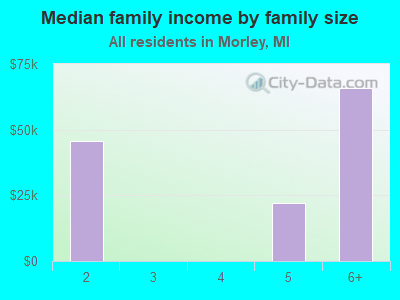
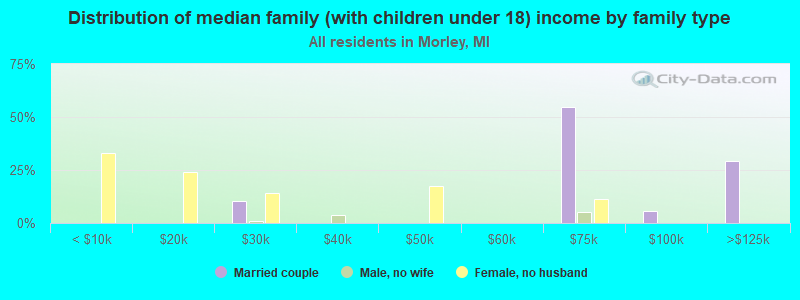
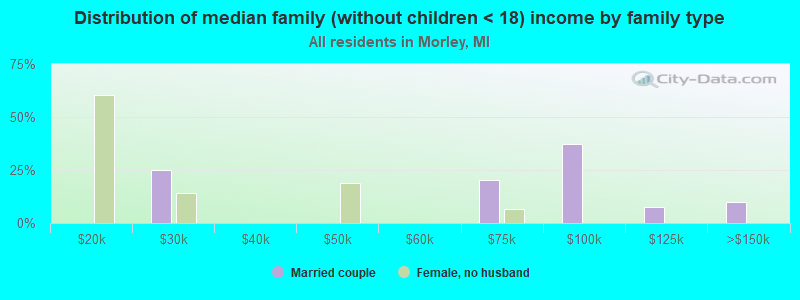
Median family income in Morley in 2022:
Morley:
$44,547
State:
$85,865
Number of families with income < $10k:
Morley:
13.1% (18)
State:
3.5% (89,010)
Number of families with income $10k - 20k:
Morley:
17.0% (24)
Michigan:
3.9% (100,567)
Number of families with income $20k - 30k:
Morley:
16.7% (24)
State:
5.0% (127,320)
Number of families with income $30k - 40k:
Morley:
3.0% (4)
Michigan:
6.4% (163,565)
Number of families with income $40k - 50k:
Morley:
8.8% (12)
State:
6.8% (172,384)
Number of families with income $60k - 75k:
Morley:
21.5% (30)
Michigan:
10.3% (263,723)
Number of families with income $75k - 100k:
Morley:
11.4% (16)
Michigan:
15.0% (383,364)
Number of families with income $100k - 125k:
Morley:
5.6% (8)
State:
11.8% (301,751)
Number of families with income $125k - 150k:
Morley:
2.8% (4)
State:
8.6% (220,338)
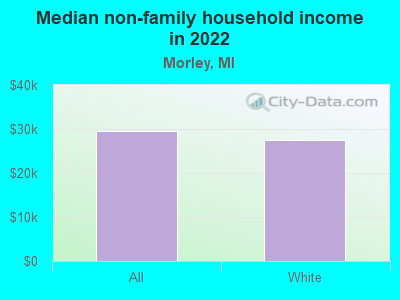
Median non-family income in Morley in 2022:
Morley:
$29,641
State:
$40,459
Change in median non-family income between 2000 and 2022:
Morley, Michigan:
+82.4%
State:
+54.5%
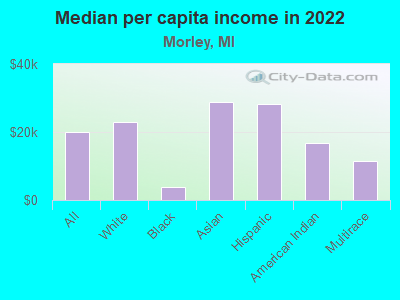
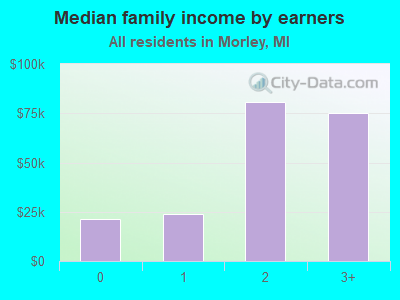
Median per capita income in Morley in 2022:
Morley:
$19,911
Michigan:
$38,151
Change in median per capita income between 2000 and 2022:
Morley, Michigan:
+71.1%
State:
+72.1%
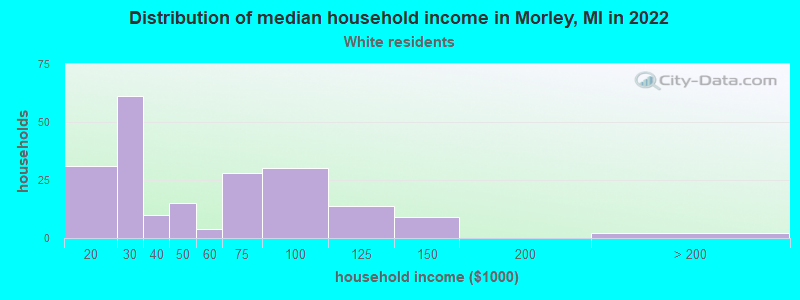
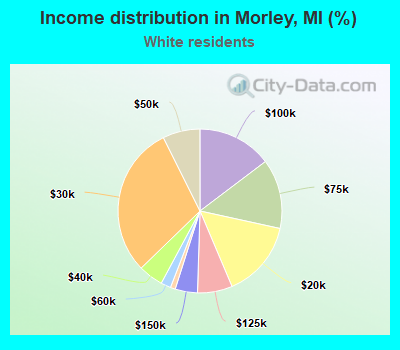
Income statistics for White residents
Median household income in Morley, MI in 2022:
Morley:
$39,626
Michigan:
$71,609
Change in median household income between 2000 and 2022:
Morley, Michigan:
+23.7%
State:
+52.9%
Number of households with income < $10k:
Morley:
0.0% (0)
Michigan:
4.4% (140,440)
Number of households with income $10k - 20k:
Morley:
15.2% (31)
State:
6.5% (205,547)
Number of households with income $20k - 30k:
Morley:
29.9% (61)
Michigan:
7.6% (242,254)
Number of households with income $30k - 40k:
Morley:
4.9% (10)
Michigan:
8.1% (257,175)
Number of households with income $40k - 50k:
Morley:
7.4% (15)
State:
7.8% (246,839)
Number of households with income $50k - 60k:
Morley:
2.0% (4)
State:
7.4% (233,723)
Number of households with income $60k - 75k:
Morley:
13.7% (28)
State:
10.4% (328,664)
Number of households with income $75k - 100k:
Morley:
14.7% (30)
State:
13.6% (431,867)
Number of households with income $100k - 125k:
Morley:
6.9% (14)
Michigan:
10.3% (325,164)
Number of households with income $125k - 150k:
Morley:
4.4% (9)
State:
7.1% (226,232)
Number of households with income $150k - 200k:
Morley:
0.0% (0)
State:
8.1% (255,445)
Number of households with income > $200k:
Morley:
1.0% (2)
Michigan:
8.7% (276,727)
Aggregate household income in Morley in 2022: $11,226,230
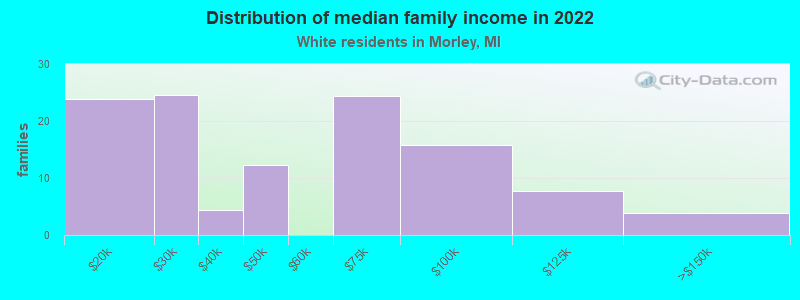
Median family income in Morley in 2022:
Morley:
$45,784
State:
$90,317
Number of families with income $10k - 20k:
Morley:
20.5% (24)
Michigan:
3.2% (64,106)
Number of families with income $20k - 30k:
Morley:
21.0% (25)
Michigan:
4.6% (91,551)
Number of families with income $30k - 40k:
Morley:
3.7% (4)
State:
5.9% (117,356)
Number of families with income $40k - 50k:
Morley:
10.5% (12)
State:
6.4% (127,491)
Number of families with income $60k - 75k:
Morley:
20.9% (24)
State:
10.5% (209,130)
Number of families with income $75k - 100k:
Morley:
13.5% (16)
State:
15.5% (309,815)
Number of families with income $100k - 125k:
Morley:
6.6% (8)
State:
12.4% (248,235)
Number of families with income $125k - 150k:
Morley:
3.3% (4)
State:
9.2% (182,895)
Median non-family income in Morley in 2022:
Morley:
$27,396
State:
$42,438
Change in median non-family income between 2000 and 2022:
Morley, Michigan:
+68.6%
Michigan:
+56.8%
Median per capita income in Morley in 2022:
Morley:
$22,809
Michigan:
$41,514
Change in median per capita income between 2000 and 2022:
Morley, Michigan:
+96.6%
State:
+75.2%
Income statistics for Black or African American residents
Number of households with income < $10k:
Morley:
100.0% (18)
State:
12.7% (66,307)
Number of households with income $10k - 20k:
Morley:
0.0% (0)
State:
14.2% (73,877)
Number of households with income $20k - 30k:
Morley:
0.0% (0)
State:
10.2% (52,930)
Number of households with income $30k - 40k:
Morley:
0.0% (0)
Michigan:
10.3% (53,542)
Number of households with income $40k - 50k:
Morley:
0.0% (0)
State:
9.1% (47,110)
Number of households with income $50k - 60k:
Morley:
0.0% (0)
Michigan:
8.1% (41,969)
Number of households with income $60k - 75k:
Morley:
0.0% (0)
Michigan:
9.0% (46,784)
Number of households with income $75k - 100k:
Morley:
0.0% (0)
State:
9.7% (50,718)
Number of households with income $100k - 125k:
Morley:
0.0% (0)
Michigan:
6.7% (34,802)
Number of households with income $125k - 150k:
Morley:
0.0% (0)
Michigan:
4.1% (21,083)
Number of households with income $150k - 200k:
Morley:
0.0% (0)
Michigan:
3.4% (17,885)
Number of households with income > $200k:
Morley:
0.0% (0)
State:
2.6% (13,430)
Median per capita income in Morley in 2022:
Morley:
$3,720
State:
$25,207
Income statistics for Asian residents
Median per capita income in Morley in 2022:
Morley:
$28,753
State:
$48,128
Change in median per capita income between 2000 and 2022:
Morley, Michigan:
+121.2%
Michigan:
+95.8%
Income statistics for Hispanic or Latino residents
Aggregate household income in Morley in 2022: $506,647
Median per capita income in Morley in 2022:
Morley:
$28,236
State:
$25,462
Change in median per capita income between 2000 and 2022:
Morley, Michigan:
+111.3%
Michigan:
+83.3%
Income statistics for American Indian and Alaska Native residents
Aggregate household income in Morley in 2022: $29,212
Median per capita income in Morley in 2022:
Morley:
$16,672
State:
$27,661
Change in median per capita income between 2000 and 2022:: -20.2%
Morley, Michigan:
-20.2%
State:
+75.7%
Income statistics for Multirace residents
Aggregate household income in Morley in 2022: $934,096
Median per capita income in Morley in 2022:
Morley:
$11,330
State:
$26,098
Change in median per capita income between 2000 and 2022:
Morley, Michigan:
+31.7%
State:
+106.5%
Discuss Morley, Michigan (MI) on our hugely popular Michigan forum.