Naneum, Washington (WA) income map, earnings map, and wages data
The median household income in Naneum, WA in 2022 was $104,678, which was 12.8% greater than the median annual income of $91,306 across the entire state of Washington. Compared to the median income of $53,447 in 2000 this represents an increase of 48.9%. The per capita income in 2022 was $57,698, which means an increase of 53.6% compared to 2000 when it was $26,744.
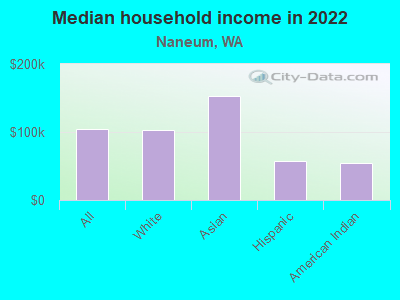
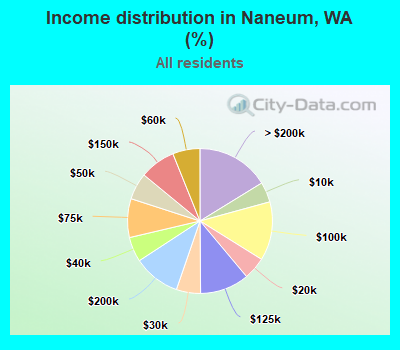
Income statistics for all residents
Median household income in Naneum, WA in 2022:| Naneum: | $104,679 |
| State: | $91,306 |
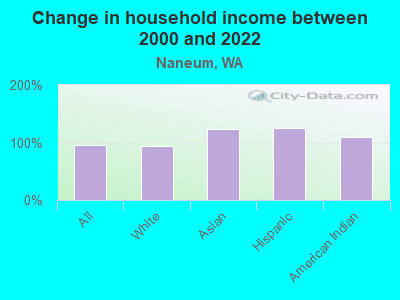
Change in median household income between 2000 and 2022:| Naneum, Washington: | +95.9% |
| Washington: | +99.5% |
Number of households with income < $10k:| Naneum: | 4.5% (81,328) |
| State: | 4.5% (139,331) |
Number of households with income $10k - 20k:| Naneum: | 5.0% (90,200) |
| State: | 5.0% (154,508) |
Number of households with income $20k - 30k:| Naneum: | 5.4% (97,234) |
| State: | 5.4% (166,555) |
Number of households with income $30k - 40k:| Naneum: | 5.5% (99,430) |
| State: | 5.5% (170,324) |
Number of households with income $40k - 50k:| Naneum: | 6.0% (107,385) |
| State: | 6.0% (183,941) |
Number of households with income $50k - 60k:| Naneum: | 6.1% (109,391) |
| State: | 6.1% (187,395) |
Number of households with income $60k - 75k:| Naneum: | 8.7% (155,727) |
| Washington: | 8.7% (266,771) |
Number of households with income $75k - 100k:| Naneum: | 13.1% (236,230) |
| Washington: | 13.1% (404,672) |
Number of households with income $100k - 125k:| Naneum: | 11.0% (197,260) |
| Washington: | 11.0% (337,911) |
Number of households with income $125k - 150k:| Naneum: | 8.0% (142,984) |
| Washington: | 8.0% (244,934) |
Number of households with income $150k - 200k:| Naneum: | 10.5% (189,029) |
| State: | 10.5% (323,812) |
Number of households with income > $200k:| Naneum: | 16.2% (291,723) |
| State: | 16.2% (499,799) |
Aggregate household income in Naneum in 2022: $7,425,779,252
Median family income in Naneum in 2022:| Naneum: | $109,926 |
| State: | $109,192 |
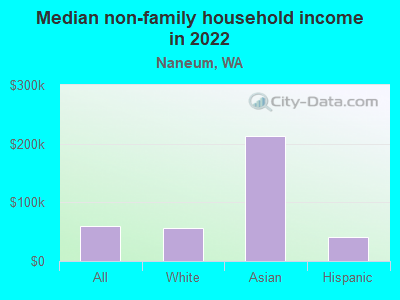
Median non-family income in Naneum in 2022:| Naneum: | $59,885 |
| Washington: | $57,299 |
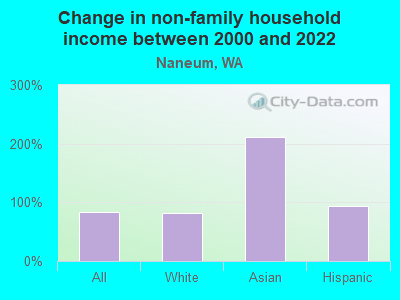
Change in median non-family income between 2000 and 2022:| Naneum, Washington: | +84.3% |
| Washington: | +94.9% |
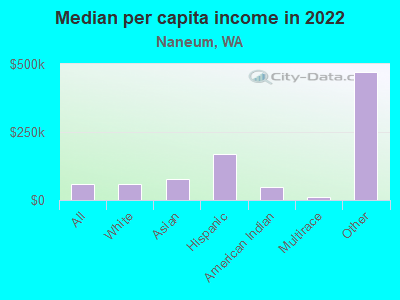
Median per capita income in Naneum in 2022:| Naneum: | $57,698 |
| Washington: | $50,764 |
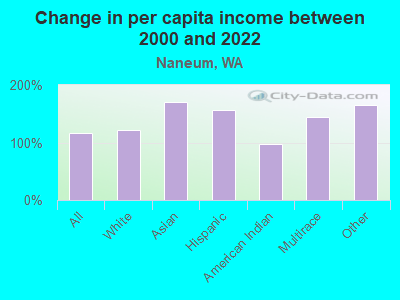
Change in median per capita income between 2000 and 2022:| Naneum, Washington: | +115.7% |
| State: | +121.0% |
Income statistics for White residents
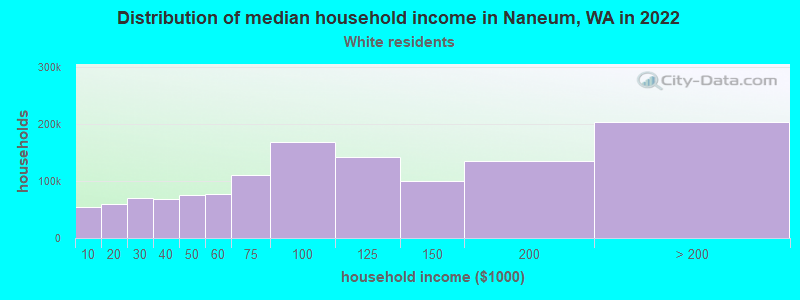
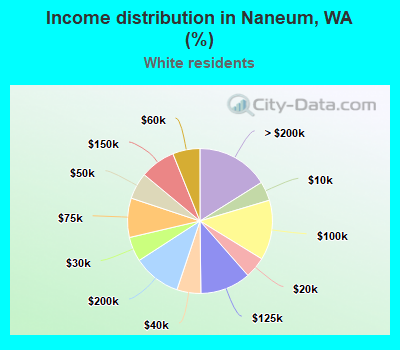
Median household income in Naneum, WA in 2022:| Naneum: | $103,358 |
| State: | $91,916 |
Change in median household income between 2000 and 2022:| Naneum, Washington: | +94.3% |
| Washington: | +95.4% |
Number of households with income < $10k:| Naneum: | 4.3% (54,166) |
| State: | 4.3% (95,850) |
Number of households with income $10k - 20k:| Naneum: | 4.8% (60,160) |
| Washington: | 4.8% (106,421) |
Number of households with income $20k - 30k:| Naneum: | 5.5% (69,453) |
| State: | 5.5% (122,860) |
Number of households with income $30k - 40k:| Naneum: | 5.4% (67,617) |
| Washington: | 5.4% (119,627) |
Number of households with income $40k - 50k:| Naneum: | 5.9% (74,780) |
| State: | 5.9% (132,276) |
Number of households with income $50k - 60k:| Naneum: | 6.1% (76,981) |
| State: | 6.1% (136,212) |
Number of households with income $60k - 75k:| Naneum: | 8.8% (110,825) |
| Washington: | 8.8% (196,086) |
Number of households with income $75k - 100k:| Naneum: | 13.4% (169,115) |
| State: | 13.4% (299,192) |
Number of households with income $100k - 125k:| Naneum: | 11.3% (142,557) |
| Washington: | 11.3% (252,209) |
Number of households with income $125k - 150k:| Naneum: | 7.9% (99,468) |
| Washington: | 7.9% (175,962) |
Number of households with income $150k - 200k:| Naneum: | 10.7% (135,187) |
| State: | 10.7% (239,156) |
Number of households with income > $200k:| Naneum: | 16.1% (203,375) |
| Washington: | 16.1% (359,917) |
Aggregate household income in Naneum in 2022: $5,214,599,580
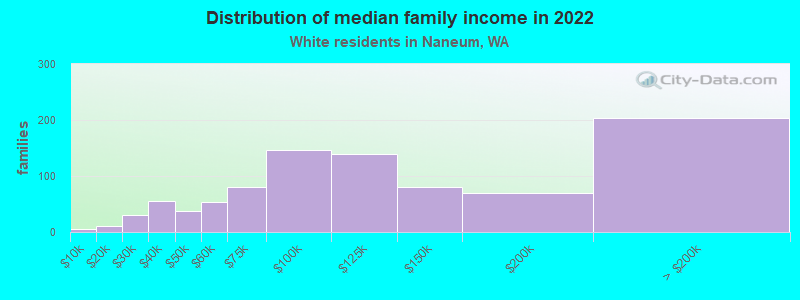
Median family income in Naneum in 2022:| Naneum: | $110,179 |
| Washington: | $112,511 |
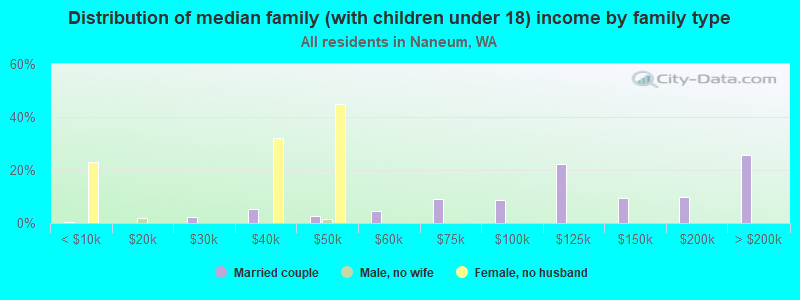
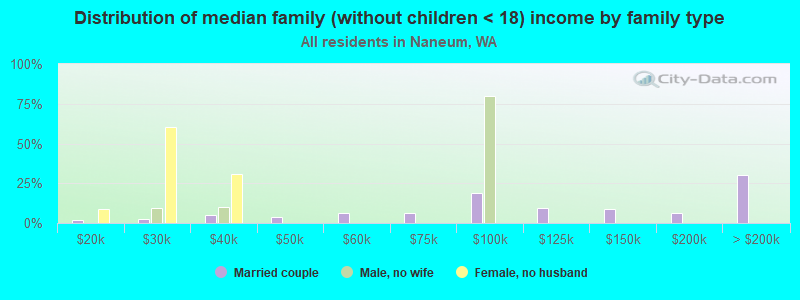
Number of families with income < $10k:| Naneum: | 0.5% (5) |
| State: | 2.4% (33,676) |
Number of families with income $10k - 20k:| Naneum: | 1.2% (11) |
| State: | 2.0% (28,228) |
Number of families with income $20k - 30k:| Naneum: | 3.4% (31) |
| State: | 2.9% (39,288) |
Number of families with income $30k - 40k:| Naneum: | 6.1% (56) |
| State: | 3.6% (50,190) |
Number of families with income $40k - 50k:| Naneum: | 4.1% (37) |
| State: | 4.6% (63,009) |
Number of families with income $50k - 60k:| Naneum: | 5.9% (53) |
| State: | 5.0% (69,270) |
Number of families with income $60k - 75k:| Naneum: | 8.8% (80) |
| State: | 8.2% (112,369) |
Number of families with income $75k - 100k:| Naneum: | 16.1% (147) |
| State: | 14.1% (194,214) |
Number of families with income $100k - 125k:| Naneum: | 15.2% (139) |
| State: | 13.2% (182,184) |
Number of families with income $125k - 150k:| Naneum: | 8.8% (80) |
| State: | 9.5% (130,928) |
Number of families with income $150k - 200k:| Naneum: | 7.6% (69) |
| State: | 13.7% (188,621) |
Number of families with income > $200k:| Naneum: | 22.3% (203) |
| Washington: | 20.8% (285,982) |
Median non-family income in Naneum in 2022:| Naneum: | $56,540 |
| State: | $56,103 |
Change in median non-family income between 2000 and 2022:| Naneum, Washington: | +82.0% |
| State: | +87.7% |
Median per capita income in Naneum in 2022:| Naneum: | $57,895 |
| Washington: | $55,212 |
Change in median per capita income between 2000 and 2022:| Naneum, Washington: | +121.9% |
| State: | +123.8% |
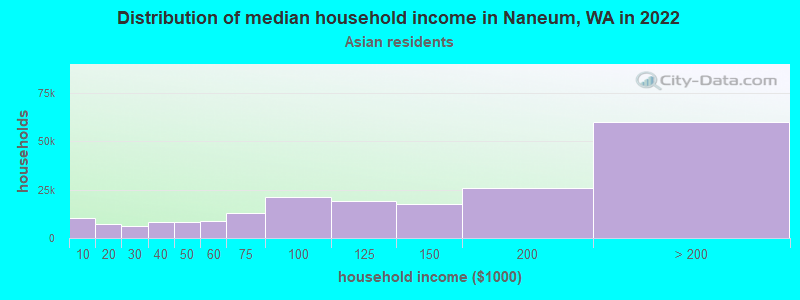
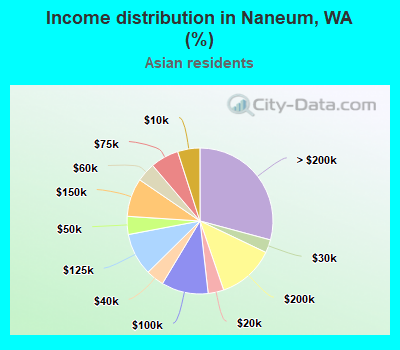
Income statistics for Asian residents
Median household income in Naneum, WA in 2022:| Naneum: | $152,942 |
| State: | $125,692 |
Change in median household income between 2000 and 2022:| Naneum, Washington: | +123.5% |
| State: | +164.5% |
Number of households with income < $10k:| Naneum: | 4.9% (10,140) |
| Washington: | 4.9% (14,099) |
Number of households with income $10k - 20k:| Naneum: | 3.5% (7,117) |
| State: | 3.5% (9,873) |
Number of households with income $20k - 30k:| Naneum: | 2.9% (6,003) |
| State: | 2.9% (8,352) |
Number of households with income $30k - 40k:| Naneum: | 4.0% (8,223) |
| State: | 4.0% (11,415) |
Number of households with income $40k - 50k:| Naneum: | 4.0% (8,230) |
| Washington: | 4.0% (11,421) |
Number of households with income $50k - 60k:| Naneum: | 4.2% (8,718) |
| Washington: | 4.2% (12,100) |
Number of households with income $60k - 75k:| Naneum: | 6.3% (12,893) |
| State: | 6.3% (17,903) |
Number of households with income $75k - 100k:| Naneum: | 10.4% (21,361) |
| Washington: | 10.4% (29,663) |
Number of households with income $100k - 125k:| Naneum: | 9.4% (19,329) |
| State: | 9.4% (26,839) |
Number of households with income $125k - 150k:| Naneum: | 8.5% (17,428) |
| State: | 8.5% (24,200) |
Number of households with income $150k - 200k:| Naneum: | 12.6% (25,960) |
| Washington: | 12.6% (35,976) |
Number of households with income > $200k:| Naneum: | 29.2% (59,905) |
| Washington: | 29.2% (83,109) |
Aggregate household income in Naneum in 2022: $7,536,909
Median family income in Naneum in 2022:| Naneum: | $5,316 |
| Washington: | $143,595 |
Median non-family income in Naneum in 2022:| Naneum: | $213,851 |
| State: | $84,971 |
Median per capita income in Naneum in 2022:| Naneum: | $78,311 |
| State: | $67,666 |
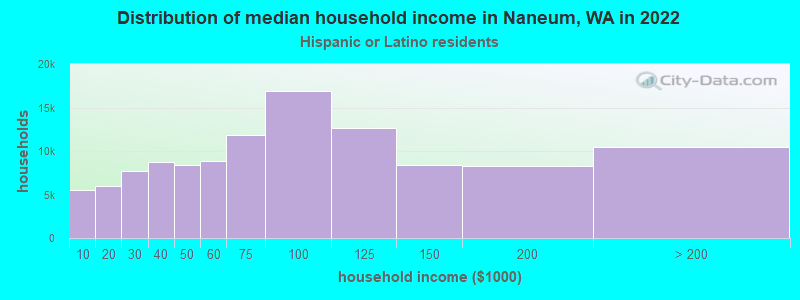
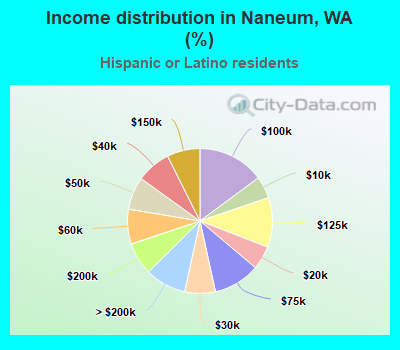
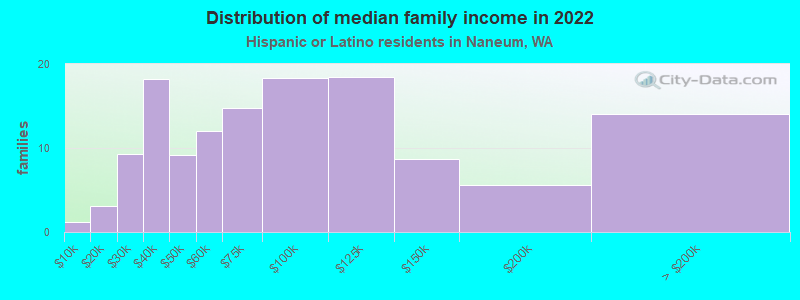
Income statistics for Hispanic or Latino residents
Median household income in Naneum, WA in 2022:| Naneum: | $57,174 |
| State: | $74,770 |
Change in median household income between 2000 and 2022:| Naneum, Washington: | +124.9% |
| State: | +128.3% |
Number of households with income < $10k:| Naneum: | 4.9% (5,570) |
| Washington: | 4.9% (14,456) |
Number of households with income $10k - 20k:| Naneum: | 5.3% (5,997) |
| State: | 5.3% (15,449) |
Number of households with income $20k - 30k:| Naneum: | 6.8% (7,758) |
| State: | 6.8% (20,016) |
Number of households with income $30k - 40k:| Naneum: | 7.7% (8,746) |
| Washington: | 7.7% (22,548) |
Number of households with income $40k - 50k:| Naneum: | 7.3% (8,339) |
| Washington: | 7.3% (21,450) |
Number of households with income $50k - 60k:| Naneum: | 7.7% (8,807) |
| State: | 7.7% (22,744) |
Number of households with income $60k - 75k:| Naneum: | 10.4% (11,875) |
| State: | 10.5% (30,737) |
Number of households with income $75k - 100k:| Naneum: | 14.9% (16,928) |
| Washington: | 14.9% (43,843) |
Number of households with income $100k - 125k:| Naneum: | 11.1% (12,626) |
| State: | 11.1% (32,554) |
Number of households with income $125k - 150k:| Naneum: | 7.4% (8,363) |
| State: | 7.4% (21,624) |
Number of households with income $150k - 200k:| Naneum: | 7.3% (8,272) |
| State: | 7.3% (21,360) |
Number of households with income > $200k:| Naneum: | 9.2% (10,472) |
| State: | 9.2% (27,055) |
Aggregate household income in Naneum in 2022: $21,995,135
Median family income in Naneum in 2022:| Naneum: | $64,075 |
| State: | $76,866 |
Number of families with income < $10k:| Naneum: | 0.9% (1) |
| Washington: | 4.4% (9,443) |
Number of families with income $10k - 20k:| Naneum: | 2.3% (3) |
| State: | 3.5% (7,524) |
Number of families with income $20k - 30k:| Naneum: | 7.0% (9) |
| Washington: | 5.6% (12,052) |
Number of families with income $30k - 40k:| Naneum: | 13.7% (18) |
| State: | 8.3% (17,803) |
Number of families with income $40k - 50k:| Naneum: | 6.9% (9) |
| Washington: | 7.7% (16,361) |
Number of families with income $50k - 60k:| Naneum: | 9.1% (12) |
| State: | 7.9% (16,852) |
Number of families with income $60k - 75k:| Naneum: | 11.1% (15) |
| State: | 11.4% (24,342) |
Number of families with income $75k - 100k:| Naneum: | 13.8% (18) |
| State: | 14.4% (30,698) |
Number of families with income $100k - 125k:| Naneum: | 13.9% (18) |
| State: | 11.4% (24,331) |
Number of families with income $125k - 150k:| Naneum: | 6.5% (9) |
| State: | 7.5% (16,099) |
Number of families with income $150k - 200k:| Naneum: | 4.2% (6) |
| Washington: | 8.2% (17,551) |
Number of families with income > $200k:| Naneum: | 10.6% (14) |
| State: | 9.7% (20,653) |
Median non-family income in Naneum in 2022:| Naneum: | $41,070 |
| State: | $54,173 |
Change in median non-family income between 2000 and 2022:| Naneum, Washington: | +93.3% |
| Washington: | +105.8% |
Median per capita income in Naneum in 2022:| Naneum: | $168,858 |
| State: | $28,252 |
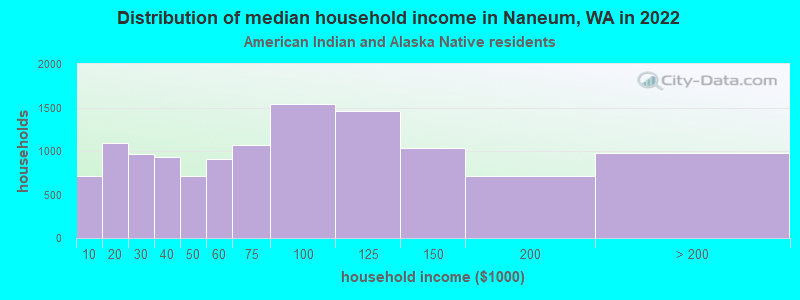
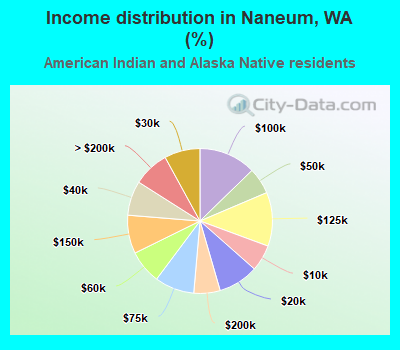
Income statistics for American Indian and Alaska Native residents
Median household income in Naneum, WA in 2022:| Naneum: | $54,737 |
| Washington: | $71,255 |
Change in median household income between 2000 and 2022:| Naneum, Washington: | +108.5% |
| State: | +118.1% |
Number of households with income < $10k:| Naneum: | 5.9% (713) |
| State: | 5.9% (1,768) |
Number of households with income $10k - 20k:| Naneum: | 9.0% (1,089) |
| State: | 8.9% (2,694) |
Number of households with income $20k - 30k:| Naneum: | 8.0% (964) |
| State: | 8.0% (2,412) |
Number of households with income $30k - 40k:| Naneum: | 7.7% (933) |
| Washington: | 7.7% (2,327) |
Number of households with income $40k - 50k:| Naneum: | 5.9% (713) |
| State: | 5.8% (1,755) |
Number of households with income $50k - 60k:| Naneum: | 7.5% (907) |
| State: | 7.5% (2,259) |
Number of households with income $60k - 75k:| Naneum: | 8.8% (1,070) |
| State: | 8.8% (2,669) |
Number of households with income $75k - 100k:| Naneum: | 12.7% (1,542) |
| State: | 12.8% (3,861) |
Number of households with income $100k - 125k:| Naneum: | 12.0% (1,456) |
| Washington: | 12.0% (3,618) |
Number of households with income $125k - 150k:| Naneum: | 8.6% (1,040) |
| Washington: | 8.6% (2,580) |
Number of households with income $150k - 200k:| Naneum: | 5.9% (711) |
| Washington: | 5.9% (1,774) |
Number of households with income > $200k:| Naneum: | 8.0% (973) |
| Washington: | 8.1% (2,447) |
Aggregate household income in Naneum in 2022: $167,795
Median family income in Naneum in 2022:| Naneum: | $59,856 |
| Washington: | $79,010 |
Median per capita income in Naneum in 2022:| Naneum: | $46,046 |
| Washington: | $27,053 |
Change in median per capita income between 2000 and 2022:| Naneum, Washington: | +97.1% |
| State: | +98.6% |
Income statistics for Multirace residents
Number of households with income < $10k:| Naneum: | 4.3% (2,434) |
| State: | 4.3% (12,040) |
Number of households with income $10k - 20k:| Naneum: | 6.6% (3,727) |
| State: | 6.6% (18,437) |
Number of households with income $20k - 30k:| Naneum: | 5.2% (2,943) |
| State: | 5.2% (14,559) |
Number of households with income $30k - 40k:| Naneum: | 6.7% (3,738) |
| State: | 6.7% (18,491) |
Number of households with income $40k - 50k:| Naneum: | 6.3% (3,529) |
| Washington: | 6.3% (17,459) |
Number of households with income $50k - 60k:| Naneum: | 6.9% (3,858) |
| State: | 6.9% (19,086) |
Number of households with income $60k - 75k:| Naneum: | 9.1% (5,116) |
| State: | 9.1% (25,310) |
Number of households with income $75k - 100k:| Naneum: | 13.5% (7,579) |
| State: | 13.5% (37,493) |
Number of households with income $100k - 125k:| Naneum: | 10.7% (5,989) |
| State: | 10.7% (29,626) |
Number of households with income $125k - 150k:| Naneum: | 8.6% (4,831) |
| State: | 8.6% (23,899) |
Number of households with income $150k - 200k:| Naneum: | 10.2% (5,703) |
| State: | 10.2% (28,214) |
Number of households with income > $200k:| Naneum: | 11.9% (6,660) |
| State: | 11.9% (32,947) |
Median per capita income in Naneum in 2022:| Naneum: | $12,491 |
| State: | $32,496 |
Change in median per capita income between 2000 and 2022:| Naneum, Washington: | +144.1% |
| Washington: | +156.8% |
Income statistics for other residents
Number of households with income < $10k:| Naneum: | 3.9% (5) |
| State: | 5.3% (6,540) |
Number of households with income $10k - 20k:| Naneum: | 7.0% (9) |
| State: | 6.0% (7,385) |
Number of households with income $20k - 30k:| Naneum: | 8.6% (11) |
| Washington: | 7.5% (9,289) |
Number of households with income $30k - 40k:| Naneum: | 10.2% (13) |
| State: | 8.9% (11,015) |
Number of households with income $40k - 50k:| Naneum: | 8.6% (11) |
| State: | 7.6% (9,399) |
Number of households with income $50k - 60k:| Naneum: | 7.8% (10) |
| State: | 7.2% (8,867) |
Number of households with income $60k - 75k:| Naneum: | 9.4% (12) |
| Washington: | 10.5% (13,032) |
Number of households with income $75k - 100k:| Naneum: | 13.3% (17) |
| State: | 14.6% (18,007) |
Number of households with income $100k - 125k:| Naneum: | 12.5% (16) |
| State: | 12.2% (15,128) |
Number of households with income $125k - 150k:| Naneum: | 5.5% (7) |
| State: | 5.6% (6,950) |
Number of households with income $150k - 200k:| Naneum: | 6.2% (8) |
| Washington: | 7.1% (8,749) |
Number of households with income > $200k:| Naneum: | 7.0% (9) |
| State: | 7.5% (9,208) |
Aggregate household income in Naneum in 2022: $10,955,653
Median family income in Naneum in 2022:| Naneum: | $445,637 |
| Washington: | $72,588 |
Number of families with income > $200k:| Naneum: | 100.0% (83) |
| State: | 7.1% (6,764) |
Median per capita income in Naneum in 2022:| Naneum: | $469,940 |
| Washington: | $27,542 |