New Baltimore, New York (NY) income map, earnings map, and wages data
The median household income in New Baltimore, NY in 2022 was $87,630, which was 9.2% greater than the median annual income of $79,557 across the entire state of New York. Compared to the median income of $48,136 in 2000 this represents an increase of 45.1%. The per capita income in 2022 was $42,051, which means an increase of 50.9% compared to 2000 when it was $20,636.
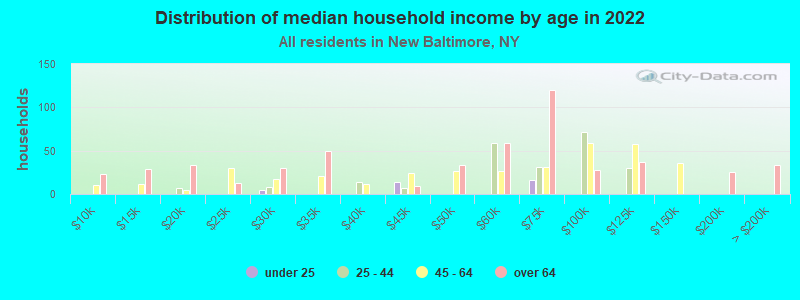
Income statistics for all residents
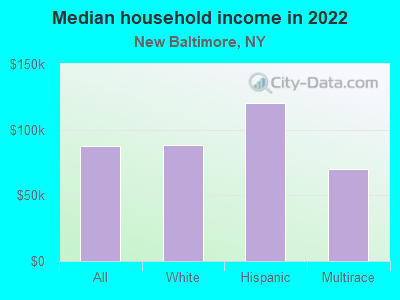
Median household income in New Baltimore, NY in 2022:| New Baltimore: | $87,630 |
| State: | $79,557 |
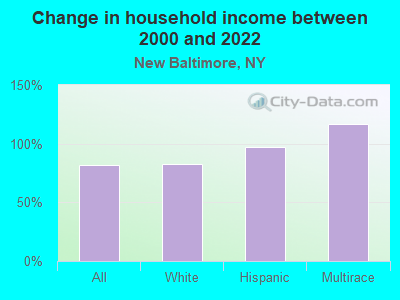
Change in median household income between 2000 and 2022:| New Baltimore, New York: | +82.0% |
| State: | +83.3% |
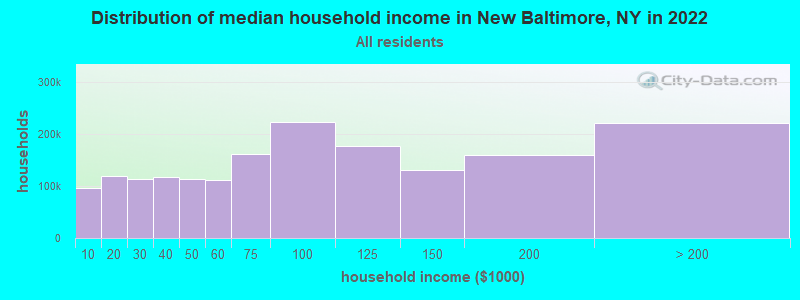
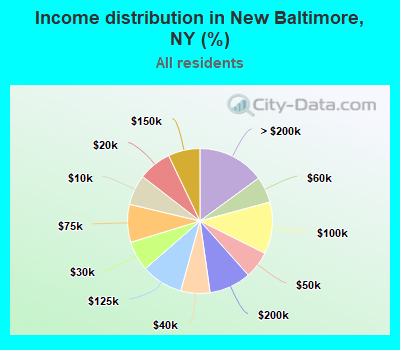
Number of households with income < $10k:| New Baltimore: | 6.8% (292,781) |
| State: | 6.8% (527,598) |
Number of households with income $10k - 20k:| New Baltimore: | 7.4% (318,997) |
| New York: | 7.4% (574,940) |
Number of households with income $20k - 30k:| New Baltimore: | 6.7% (287,225) |
| State: | 6.7% (517,718) |
Number of households with income $30k - 40k:| New Baltimore: | 6.5% (281,077) |
| State: | 6.5% (506,674) |
Number of households with income $40k - 50k:| New Baltimore: | 6.1% (260,957) |
| State: | 6.1% (470,439) |
Number of households with income $50k - 60k:| New Baltimore: | 5.8% (251,858) |
| State: | 5.8% (454,042) |
Number of households with income $60k - 75k:| New Baltimore: | 8.5% (364,714) |
| State: | 8.5% (657,508) |
Number of households with income $75k - 100k:| New Baltimore: | 11.6% (499,121) |
| New York: | 11.6% (899,824) |
Number of households with income $100k - 125k:| New Baltimore: | 9.3% (401,504) |
| State: | 9.3% (723,825) |
Number of households with income $125k - 150k:| New Baltimore: | 7.1% (306,441) |
| New York: | 7.1% (552,420) |
Number of households with income $150k - 200k:| New Baltimore: | 9.4% (403,359) |
| State: | 9.4% (727,051) |
Number of households with income > $200k:| New Baltimore: | 15.0% (644,944) |
| State: | 15.0% (1,162,269) |
Aggregate household income in New Baltimore in 2022: $14,524,223,608
Median family income in New Baltimore in 2022:| New Baltimore: | $95,785 |
| State: | $99,066 |
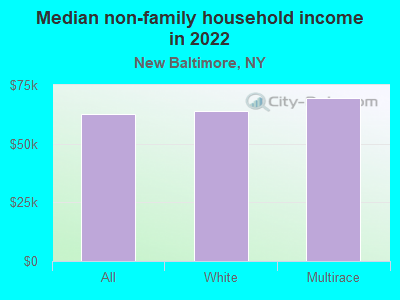
Median non-family income in New Baltimore in 2022:| New Baltimore: | $62,650 |
| New York: | $50,181 |
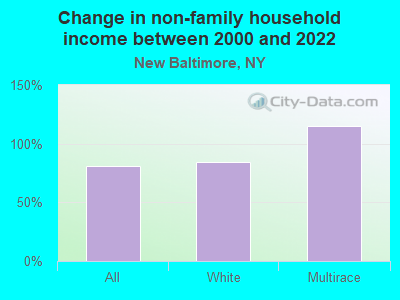
Change in median non-family income between 2000 and 2022:| New Baltimore, New York: | +81.3% |
| State: | +85.4% |
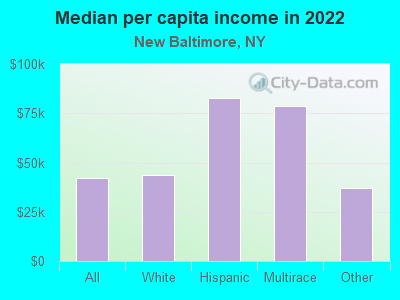
Median per capita income in New Baltimore in 2022:| New Baltimore: | $42,051 |
| State: | $47,421 |
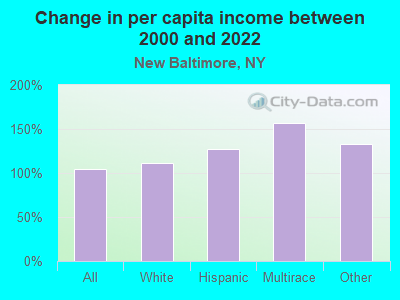
Change in median per capita income between 2000 and 2022:| New Baltimore, New York: | +103.8% |
| State: | +102.7% |
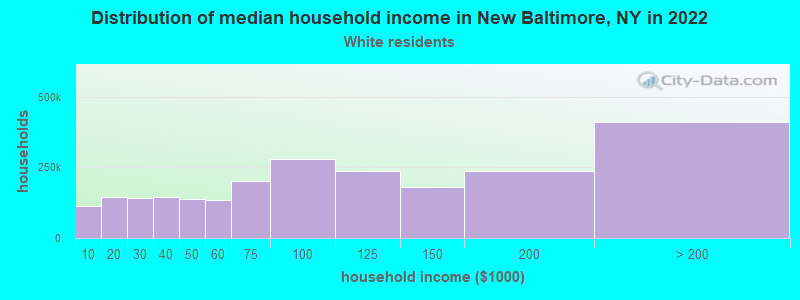
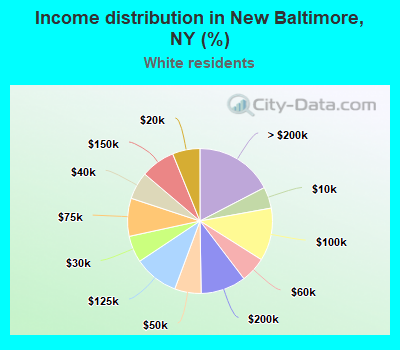
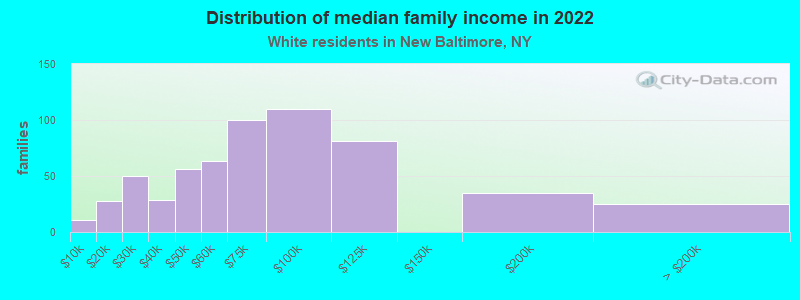
Income statistics for White residents
Median household income in New Baltimore, NY in 2022:| New Baltimore: | $88,622 |
| State: | $89,408 |
Change in median household income between 2000 and 2022:| New Baltimore, New York: | +83.3% |
| New York: | +85.5% |
Number of households with income < $10k:| New Baltimore: | 4.8% (112,616) |
| State: | 4.8% (225,550) |
Number of households with income $10k - 20k:| New Baltimore: | 6.1% (145,097) |
| State: | 6.1% (289,425) |
Number of households with income $20k - 30k:| New Baltimore: | 6.0% (140,740) |
| New York: | 5.9% (280,254) |
Number of households with income $30k - 40k:| New Baltimore: | 6.1% (144,923) |
| State: | 6.1% (288,263) |
Number of households with income $40k - 50k:| New Baltimore: | 5.9% (139,946) |
| State: | 5.9% (278,079) |
Number of households with income $50k - 60k:| New Baltimore: | 5.7% (134,726) |
| State: | 5.7% (267,554) |
Number of households with income $60k - 75k:| New Baltimore: | 8.5% (200,633) |
| State: | 8.4% (398,344) |
Number of households with income $75k - 100k:| New Baltimore: | 11.8% (279,400) |
| State: | 11.8% (554,841) |
Number of households with income $100k - 125k:| New Baltimore: | 10.0% (235,900) |
| State: | 10.0% (469,794) |
Number of households with income $125k - 150k:| New Baltimore: | 7.7% (180,908) |
| State: | 7.6% (360,467) |
Number of households with income $150k - 200k:| New Baltimore: | 10.1% (238,298) |
| State: | 10.1% (477,078) |
Number of households with income > $200k:| New Baltimore: | 17.4% (411,049) |
| New York: | 17.6% (829,233) |
Aggregate household income in New Baltimore in 2022: $9,673,485,916
Median family income in New Baltimore in 2022:| New Baltimore: | $98,280 |
| State: | $115,170 |
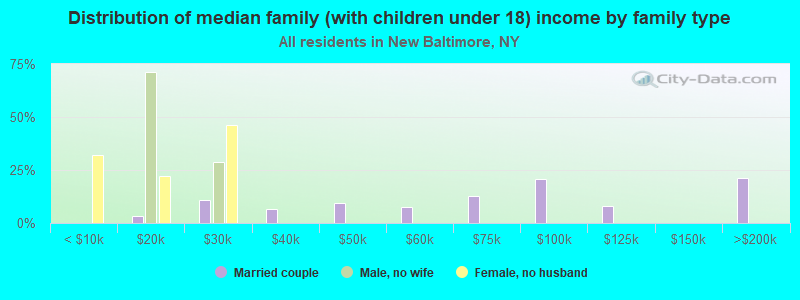
Number of families with income < $10k:| New Baltimore: | 1.9% (11) |
| State: | 2.5% (68,851) |
Number of families with income $10k - 20k:| New Baltimore: | 4.8% (28) |
| State: | 3.0% (83,127) |
Number of families with income $20k - 30k:| New Baltimore: | 8.5% (50) |
| State: | 3.5% (97,578) |
Number of families with income $30k - 40k:| New Baltimore: | 4.9% (29) |
| State: | 4.1% (114,108) |
Number of families with income $40k - 50k:| New Baltimore: | 9.5% (56) |
| New York: | 4.7% (130,902) |
Number of families with income $50k - 60k:| New Baltimore: | 10.8% (63) |
| State: | 4.9% (135,118) |
Number of families with income $60k - 75k:| New Baltimore: | 17.0% (100) |
| New York: | 7.8% (216,254) |
Number of families with income $75k - 100k:| New Baltimore: | 18.7% (110) |
| New York: | 12.4% (342,382) |
Number of families with income $100k - 125k:| New Baltimore: | 13.8% (81) |
| New York: | 11.4% (314,917) |
Number of families with income $150k - 200k:| New Baltimore: | 6.0% (35) |
| State: | 13.2% (365,586) |
Number of families with income > $200k:| New Baltimore: | 4.2% (25) |
| New York: | 23.2% (642,319) |
Median non-family income in New Baltimore in 2022:| New Baltimore: | $63,712 |
| State: | $54,783 |
Change in median non-family income between 2000 and 2022:| New Baltimore, New York: | +83.9% |
| State: | +87.9% |
Median per capita income in New Baltimore in 2022:| New Baltimore: | $43,585 |
| New York: | $57,640 |
Change in median per capita income between 2000 and 2022:| New Baltimore, New York: | +111.0% |
| State: | +111.6% |
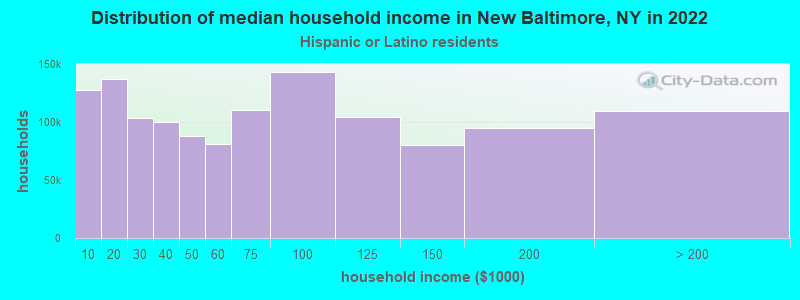
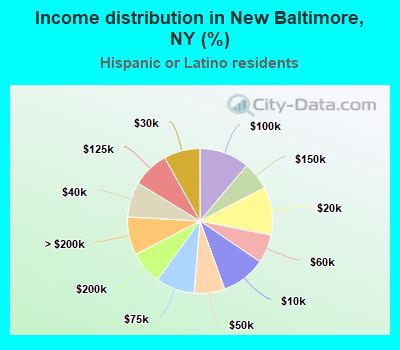
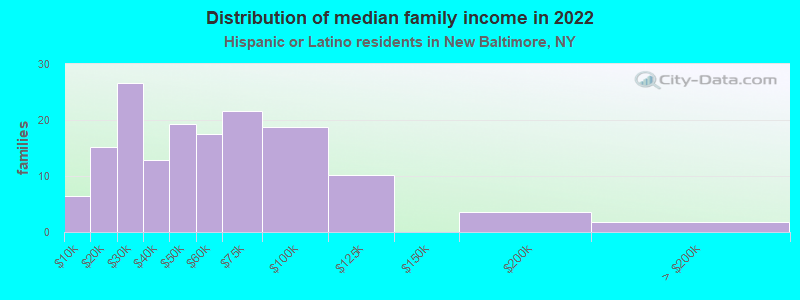
Income statistics for Hispanic or Latino residents
Median household income in New Baltimore, NY in 2022:| New Baltimore: | $120,391 |
| New York: | $60,468 |
Change in median household income between 2000 and 2022:| New Baltimore, New York: | +96.6% |
| State: | +98.3% |
Number of households with income < $10k:| New Baltimore: | 10.0% (127,627) |
| State: | 9.9% (127,185) |
Number of households with income $10k - 20k:| New Baltimore: | 10.7% (137,386) |
| New York: | 10.7% (136,699) |
Number of households with income $20k - 30k:| New Baltimore: | 8.1% (103,452) |
| New York: | 8.1% (102,991) |
Number of households with income $30k - 40k:| New Baltimore: | 7.8% (100,205) |
| State: | 7.8% (100,149) |
Number of households with income $40k - 50k:| New Baltimore: | 6.8% (87,671) |
| State: | 6.9% (87,760) |
Number of households with income $50k - 60k:| New Baltimore: | 6.3% (81,185) |
| State: | 6.3% (80,968) |
Number of households with income $60k - 75k:| New Baltimore: | 8.6% (110,656) |
| New York: | 8.7% (110,631) |
Number of households with income $75k - 100k:| New Baltimore: | 11.2% (142,834) |
| State: | 11.2% (142,787) |
Number of households with income $100k - 125k:| New Baltimore: | 8.2% (104,666) |
| New York: | 8.2% (104,850) |
Number of households with income $125k - 150k:| New Baltimore: | 6.3% (80,306) |
| State: | 6.3% (80,274) |
Number of households with income $150k - 200k:| New Baltimore: | 7.4% (94,935) |
| State: | 7.4% (95,117) |
Number of households with income > $200k:| New Baltimore: | 8.6% (109,487) |
| New York: | 8.6% (109,514) |
Aggregate household income in New Baltimore in 2022: $13,903,274
Median family income in New Baltimore in 2022:| New Baltimore: | $129,888 |
| State: | $68,770 |
Number of families with income < $10k:| New Baltimore: | 4.2% (6) |
| State: | 6.9% (58,565) |
Number of families with income $10k - 20k:| New Baltimore: | 9.9% (15) |
| New York: | 7.0% (59,058) |
Number of families with income $20k - 30k:| New Baltimore: | 17.3% (27) |
| State: | 8.0% (68,048) |
Number of families with income $30k - 40k:| New Baltimore: | 8.3% (13) |
| State: | 8.4% (70,668) |
Number of families with income $40k - 50k:| New Baltimore: | 12.5% (19) |
| New York: | 7.4% (62,941) |
Number of families with income $50k - 60k:| New Baltimore: | 11.4% (18) |
| State: | 6.6% (55,592) |
Number of families with income $60k - 75k:| New Baltimore: | 14.1% (22) |
| State: | 9.3% (78,564) |
Number of families with income $75k - 100k:| New Baltimore: | 12.1% (19) |
| State: | 12.6% (106,685) |
Number of families with income $100k - 125k:| New Baltimore: | 6.6% (10) |
| State: | 9.4% (79,139) |
Number of families with income $150k - 200k:| New Baltimore: | 2.3% (4) |
| State: | 8.3% (69,877) |
Number of families with income > $200k:| New Baltimore: | 1.2% (2) |
| State: | 9.3% (78,555) |
Median per capita income in New Baltimore in 2022:| New Baltimore: | $82,649 |
| State: | $29,761 |
Change in median per capita income between 2000 and 2022:| New Baltimore, New York: | +127.3% |
| New York: | +132.7% |
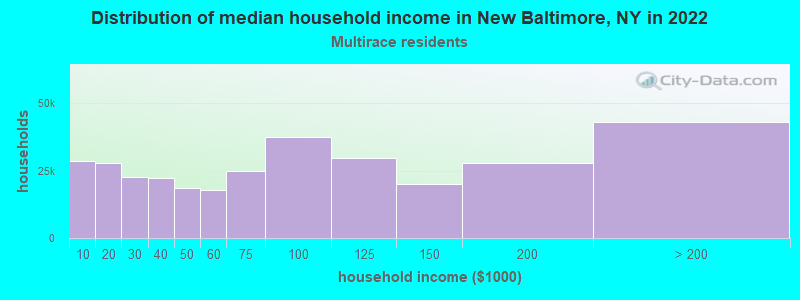
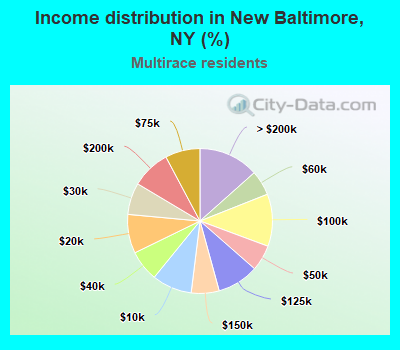
Income statistics for Multirace residents
Median household income in New Baltimore, NY in 2022:| New Baltimore: | $70,076 |
| State: | $73,557 |
Change in median household income between 2000 and 2022:| New Baltimore, New York: | +116.5% |
| New York: | +123.9% |
Number of households with income < $10k:| New Baltimore: | 8.9% (28,565) |
| New York: | 8.9% (57,924) |
Number of households with income $10k - 20k:| New Baltimore: | 8.7% (27,858) |
| New York: | 8.7% (56,590) |
Number of households with income $20k - 30k:| New Baltimore: | 7.1% (22,771) |
| State: | 7.1% (46,287) |
Number of households with income $30k - 40k:| New Baltimore: | 6.9% (22,180) |
| New York: | 6.9% (45,132) |
Number of households with income $40k - 50k:| New Baltimore: | 5.8% (18,612) |
| State: | 5.8% (37,946) |
Number of households with income $50k - 60k:| New Baltimore: | 5.6% (17,883) |
| State: | 5.6% (36,410) |
Number of households with income $60k - 75k:| New Baltimore: | 7.8% (24,945) |
| State: | 7.8% (50,819) |
Number of households with income $75k - 100k:| New Baltimore: | 11.7% (37,379) |
| State: | 11.7% (76,024) |
Number of households with income $100k - 125k:| New Baltimore: | 9.3% (29,745) |
| New York: | 9.3% (60,635) |
Number of households with income $125k - 150k:| New Baltimore: | 6.2% (19,931) |
| State: | 6.2% (40,533) |
Number of households with income $150k - 200k:| New Baltimore: | 8.6% (27,725) |
| New York: | 8.6% (56,409) |
Number of households with income > $200k:| New Baltimore: | 13.4% (43,042) |
| State: | 13.4% (87,442) |
Aggregate household income in New Baltimore in 2022: $17,746,571
Median non-family income in New Baltimore in 2022:| New Baltimore: | $69,430 |
| State: | $46,403 |
Change in median non-family income between 2000 and 2022:| New Baltimore, New York: | +114.5% |
| State: | +113.6% |
Median per capita income in New Baltimore in 2022:| New Baltimore: | $78,918 |
| State: | $36,931 |
Income statistics for other residents
Number of households with income < $10k:| New Baltimore: | 10.9% (6) |
| New York: | 10.3% (69,252) |
Number of households with income $10k - 20k:| New Baltimore: | 10.9% (6) |
| State: | 11.0% (73,890) |
Number of households with income $20k - 30k:| New Baltimore: | 7.3% (4) |
| State: | 8.8% (59,096) |
Number of households with income $30k - 40k:| New Baltimore: | 7.3% (4) |
| New York: | 8.1% (54,418) |
Number of households with income $40k - 50k:| New Baltimore: | 7.3% (4) |
| State: | 7.3% (49,042) |
Number of households with income $50k - 60k:| New Baltimore: | 5.5% (3) |
| New York: | 6.5% (43,945) |
Number of households with income $60k - 75k:| New Baltimore: | 9.1% (5) |
| New York: | 9.5% (64,087) |
Number of households with income $75k - 100k:| New Baltimore: | 10.9% (6) |
| New York: | 10.9% (73,094) |
Number of households with income $100k - 125k:| New Baltimore: | 9.1% (5) |
| State: | 7.9% (53,055) |
Number of households with income $125k - 150k:| New Baltimore: | 5.5% (3) |
| New York: | 5.9% (39,446) |
Number of households with income $150k - 200k:| New Baltimore: | 9.1% (5) |
| New York: | 7.2% (48,653) |
Number of households with income > $200k:| New Baltimore: | 7.3% (4) |
| State: | 6.6% (44,703) |
Aggregate household income in New Baltimore in 2022: $4,870,716
Median family income in New Baltimore in 2022:| New Baltimore: | $79,667 |
| State: | $63,465 |
Median per capita income in New Baltimore in 2022:| New Baltimore: | $37,233 |
| New York: | $26,975 |
Change in median per capita income between 2000 and 2022:| New Baltimore, New York: | +132.7% |
| State: | +144.6% |