The median household income in New Deal, TN in 2022 was $89,572, which was 27.1% greater than the median annual income of $65,254 across the entire state of Tennessee. Compared to the median income of $46,030 in 2000 this represents an increase of 48.6%. The per capita income in 2022 was $32,238, which means an increase of 34.4% compared to 2000 when it was $21,164.
Whole page based on the data from 2000 / 2022 when the population of New Deal, Tennessee was 368 / 272
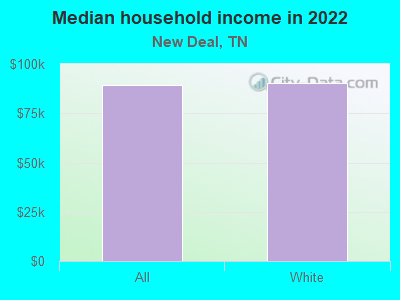
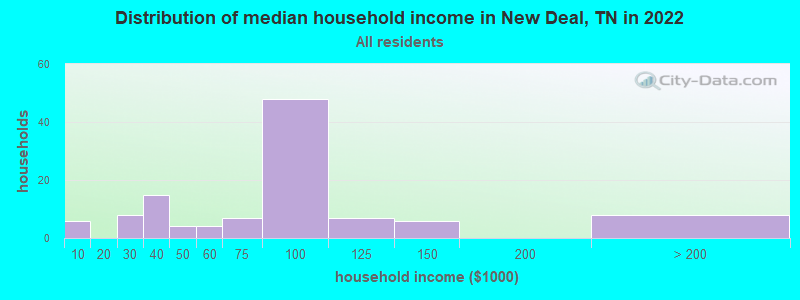
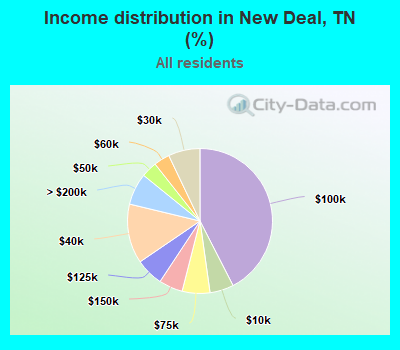
Income statistics for all residents
Median household income in New Deal, TN in 2022:
New Deal:
$89,573
State:
$65,254
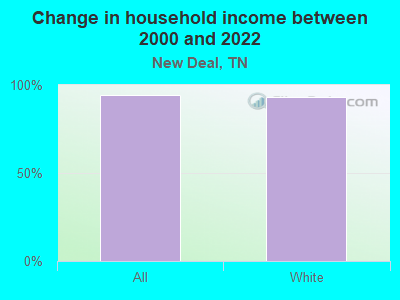
Change in median household income between 2000 and 2022:
New Deal, Tennessee:
+94.6%
Tennessee:
+79.5%
Number of households with income < $10k:
New Deal:
5.3% (6)
State:
5.4% (154,793)
Number of households with income $10k - 20k:
New Deal:
0.0% (0)
State:
8.0% (228,599)
Number of households with income $20k - 30k:
New Deal:
7.1% (8)
State:
7.9% (224,908)
Number of households with income $30k - 40k:
New Deal:
13.3% (15)
State:
8.6% (244,297)
Number of households with income $40k - 50k:
New Deal:
3.5% (4)
State:
8.4% (238,949)
Number of households with income $50k - 60k:
New Deal:
3.5% (4)
State:
7.7% (218,438)
Number of households with income $60k - 75k:
New Deal:
6.2% (7)
Tennessee:
10.3% (294,172)
Number of households with income $75k - 100k:
New Deal:
42.5% (48)
Tennessee:
13.3% (377,310)
Number of households with income $100k - 125k:
New Deal:
6.2% (7)
State:
9.5% (269,124)
Number of households with income $125k - 150k:
New Deal:
5.3% (6)
State:
6.3% (178,328)
Number of households with income $150k - 200k:
New Deal:
0.0% (0)
State:
7.2% (204,030)
Number of households with income > $200k:
New Deal:
7.1% (8)
State:
7.5% (213,736)
Aggregate household income in New Deal in 2022: $8,839,960
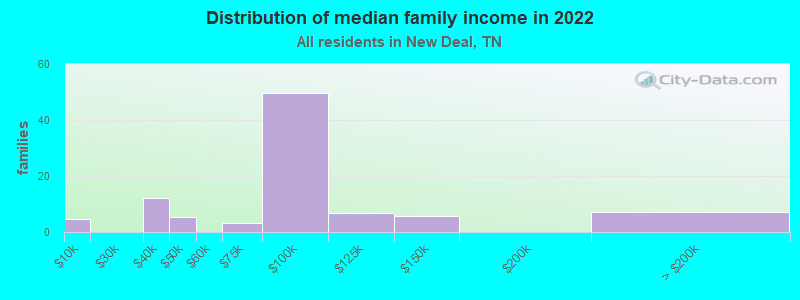
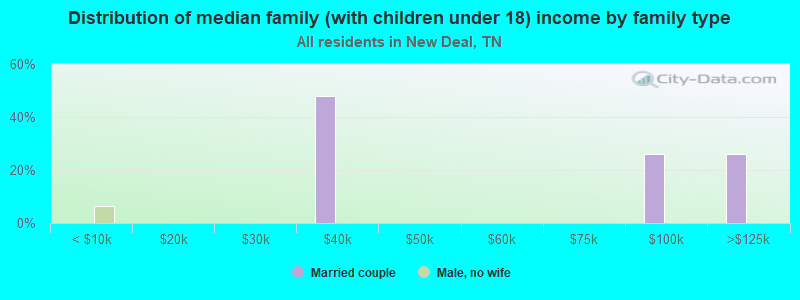
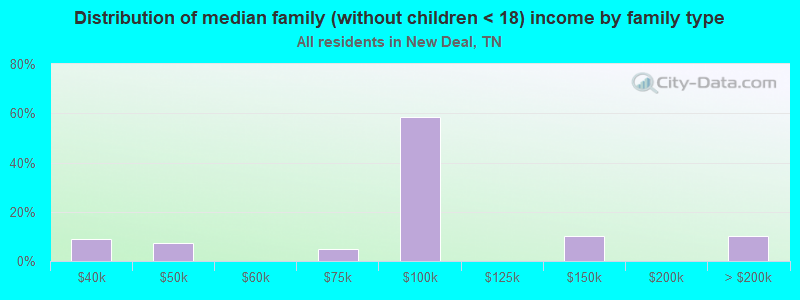
Median family income in New Deal in 2022:
New Deal:
$87,961
Tennessee:
$80,910
Number of families with income < $10k:
New Deal:
4.8% (5)
Tennessee:
3.9% (72,917)
Number of families with income $30k - 40k:
New Deal:
13.0% (12)
Tennessee:
7.2% (133,292)
Number of families with income $40k - 50k:
New Deal:
5.7% (5)
Tennessee:
7.4% (136,997)
Number of families with income $60k - 75k:
New Deal:
3.3% (3)
Tennessee:
10.8% (198,685)
Number of families with income $75k - 100k:
New Deal:
52.5% (50)
State:
15.1% (279,195)
Number of families with income $100k - 125k:
New Deal:
7.0% (7)
State:
11.7% (216,356)
Number of families with income $125k - 150k:
New Deal:
6.1% (6)
Tennessee:
7.8% (144,000)
Number of families with income > $200k:
New Deal:
7.6% (7)
State:
10.0% (183,756)
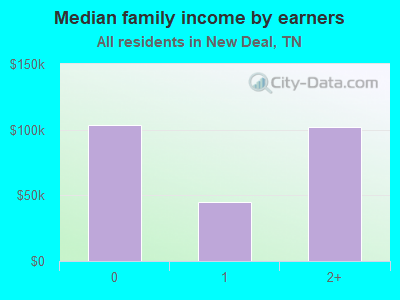
Median income for 2 person families:
New Deal:
$92,131
State:
$72,442
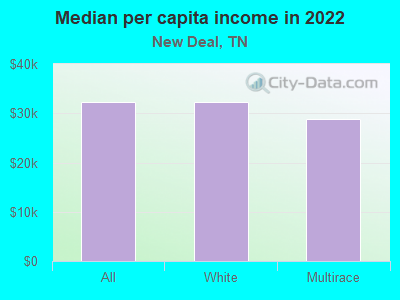
Median per capita income in New Deal in 2022:
New Deal:
$32,238
Tennessee:
$36,704
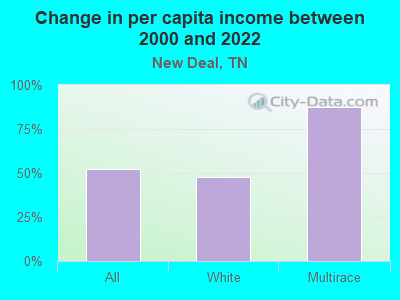
Change in median per capita income between 2000 and 2022:
New Deal, Tennessee:
+52.3%
Tennessee:
+89.3%
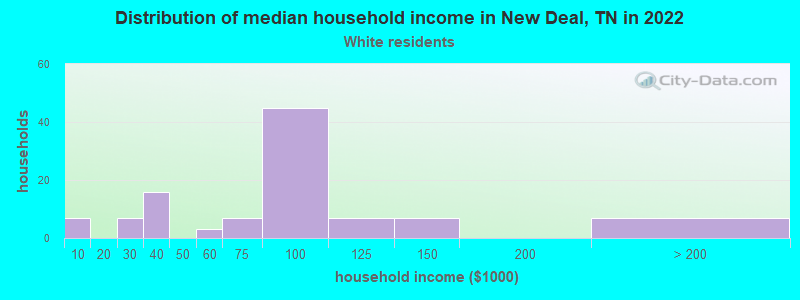
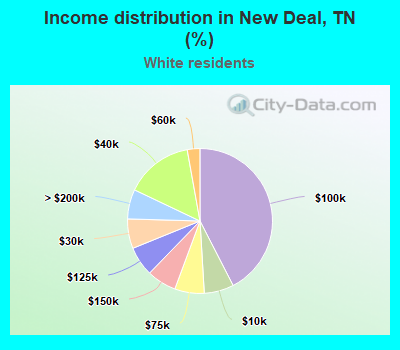
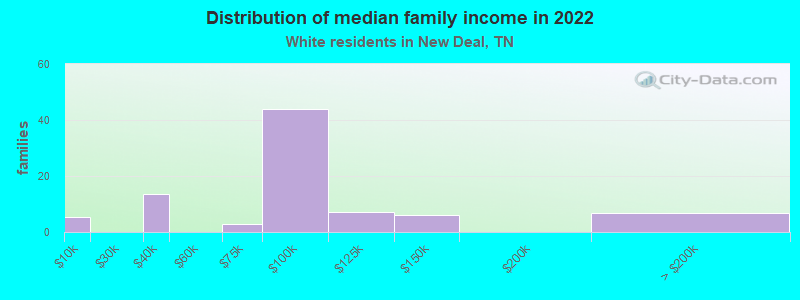
Income statistics for White residents
Median household income in New Deal, TN in 2022:
New Deal:
$90,470
State:
$69,826
Change in median household income between 2000 and 2022:
New Deal, Tennessee:
+93.2%
Tennessee:
+82.9%
Number of households with income < $10k:
New Deal:
6.6% (7)
Tennessee:
4.6% (100,279)
Number of households with income $10k - 20k:
New Deal:
0.0% (0)
State:
7.6% (165,031)
Number of households with income $20k - 30k:
New Deal:
6.6% (7)
State:
7.4% (160,229)
Number of households with income $30k - 40k:
New Deal:
15.1% (16)
State:
8.1% (174,784)
Number of households with income $40k - 50k:
New Deal:
0.0% (0)
State:
7.8% (169,622)
Number of households with income $50k - 60k:
New Deal:
2.8% (3)
State:
7.6% (165,508)
Number of households with income $60k - 75k:
New Deal:
6.6% (7)
State:
10.3% (223,937)
Number of households with income $75k - 100k:
New Deal:
42.5% (45)
State:
13.5% (292,688)
Number of households with income $100k - 125k:
New Deal:
6.6% (7)
State:
10.1% (219,251)
Number of households with income $125k - 150k:
New Deal:
6.6% (7)
Tennessee:
6.6% (142,574)
Number of households with income $150k - 200k:
New Deal:
0.0% (0)
State:
7.7% (166,039)
Number of households with income > $200k:
New Deal:
6.6% (7)
Tennessee:
8.5% (184,546)
Aggregate household income in New Deal in 2022: $8,614,352
Median family income in New Deal in 2022:
New Deal:
$89,328
State:
$86,015
Number of families with income < $10k:
New Deal:
6.4% (5)
State:
3.1% (43,751)
Number of families with income $30k - 40k:
New Deal:
15.8% (14)
State:
6.6% (93,498)
Number of families with income $60k - 75k:
New Deal:
3.4% (3)
State:
10.7% (151,997)
Number of families with income $75k - 100k:
New Deal:
51.3% (44)
State:
15.4% (218,373)
Number of families with income $100k - 125k:
New Deal:
8.3% (7)
Tennessee:
12.6% (178,761)
Number of families with income $125k - 150k:
New Deal:
7.0% (6)
State:
8.2% (116,575)
Number of families with income > $200k:
New Deal:
7.9% (7)
State:
11.2% (159,431)
Median per capita income in New Deal in 2022:
New Deal:
$32,217
State:
$40,126
Change in median per capita income between 2000 and 2022:
New Deal, Tennessee:
+47.9%
Tennessee:
+92.6%
Income statistics for Multirace residents
Aggregate household income in New Deal in 2022: $218,752,800
Median per capita income in New Deal in 2022:
New Deal:
$28,760
Tennessee:
$24,436
Change in median per capita income between 2000 and 2022:
New Deal, Tennessee:
+87.7%
State:
+84.3%
Discuss New Deal, Tennessee (TN) on our hugely popular Tennessee forum.