North Cleveland, Oklahoma (OK) income map, earnings map, and wages data
The median household income in North Cleveland, OK in 2022 was $81,774, which was 27.0% greater than the median annual income of $59,673 across the entire state of Oklahoma. Compared to the median income of $48,592 in 2000 this represents an increase of 40.6%. The per capita income in 2022 was $36,270, which means an increase of 43.1% compared to 2000 when it was $20,652.
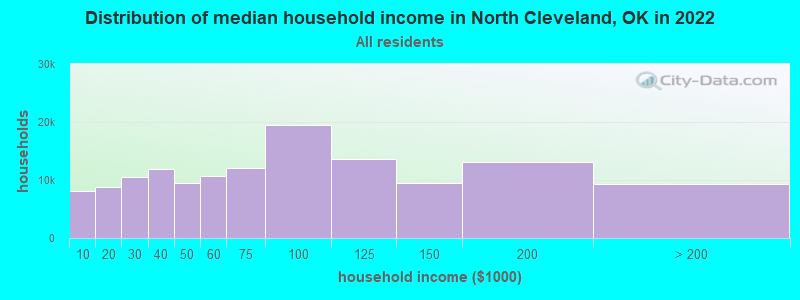
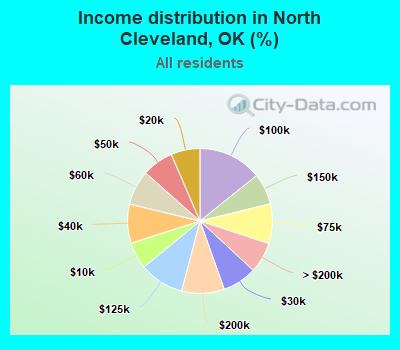
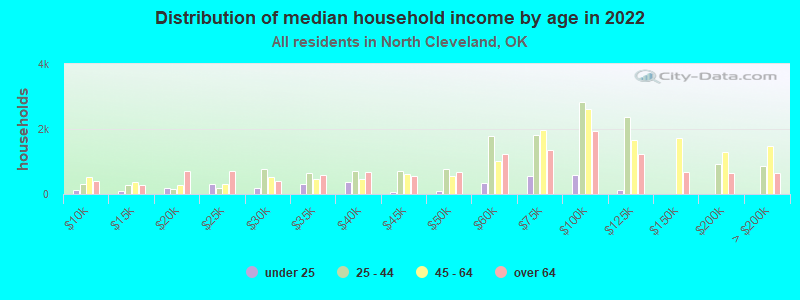
Income statistics for all residents
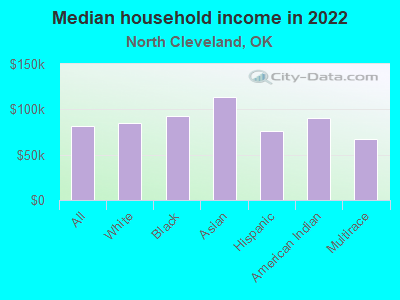
Median household income in North Cleveland, OK in 2022:| North Cleveland: | $81,775 |
| State: | $59,673 |
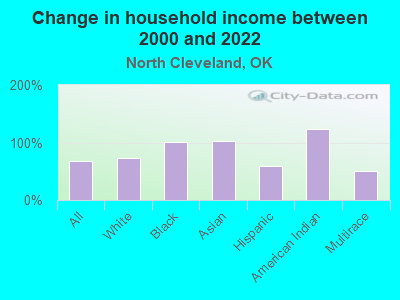
Change in median household income between 2000 and 2022:| North Cleveland, Oklahoma: | +68.3% |
| State: | +78.7% |
Number of households with income < $10k:| North Cleveland: | 6.0% (8,138) |
| State: | 6.4% (100,950) |
Number of households with income $10k - 20k:| North Cleveland: | 6.5% (8,841) |
| State: | 8.8% (137,709) |
Number of households with income $20k - 30k:| North Cleveland: | 7.7% (10,470) |
| State: | 9.1% (143,661) |
Number of households with income $30k - 40k:| North Cleveland: | 8.7% (11,923) |
| State: | 9.0% (141,098) |
Number of households with income $40k - 50k:| North Cleveland: | 7.0% (9,539) |
| Oklahoma: | 8.9% (140,217) |
Number of households with income $50k - 60k:| North Cleveland: | 7.8% (10,625) |
| Oklahoma: | 8.1% (126,882) |
Number of households with income $60k - 75k:| North Cleveland: | 8.9% (12,113) |
| State: | 10.0% (157,916) |
Number of households with income $75k - 100k:| North Cleveland: | 14.2% (19,449) |
| State: | 12.4% (195,015) |
Number of households with income $100k - 125k:| North Cleveland: | 10.0% (13,624) |
| State: | 9.0% (141,779) |
Number of households with income $125k - 150k:| North Cleveland: | 7.0% (9,502) |
| State: | 5.8% (91,594) |
Number of households with income $150k - 200k:| North Cleveland: | 9.5% (13,021) |
| Oklahoma: | 6.3% (98,589) |
Number of households with income > $200k:| North Cleveland: | 6.8% (9,348) |
| State: | 6.2% (97,770) |
Aggregate household income in North Cleveland in 2022: $9,041,174,410
Median family income in North Cleveland in 2022:| North Cleveland: | $94,311 |
| Oklahoma: | $75,476 |
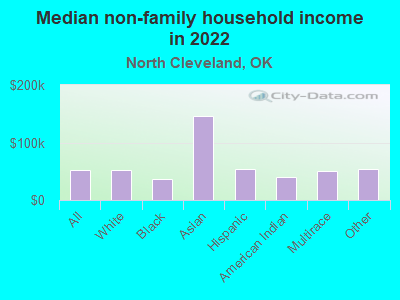
Median non-family income in North Cleveland in 2022:| North Cleveland: | $52,021 |
| Oklahoma: | $35,419 |
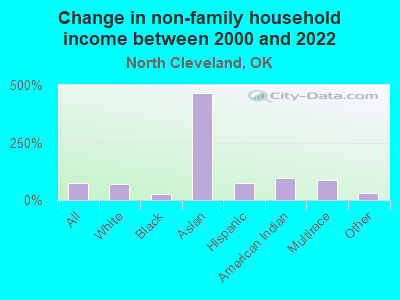
Change in median non-family income between 2000 and 2022:| North Cleveland, Oklahoma: | +73.2% |
| State: | +83.2% |
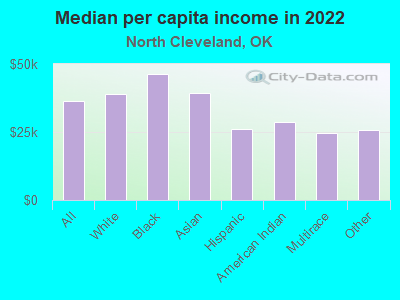
Median per capita income in North Cleveland in 2022:| North Cleveland: | $36,271 |
| Oklahoma: | $32,930 |
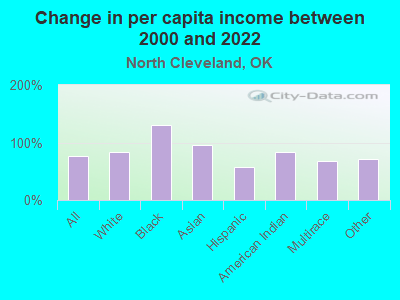
Change in median per capita income between 2000 and 2022:| North Cleveland, Oklahoma: | +75.6% |
| Oklahoma: | +86.6% |
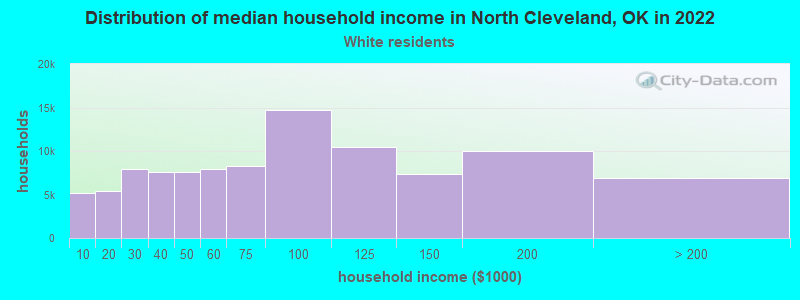
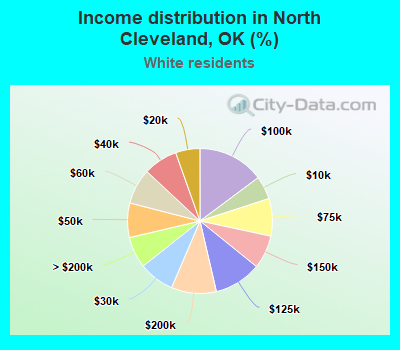
Income statistics for White residents
Median household income in North Cleveland, OK in 2022:| North Cleveland: | $84,493 |
| Oklahoma: | $63,444 |
Change in median household income between 2000 and 2022:| North Cleveland, Oklahoma: | +73.1% |
| State: | +79.3% |
Number of households with income < $10k:| North Cleveland: | 5.2% (5,147) |
| State: | 5.5% (60,994) |
Number of households with income $10k - 20k:| North Cleveland: | 5.4% (5,390) |
| State: | 8.2% (91,263) |
Number of households with income $20k - 30k:| North Cleveland: | 7.9% (7,876) |
| Oklahoma: | 8.7% (96,988) |
Number of households with income $30k - 40k:| North Cleveland: | 7.6% (7,573) |
| State: | 8.4% (93,121) |
Number of households with income $40k - 50k:| North Cleveland: | 7.7% (7,630) |
| Oklahoma: | 8.6% (95,446) |
Number of households with income $50k - 60k:| North Cleveland: | 7.9% (7,879) |
| State: | 7.9% (87,723) |
Number of households with income $60k - 75k:| North Cleveland: | 8.4% (8,312) |
| State: | 9.9% (109,955) |
Number of households with income $75k - 100k:| North Cleveland: | 14.8% (14,719) |
| State: | 12.9% (143,880) |
Number of households with income $100k - 125k:| North Cleveland: | 10.6% (10,487) |
| State: | 9.7% (107,851) |
Number of households with income $125k - 150k:| North Cleveland: | 7.4% (7,393) |
| Oklahoma: | 6.3% (69,802) |
Number of households with income $150k - 200k:| North Cleveland: | 10.0% (9,975) |
| State: | 6.9% (76,863) |
Number of households with income > $200k:| North Cleveland: | 7.0% (6,934) |
| State: | 7.0% (78,099) |
Aggregate household income in North Cleveland in 2022: $6,081,208,783
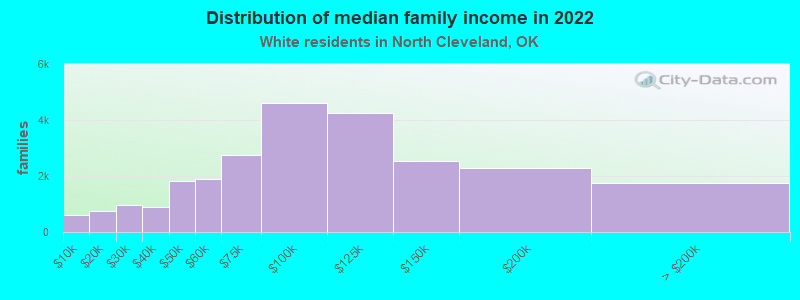
Median family income in North Cleveland in 2022:| North Cleveland: | $98,595 |
| State: | $82,251 |
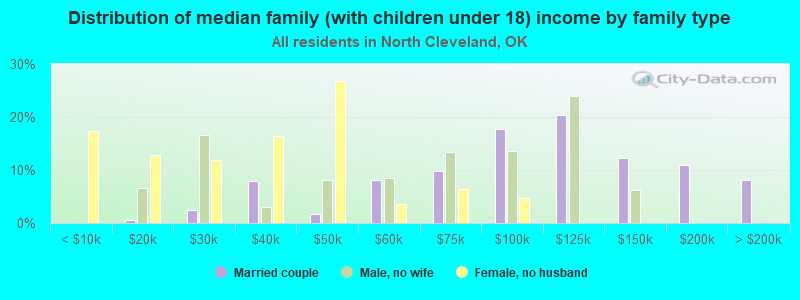
Number of families with income < $10k:| North Cleveland: | 2.4% (611) |
| State: | 3.4% (24,057) |
Number of families with income $10k - 20k:| North Cleveland: | 3.0% (763) |
| State: | 4.1% (29,440) |
Number of families with income $20k - 30k:| North Cleveland: | 3.9% (982) |
| State: | 5.7% (40,670) |
Number of families with income $30k - 40k:| North Cleveland: | 3.6% (908) |
| State: | 6.5% (46,540) |
Number of families with income $40k - 50k:| North Cleveland: | 7.3% (1,836) |
| Oklahoma: | 7.7% (55,082) |
Number of families with income $50k - 60k:| North Cleveland: | 7.6% (1,904) |
| Oklahoma: | 7.5% (53,408) |
Number of families with income $60k - 75k:| North Cleveland: | 10.9% (2,755) |
| State: | 10.4% (74,624) |
Number of families with income $75k - 100k:| North Cleveland: | 18.3% (4,607) |
| Oklahoma: | 15.3% (109,679) |
Number of families with income $100k - 125k:| North Cleveland: | 16.9% (4,256) |
| State: | 12.0% (86,208) |
Number of families with income $125k - 150k:| North Cleveland: | 10.0% (2,525) |
| State: | 8.3% (59,328) |
Number of families with income $150k - 200k:| North Cleveland: | 9.1% (2,285) |
| State: | 9.4% (67,640) |
Number of families with income > $200k:| North Cleveland: | 6.9% (1,750) |
| State: | 9.7% (69,551) |
Median non-family income in North Cleveland in 2022:| North Cleveland: | $51,561 |
| State: | $36,941 |
Change in median non-family income between 2000 and 2022:| North Cleveland, Oklahoma: | +70.2% |
| State: | +83.5% |
Median per capita income in North Cleveland in 2022:| North Cleveland: | $39,114 |
| State: | $37,390 |
Change in median per capita income between 2000 and 2022:| North Cleveland, Oklahoma: | +83.1% |
| Oklahoma: | +92.4% |
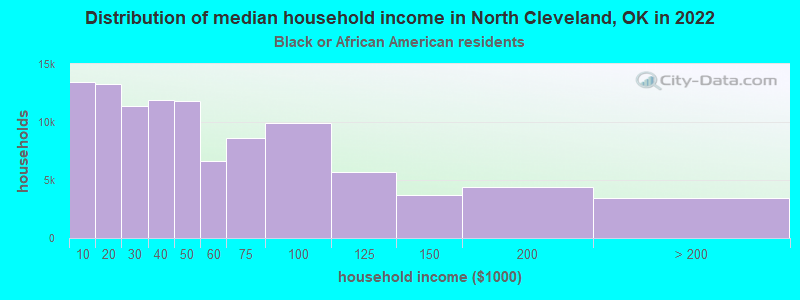
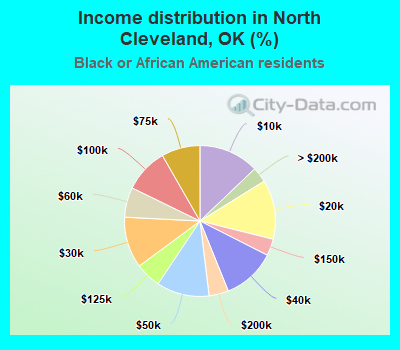
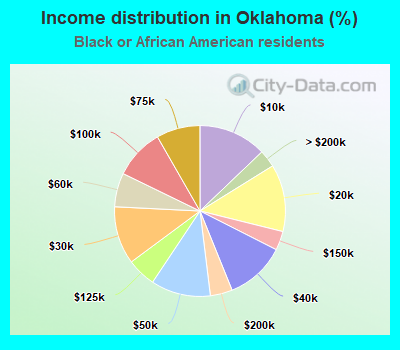
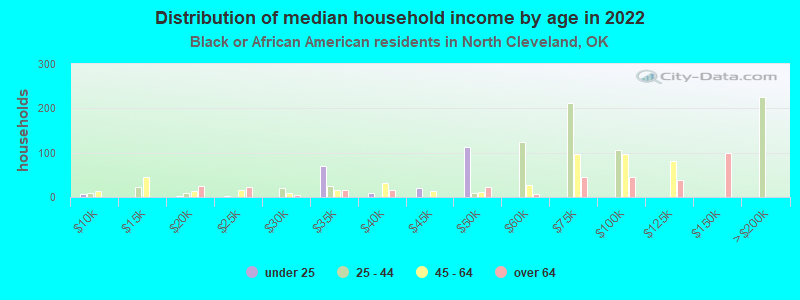
Income statistics for Black or African American residents
Median household income in North Cleveland, OK in 2022:| North Cleveland: | $92,248 |
| State: | $41,135 |
Change in median household income between 2000 and 2022:| North Cleveland, Oklahoma: | +100.7% |
| Oklahoma: | +72.7% |
Number of households with income < $10k:| North Cleveland: | 12.9% (13,429) |
| State: | 12.9% (13,905) |
Number of households with income $10k - 20k:| North Cleveland: | 12.7% (13,259) |
| State: | 12.7% (13,734) |
Number of households with income $20k - 30k:| North Cleveland: | 11.0% (11,413) |
| Oklahoma: | 11.0% (11,826) |
Number of households with income $30k - 40k:| North Cleveland: | 11.4% (11,871) |
| State: | 11.4% (12,301) |
Number of households with income $40k - 50k:| North Cleveland: | 11.3% (11,779) |
| Oklahoma: | 11.3% (12,200) |
Number of households with income $50k - 60k:| North Cleveland: | 6.4% (6,678) |
| Oklahoma: | 6.4% (6,925) |
Number of households with income $60k - 75k:| North Cleveland: | 8.3% (8,624) |
| State: | 8.3% (8,947) |
Number of households with income $75k - 100k:| North Cleveland: | 9.5% (9,889) |
| State: | 9.5% (10,253) |
Number of households with income $100k - 125k:| North Cleveland: | 5.5% (5,720) |
| State: | 5.5% (5,928) |
Number of households with income $125k - 150k:| North Cleveland: | 3.6% (3,750) |
| State: | 3.6% (3,885) |
Number of households with income $150k - 200k:| North Cleveland: | 4.2% (4,365) |
| Oklahoma: | 4.2% (4,529) |
Number of households with income > $200k:| North Cleveland: | 3.3% (3,423) |
| Oklahoma: | 3.3% (3,551) |
Aggregate household income in North Cleveland in 2022: $229,857,906
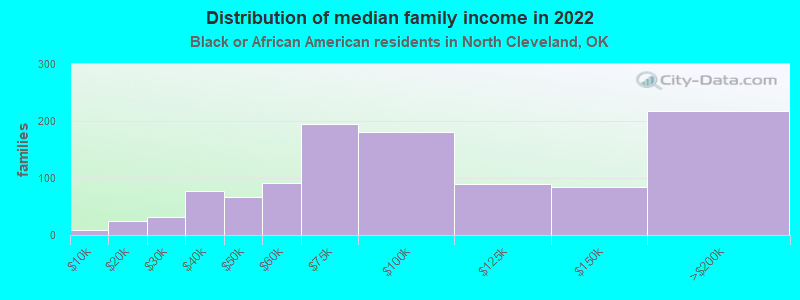
Median family income in North Cleveland in 2022:| North Cleveland: | $114,710 |
| State: | $53,226 |
Number of families with income < $10k:| North Cleveland: | 0.8% (9) |
| State: | 8.4% (5,089) |
Number of families with income $10k - 20k:| North Cleveland: | 2.3% (25) |
| State: | 7.7% (4,638) |
Number of families with income $20k - 30k:| North Cleveland: | 2.9% (31) |
| State: | 10.1% (6,085) |
Number of families with income $30k - 40k:| North Cleveland: | 7.3% (78) |
| State: | 10.7% (6,478) |
Number of families with income $40k - 50k:| North Cleveland: | 6.3% (67) |
| State: | 10.1% (6,091) |
Number of families with income $50k - 60k:| North Cleveland: | 8.6% (92) |
| State: | 8.1% (4,896) |
Number of families with income $60k - 75k:| North Cleveland: | 18.2% (195) |
| State: | 9.4% (5,686) |
Number of families with income $75k - 100k:| North Cleveland: | 16.9% (181) |
| State: | 12.4% (7,470) |
Number of families with income $100k - 125k:| North Cleveland: | 8.3% (89) |
| State: | 7.5% (4,544) |
Number of families with income $125k - 150k:| North Cleveland: | 8.0% (85) |
| State: | 4.7% (2,864) |
Number of families with income $150k - 200k:| North Cleveland: | 20.4% (218) |
| Oklahoma: | 5.7% (3,474) |
Median non-family income in North Cleveland in 2022:| North Cleveland: | $36,849 |
| Oklahoma: | $27,166 |
Change in median non-family income between 2000 and 2022:| North Cleveland, Oklahoma: | +27.4% |
| Oklahoma: | +81.9% |
Median per capita income in North Cleveland in 2022:| North Cleveland: | $46,323 |
| State: | $24,741 |
Change in median per capita income between 2000 and 2022:| North Cleveland, Oklahoma: | +131.2% |
| Oklahoma: | +98.7% |
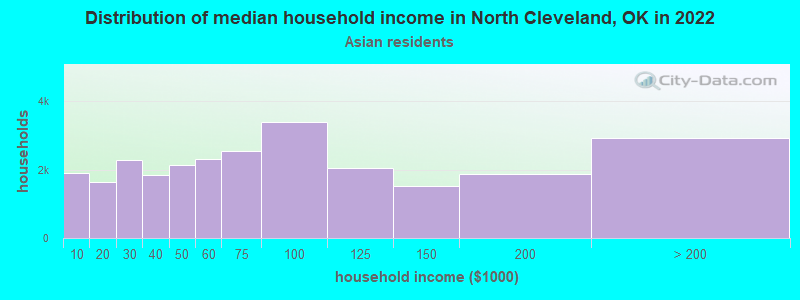
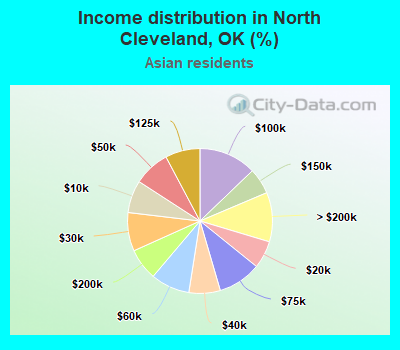
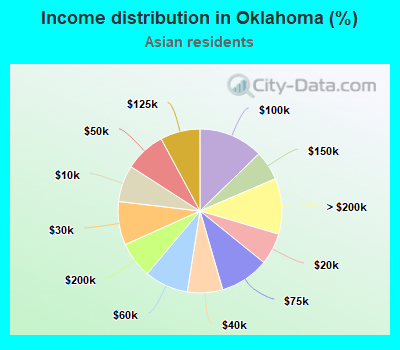
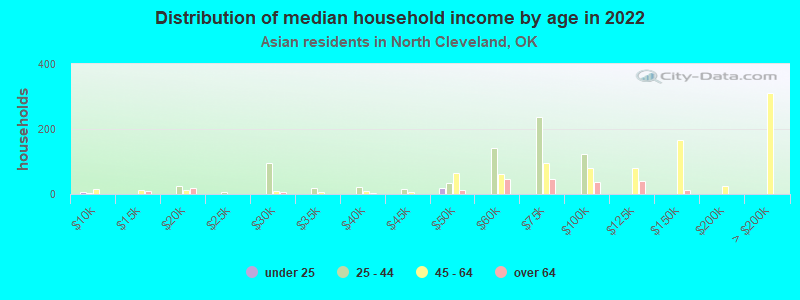
Income statistics for Asian residents
Median household income in North Cleveland, OK in 2022:| North Cleveland: | $113,372 |
| State: | $65,557 |
Change in median household income between 2000 and 2022:| North Cleveland, Oklahoma: | +101.5% |
| State: | +89.8% |
Number of households with income < $10k:| North Cleveland: | 7.2% (1,912) |
| State: | 7.2% (2,371) |
Number of households with income $10k - 20k:| North Cleveland: | 6.1% (1,623) |
| State: | 6.2% (2,045) |
Number of households with income $20k - 30k:| North Cleveland: | 8.6% (2,276) |
| Oklahoma: | 8.6% (2,814) |
Number of households with income $30k - 40k:| North Cleveland: | 7.0% (1,849) |
| State: | 6.9% (2,280) |
Number of households with income $40k - 50k:| North Cleveland: | 8.1% (2,141) |
| State: | 8.1% (2,646) |
Number of households with income $50k - 60k:| North Cleveland: | 8.7% (2,297) |
| State: | 8.7% (2,845) |
Number of households with income $60k - 75k:| North Cleveland: | 9.7% (2,556) |
| State: | 9.7% (3,194) |
Number of households with income $75k - 100k:| North Cleveland: | 12.8% (3,391) |
| State: | 12.7% (4,184) |
Number of households with income $100k - 125k:| North Cleveland: | 7.8% (2,047) |
| Oklahoma: | 7.8% (2,576) |
Number of households with income $125k - 150k:| North Cleveland: | 5.8% (1,527) |
| Oklahoma: | 5.8% (1,910) |
Number of households with income $150k - 200k:| North Cleveland: | 7.1% (1,869) |
| State: | 7.1% (2,342) |
Number of households with income > $200k:| North Cleveland: | 11.0% (2,909) |
| Oklahoma: | 11.0% (3,610) |
Aggregate household income in North Cleveland in 2022: $240,491,595
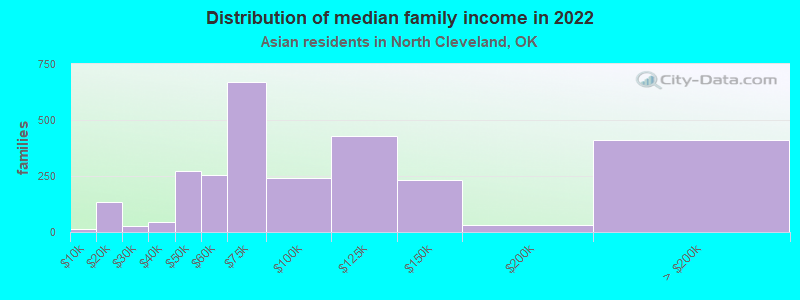
Median family income in North Cleveland in 2022:| North Cleveland: | $110,316 |
| State: | $86,230 |
Number of families with income < $10k:| North Cleveland: | 0.5% (13) |
| State: | 3.6% (747) |
Number of families with income $10k - 20k:| North Cleveland: | 4.9% (134) |
| Oklahoma: | 4.1% (848) |
Number of families with income $20k - 30k:| North Cleveland: | 1.0% (27) |
| State: | 3.6% (735) |
Number of families with income $30k - 40k:| North Cleveland: | 1.6% (46) |
| State: | 5.9% (1,215) |
Number of families with income $40k - 50k:| North Cleveland: | 9.9% (274) |
| State: | 8.1% (1,675) |
Number of families with income $50k - 60k:| North Cleveland: | 9.2% (253) |
| State: | 7.2% (1,487) |
Number of families with income $60k - 75k:| North Cleveland: | 24.3% (670) |
| State: | 10.9% (2,238) |
Number of families with income $75k - 100k:| North Cleveland: | 8.8% (242) |
| State: | 16.9% (3,488) |
Number of families with income $100k - 125k:| North Cleveland: | 15.6% (430) |
| State: | 6.7% (1,389) |
Number of families with income $125k - 150k:| North Cleveland: | 8.3% (231) |
| State: | 8.6% (1,770) |
Number of families with income $150k - 200k:| North Cleveland: | 1.2% (33) |
| State: | 9.7% (1,989) |
Number of families with income > $200k:| North Cleveland: | 14.8% (409) |
| State: | 14.6% (3,001) |
Median non-family income in North Cleveland in 2022:| North Cleveland: | $146,155 |
| State: | $42,116 |
Median per capita income in North Cleveland in 2022:| North Cleveland: | $39,245 |
| Oklahoma: | $36,283 |
Change in median per capita income between 2000 and 2022:| North Cleveland, Oklahoma: | +96.1% |
| State: | +131.2% |
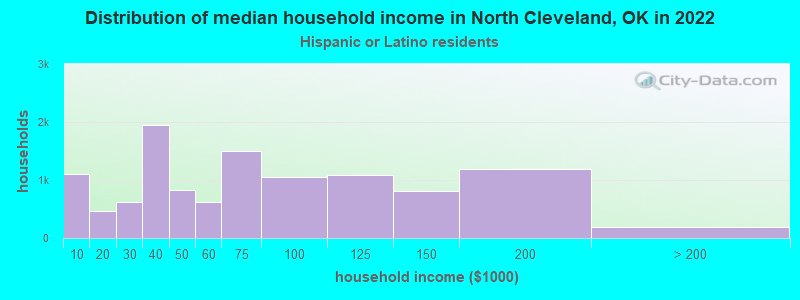
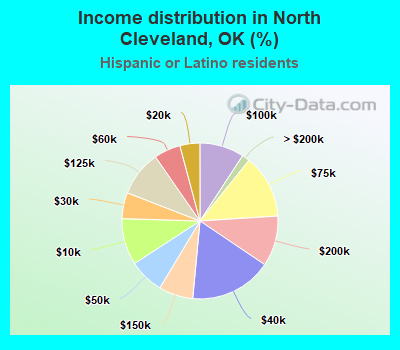
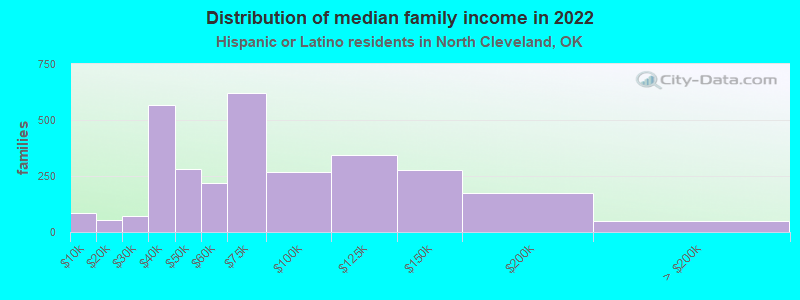
Income statistics for Hispanic or Latino residents
Median household income in North Cleveland, OK in 2022:| North Cleveland: | $75,755 |
| State: | $52,856 |
Change in median household income between 2000 and 2022:| North Cleveland, Oklahoma: | +60.0% |
| State: | +89.4% |
Number of households with income < $10k:| North Cleveland: | 9.6% (1,101) |
| State: | 6.0% (7,958) |
Number of households with income $10k - 20k:| North Cleveland: | 4.1% (473) |
| State: | 8.4% (11,153) |
Number of households with income $20k - 30k:| North Cleveland: | 5.4% (616) |
| Oklahoma: | 9.7% (13,003) |
Number of households with income $30k - 40k:| North Cleveland: | 17.0% (1,946) |
| Oklahoma: | 11.7% (15,624) |
Number of households with income $40k - 50k:| North Cleveland: | 7.2% (826) |
| Oklahoma: | 11.0% (14,697) |
Number of households with income $50k - 60k:| North Cleveland: | 5.5% (628) |
| Oklahoma: | 9.6% (12,832) |
Number of households with income $60k - 75k:| North Cleveland: | 13.2% (1,503) |
| State: | 12.2% (16,321) |
Number of households with income $75k - 100k:| North Cleveland: | 9.2% (1,052) |
| Oklahoma: | 12.5% (16,668) |
Number of households with income $100k - 125k:| North Cleveland: | 9.5% (1,081) |
| State: | 7.5% (9,988) |
Number of households with income $125k - 150k:| North Cleveland: | 7.1% (813) |
| Oklahoma: | 4.5% (6,042) |
Number of households with income $150k - 200k:| North Cleveland: | 10.5% (1,194) |
| Oklahoma: | 3.8% (5,080) |
Number of households with income > $200k:| North Cleveland: | 1.6% (184) |
| State: | 3.0% (4,063) |
Aggregate household income in North Cleveland in 2022: $390,423,152
Median family income in North Cleveland in 2022:| North Cleveland: | $71,821 |
| State: | $55,896 |
Number of families with income < $10k:| North Cleveland: | 2.9% (87) |
| State: | 5.1% (5,166) |
Number of families with income $10k - 20k:| North Cleveland: | 1.7% (53) |
| State: | 6.4% (6,492) |
Number of families with income $20k - 30k:| North Cleveland: | 2.4% (73) |
| State: | 8.4% (8,466) |
Number of families with income $30k - 40k:| North Cleveland: | 18.9% (569) |
| State: | 12.3% (12,391) |
Number of families with income $40k - 50k:| North Cleveland: | 9.3% (282) |
| State: | 11.7% (11,827) |
Number of families with income $50k - 60k:| North Cleveland: | 7.3% (220) |
| State: | 9.7% (9,746) |
Number of families with income $60k - 75k:| North Cleveland: | 20.6% (621) |
| State: | 12.9% (13,025) |
Number of families with income $75k - 100k:| North Cleveland: | 8.9% (267) |
| State: | 13.1% (13,152) |
Number of families with income $100k - 125k:| North Cleveland: | 11.4% (345) |
| State: | 8.2% (8,262) |
Number of families with income $125k - 150k:| North Cleveland: | 9.1% (275) |
| State: | 4.6% (4,629) |
Number of families with income $150k - 200k:| North Cleveland: | 5.8% (175) |
| Oklahoma: | 3.9% (3,936) |
Number of families with income > $200k:| North Cleveland: | 1.7% (50) |
| State: | 3.6% (3,637) |
Median non-family income in North Cleveland in 2022:| North Cleveland: | $54,608 |
| Oklahoma: | $33,093 |
Change in median non-family income between 2000 and 2022:| North Cleveland, Oklahoma: | +73.8% |
| State: | +64.0% |
Median per capita income in North Cleveland in 2022:| North Cleveland: | $26,049 |
| Oklahoma: | $19,473 |
Change in median per capita income between 2000 and 2022:| North Cleveland, Oklahoma: | +58.1% |
| Oklahoma: | +97.3% |
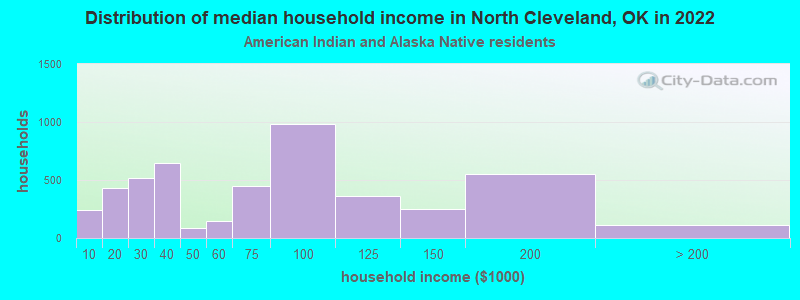
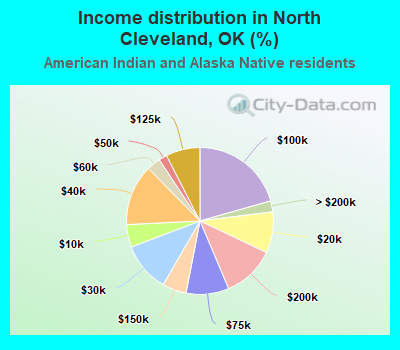
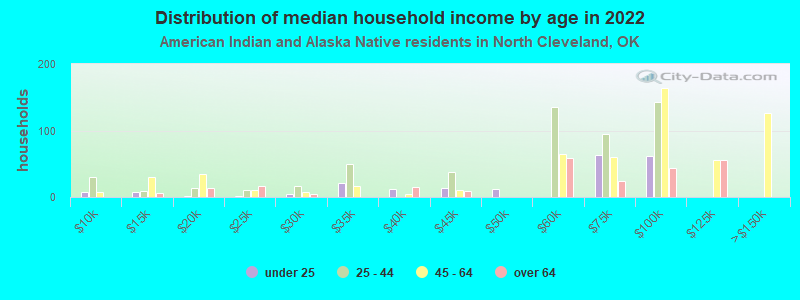
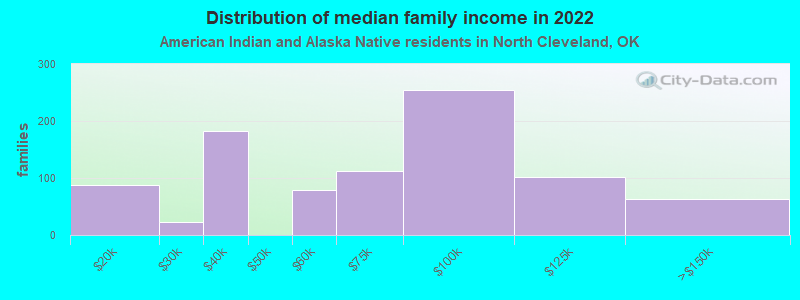
Income statistics for American Indian and Alaska Native residents
Median household income in North Cleveland, OK in 2022:| North Cleveland: | $90,425 |
| State: | $53,261 |
Change in median household income between 2000 and 2022:| North Cleveland, Oklahoma: | +123.3% |
| State: | +94.7% |
Number of households with income < $10k:| North Cleveland: | 5.0% (239) |
| State: | 8.0% (7,959) |
Number of households with income $10k - 20k:| North Cleveland: | 9.0% (433) |
| State: | 11.2% (11,175) |
Number of households with income $20k - 30k:| North Cleveland: | 10.9% (521) |
| State: | 9.7% (9,654) |
Number of households with income $30k - 40k:| North Cleveland: | 13.4% (643) |
| State: | 9.1% (9,092) |
Number of households with income $40k - 50k:| North Cleveland: | 1.8% (86) |
| State: | 9.1% (9,020) |
Number of households with income $50k - 60k:| North Cleveland: | 3.0% (144) |
| State: | 8.8% (8,714) |
Number of households with income $60k - 75k:| North Cleveland: | 9.4% (450) |
| Oklahoma: | 10.7% (10,616) |
Number of households with income $75k - 100k:| North Cleveland: | 20.6% (986) |
| Oklahoma: | 11.5% (11,402) |
Number of households with income $100k - 125k:| North Cleveland: | 7.5% (360) |
| Oklahoma: | 8.8% (8,769) |
Number of households with income $125k - 150k:| North Cleveland: | 5.3% (253) |
| State: | 5.0% (4,965) |
Number of households with income $150k - 200k:| North Cleveland: | 11.6% (555) |
| State: | 4.5% (4,512) |
Number of households with income > $200k:| North Cleveland: | 2.4% (115) |
| State: | 3.6% (3,569) |
Aggregate household income in North Cleveland in 2022: $133,370,967
Median family income in North Cleveland in 2022:| North Cleveland: | $91,209 |
| State: | $61,590 |
Number of families with income $10k - 20k:| North Cleveland: | 9.6% (87) |
| Oklahoma: | 6.3% (4,189) |
Number of families with income $20k - 30k:| North Cleveland: | 2.4% (22) |
| State: | 7.3% (4,840) |
Number of families with income $30k - 40k:| North Cleveland: | 20.2% (182) |
| State: | 8.6% (5,712) |
Number of families with income $50k - 60k:| North Cleveland: | 8.8% (79) |
| State: | 9.9% (6,556) |
Number of families with income $60k - 75k:| North Cleveland: | 12.4% (112) |
| State: | 10.8% (7,198) |
Number of families with income $75k - 100k:| North Cleveland: | 28.3% (255) |
| Oklahoma: | 12.8% (8,500) |
Number of families with income $100k - 125k:| North Cleveland: | 11.2% (101) |
| State: | 10.6% (7,043) |
Number of families with income $125k - 150k:| North Cleveland: | 7.0% (63) |
| State: | 6.5% (4,331) |
Median non-family income in North Cleveland in 2022:| North Cleveland: | $39,554 |
| Oklahoma: | $30,288 |
Change in median non-family income between 2000 and 2022:| North Cleveland, Oklahoma: | +93.6% |
| State: | +92.2% |
Median per capita income in North Cleveland in 2022:| North Cleveland: | $28,722 |
| State: | $25,549 |
Change in median per capita income between 2000 and 2022:| North Cleveland, Oklahoma: | +84.5% |
| Oklahoma: | +118.7% |
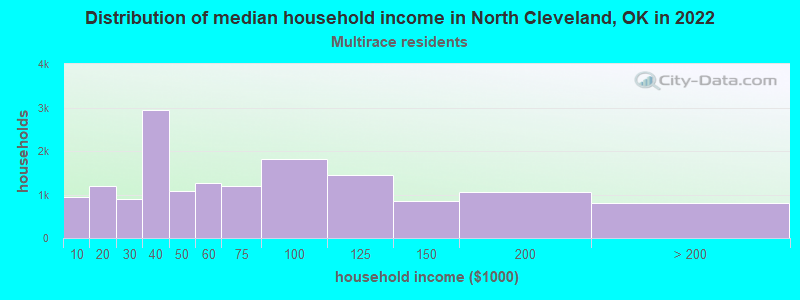
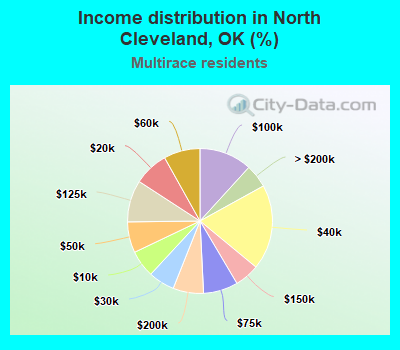
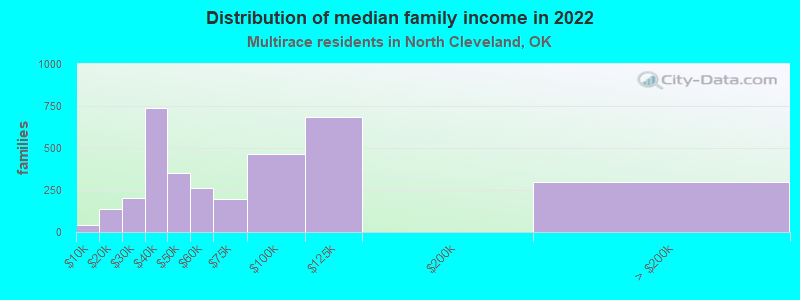
Income statistics for Multirace residents
Median household income in North Cleveland, OK in 2022:| North Cleveland: | $66,978 |
| State: | $53,626 |
Change in median household income between 2000 and 2022:| North Cleveland, Oklahoma: | +49.8% |
| State: | +81.7% |
Number of households with income < $10k:| North Cleveland: | 6.0% (935) |
| State: | 6.8% (11,975) |
Number of households with income $10k - 20k:| North Cleveland: | 7.7% (1,198) |
| State: | 8.9% (15,797) |
Number of households with income $20k - 30k:| North Cleveland: | 5.9% (908) |
| State: | 10.2% (18,071) |
Number of households with income $30k - 40k:| North Cleveland: | 19.0% (2,949) |
| State: | 11.0% (19,477) |
Number of households with income $40k - 50k:| North Cleveland: | 6.9% (1,070) |
| State: | 9.3% (16,501) |
Number of households with income $50k - 60k:| North Cleveland: | 8.1% (1,257) |
| State: | 8.9% (15,635) |
Number of households with income $60k - 75k:| North Cleveland: | 7.7% (1,197) |
| State: | 10.9% (19,250) |
Number of households with income $75k - 100k:| North Cleveland: | 11.8% (1,825) |
| Oklahoma: | 11.5% (20,279) |
Number of households with income $100k - 125k:| North Cleveland: | 9.4% (1,451) |
| State: | 8.0% (14,067) |
Number of households with income $125k - 150k:| North Cleveland: | 5.5% (855) |
| Oklahoma: | 4.9% (8,612) |
Number of households with income $150k - 200k:| North Cleveland: | 6.8% (1,057) |
| State: | 5.0% (8,897) |
Number of households with income > $200k:| North Cleveland: | 5.2% (807) |
| State: | 4.5% (7,970) |
Aggregate household income in North Cleveland in 2022: $447,873,214
Median family income in North Cleveland in 2022:| North Cleveland: | $70,100 |
| State: | $62,946 |
Number of families with income < $10k:| North Cleveland: | 1.3% (44) |
| State: | 5.1% (6,084) |
Number of families with income $10k - 20k:| North Cleveland: | 4.1% (137) |
| State: | 6.9% (8,220) |
Number of families with income $20k - 30k:| North Cleveland: | 6.1% (205) |
| Oklahoma: | 7.7% (9,202) |
Number of families with income $30k - 40k:| North Cleveland: | 21.9% (740) |
| Oklahoma: | 10.8% (12,890) |
Number of families with income $40k - 50k:| North Cleveland: | 10.5% (354) |
| State: | 9.6% (11,468) |
Number of families with income $50k - 60k:| North Cleveland: | 7.7% (260) |
| State: | 7.7% (9,220) |
Number of families with income $60k - 75k:| North Cleveland: | 5.9% (198) |
| State: | 11.3% (13,582) |
Number of families with income $75k - 100k:| North Cleveland: | 13.8% (467) |
| Oklahoma: | 13.1% (15,759) |
Number of families with income $100k - 125k:| North Cleveland: | 20.2% (682) |
| Oklahoma: | 10.2% (12,250) |
Number of families with income > $200k:| North Cleveland: | 8.7% (296) |
| State: | 5.7% (6,851) |
Median non-family income in North Cleveland in 2022:| North Cleveland: | $50,237 |
| State: | $34,773 |
Change in median non-family income between 2000 and 2022:| North Cleveland, Oklahoma: | +87.7% |
| State: | +103.1% |
Median per capita income in North Cleveland in 2022:| North Cleveland: | $24,717 |
| State: | $23,085 |
Change in median per capita income between 2000 and 2022:| North Cleveland, Oklahoma: | +68.2% |
| State: | +93.8% |
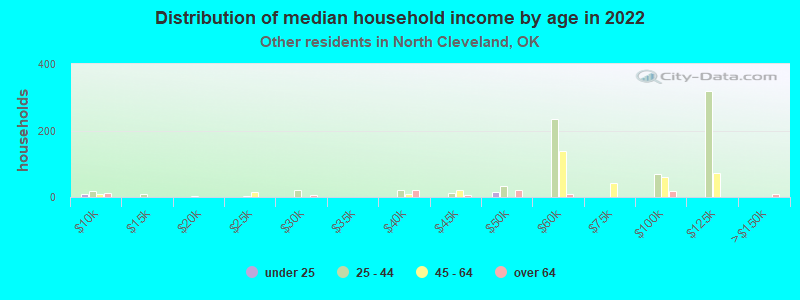
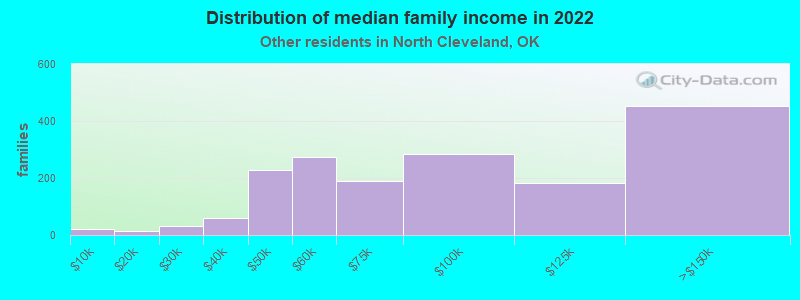
Income statistics for other residents
Number of households with income < $10k:| North Cleveland: | 7.7% (105) |
| State: | 8.1% (3,420) |
Number of households with income $10k - 20k:| North Cleveland: | 10.0% (136) |
| State: | 8.6% (3,635) |
Number of households with income $20k - 30k:| North Cleveland: | 8.1% (111) |
| Oklahoma: | 9.0% (3,808) |
Number of households with income $30k - 40k:| North Cleveland: | 8.3% (114) |
| State: | 11.4% (4,791) |
Number of households with income $40k - 50k:| North Cleveland: | 9.2% (125) |
| State: | 10.1% (4,256) |
Number of households with income $50k - 60k:| North Cleveland: | 11.6% (159) |
| Oklahoma: | 11.7% (4,946) |
Number of households with income $60k - 75k:| North Cleveland: | 14.8% (202) |
| State: | 12.7% (5,342) |
Number of households with income $75k - 100k:| North Cleveland: | 13.7% (187) |
| Oklahoma: | 11.4% (4,792) |
Number of households with income $100k - 125k:| North Cleveland: | 6.4% (88) |
| Oklahoma: | 6.1% (2,568) |
Number of households with income $125k - 150k:| North Cleveland: | 4.7% (64) |
| Oklahoma: | 5.4% (2,298) |
Number of households with income $150k - 200k:| North Cleveland: | 3.4% (46) |
| Oklahoma: | 3.4% (1,427) |
Number of households with income > $200k:| North Cleveland: | 2.1% (29) |
| State: | 2.2% (918) |
Aggregate household income in North Cleveland in 2022: $82,105,544
Median family income in North Cleveland in 2022:| North Cleveland: | $64,068 |
| State: | $55,625 |
Number of families with income < $10k:| North Cleveland: | 1.3% (22) |
| State: | 5.7% (1,864) |
Number of families with income $10k - 20k:| North Cleveland: | 0.8% (14) |
| State: | 6.8% (2,219) |
Number of families with income $20k - 30k:| North Cleveland: | 1.9% (33) |
| Oklahoma: | 8.5% (2,761) |
Number of families with income $30k - 40k:| North Cleveland: | 3.4% (59) |
| Oklahoma: | 11.1% (3,618) |
Number of families with income $40k - 50k:| North Cleveland: | 13.2% (228) |
| Oklahoma: | 11.6% (3,768) |
Number of families with income $50k - 60k:| North Cleveland: | 15.8% (273) |
| State: | 12.4% (4,039) |
Number of families with income $60k - 75k:| North Cleveland: | 10.9% (189) |
| State: | 13.0% (4,231) |
Number of families with income $75k - 100k:| North Cleveland: | 16.3% (283) |
| State: | 11.5% (3,726) |
Number of families with income $100k - 125k:| North Cleveland: | 10.4% (181) |
| State: | 6.3% (2,046) |
Number of families with income $125k - 150k:| North Cleveland: | 26.0% (451) |
| Oklahoma: | 6.4% (2,088) |
Median non-family income in North Cleveland in 2022:| North Cleveland: | $53,777 |
| Oklahoma: | $28,279 |
Change in median non-family income between 2000 and 2022:| North Cleveland, Oklahoma: | +30.0% |
| State: | +38.2% |
Median per capita income in North Cleveland in 2022:| North Cleveland: | $25,905 |
| State: | $21,007 |
Change in median per capita income between 2000 and 2022:| North Cleveland, Oklahoma: | +71.3% |
| Oklahoma: | +119.2% |