Northwest Osage, Oklahoma (OK) income map, earnings map, and wages data
The median household income in Northwest Osage, OK in 2022 was $53,396, which was 11.8% less than the median annual income of $59,673 across the entire state of Oklahoma. Compared to the median income of $29,596 in 2000 this represents an increase of 44.6%. The per capita income in 2022 was $31,901, which means an increase of 47.0% compared to 2000 when it was $16,903.
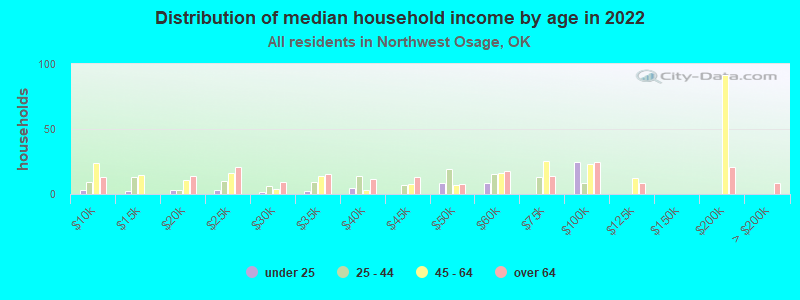
Income statistics for all residents
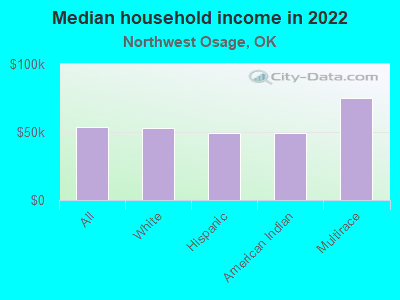
Median household income in Northwest Osage, OK in 2022:| Northwest Osage: | $53,397 |
| State: | $59,673 |
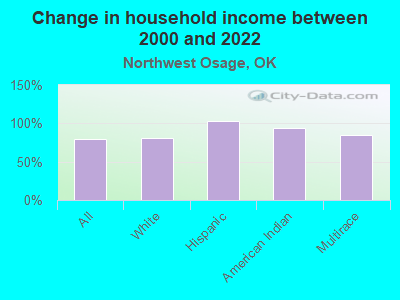
Change in median household income between 2000 and 2022:| Northwest Osage, Oklahoma: | +80.4% |
| State: | +78.7% |
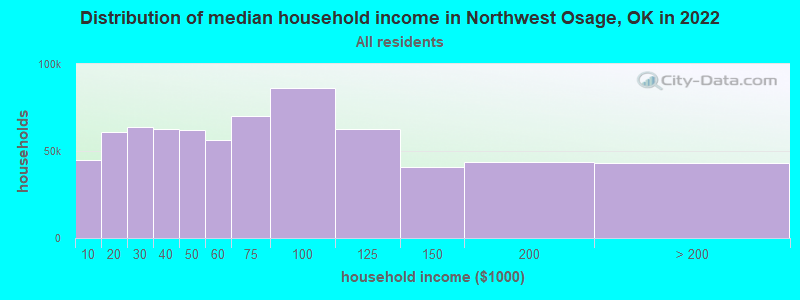
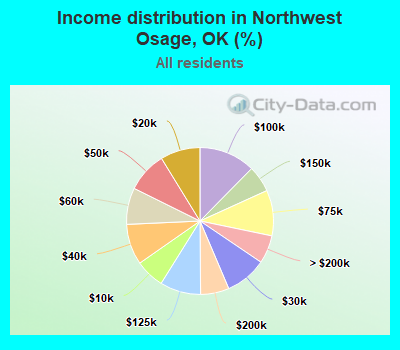
Number of households with income < $10k:| Northwest Osage: | 6.4% (44,709) |
| State: | 6.4% (100,950) |
Number of households with income $10k - 20k:| Northwest Osage: | 8.8% (61,013) |
| State: | 8.8% (137,709) |
Number of households with income $20k - 30k:| Northwest Osage: | 9.1% (63,640) |
| Oklahoma: | 9.1% (143,661) |
Number of households with income $30k - 40k:| Northwest Osage: | 9.0% (62,505) |
| State: | 9.0% (141,098) |
Number of households with income $40k - 50k:| Northwest Osage: | 8.9% (62,102) |
| State: | 8.9% (140,217) |
Number of households with income $50k - 60k:| Northwest Osage: | 8.1% (56,212) |
| State: | 8.1% (126,882) |
Number of households with income $60k - 75k:| Northwest Osage: | 10.0% (69,972) |
| State: | 10.0% (157,916) |
Number of households with income $75k - 100k:| Northwest Osage: | 12.4% (86,409) |
| Oklahoma: | 12.4% (195,015) |
Number of households with income $100k - 125k:| Northwest Osage: | 9.0% (62,826) |
| Oklahoma: | 9.0% (141,779) |
Number of households with income $125k - 150k:| Northwest Osage: | 5.8% (40,580) |
| State: | 5.8% (91,594) |
Number of households with income $150k - 200k:| Northwest Osage: | 6.3% (43,680) |
| Oklahoma: | 6.3% (98,589) |
Number of households with income > $200k:| Northwest Osage: | 6.2% (43,312) |
| Oklahoma: | 6.2% (97,770) |
Aggregate household income in Northwest Osage in 2022: $819,279,556
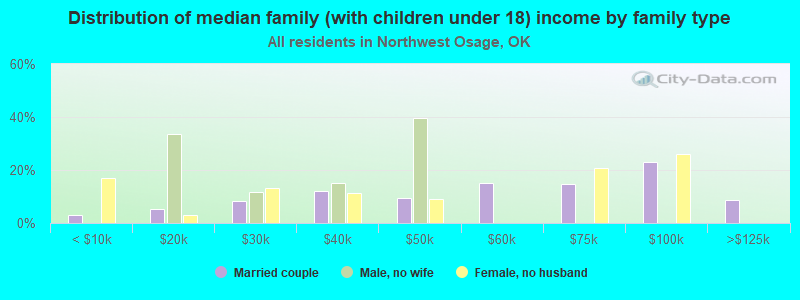
Median family income in Northwest Osage in 2022:| Northwest Osage: | $62,300 |
| State: | $75,476 |
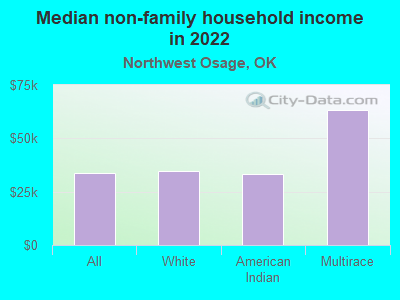
Median non-family income in Northwest Osage in 2022:| Northwest Osage: | $33,831 |
| Oklahoma: | $35,419 |
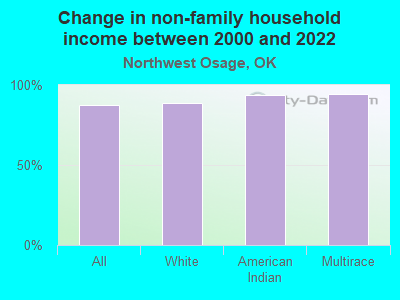
Change in median non-family income between 2000 and 2022:| Northwest Osage, Oklahoma: | +87.2% |
| Oklahoma: | +83.2% |
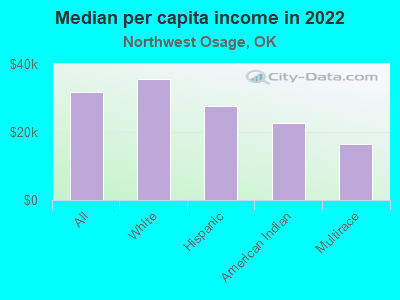
Median per capita income in Northwest Osage in 2022:| Northwest Osage: | $31,902 |
| State: | $32,930 |
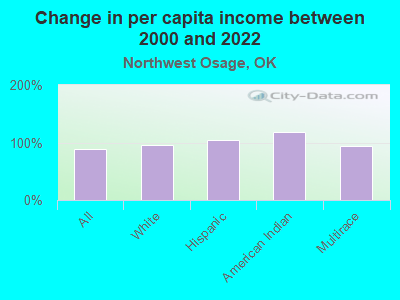
Change in median per capita income between 2000 and 2022:| Northwest Osage, Oklahoma: | +88.7% |
| State: | +86.6% |
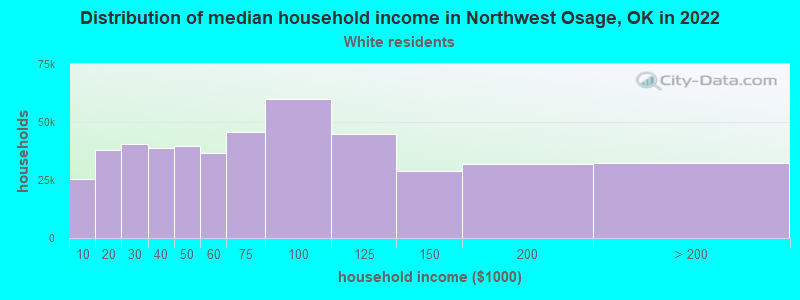
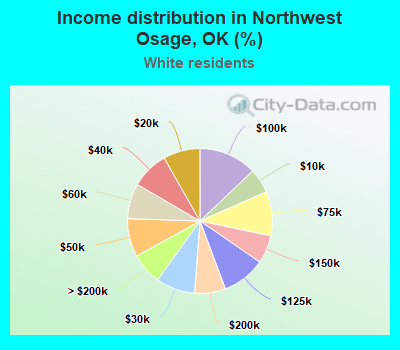
Income statistics for White residents
Median household income in Northwest Osage, OK in 2022:| Northwest Osage: | $53,152 |
| State: | $63,444 |
Change in median household income between 2000 and 2022:| Northwest Osage, Oklahoma: | +80.9% |
| Oklahoma: | +79.3% |
Number of households with income < $10k:| Northwest Osage: | 5.5% (25,361) |
| Oklahoma: | 5.5% (60,994) |
Number of households with income $10k - 20k:| Northwest Osage: | 8.2% (37,989) |
| State: | 8.2% (91,263) |
Number of households with income $20k - 30k:| Northwest Osage: | 8.7% (40,351) |
| State: | 8.7% (96,988) |
Number of households with income $30k - 40k:| Northwest Osage: | 8.4% (38,767) |
| State: | 8.4% (93,121) |
Number of households with income $40k - 50k:| Northwest Osage: | 8.6% (39,674) |
| Oklahoma: | 8.6% (95,446) |
Number of households with income $50k - 60k:| Northwest Osage: | 7.9% (36,475) |
| State: | 7.9% (87,723) |
Number of households with income $60k - 75k:| Northwest Osage: | 9.9% (45,792) |
| Oklahoma: | 9.9% (109,955) |
Number of households with income $75k - 100k:| Northwest Osage: | 12.9% (59,874) |
| State: | 12.9% (143,880) |
Number of households with income $100k - 125k:| Northwest Osage: | 9.7% (44,893) |
| State: | 9.7% (107,851) |
Number of households with income $125k - 150k:| Northwest Osage: | 6.3% (29,039) |
| State: | 6.3% (69,802) |
Number of households with income $150k - 200k:| Northwest Osage: | 6.9% (31,952) |
| State: | 6.9% (76,863) |
Number of households with income > $200k:| Northwest Osage: | 7.0% (32,466) |
| State: | 7.0% (78,099) |
Aggregate household income in Northwest Osage in 2022: $548,721,478
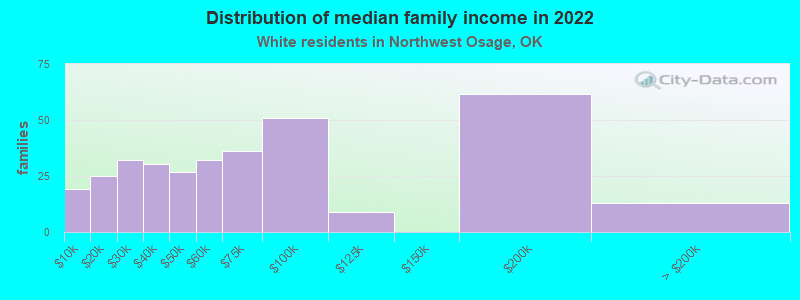
Median family income in Northwest Osage in 2022:| Northwest Osage: | $62,268 |
| Oklahoma: | $82,251 |
Number of families with income < $10k:| Northwest Osage: | 5.7% (19) |
| State: | 3.4% (24,057) |
Number of families with income $10k - 20k:| Northwest Osage: | 7.5% (25) |
| State: | 4.1% (29,440) |
Number of families with income $20k - 30k:| Northwest Osage: | 9.5% (32) |
| State: | 5.7% (40,670) |
Number of families with income $30k - 40k:| Northwest Osage: | 9.0% (30) |
| Oklahoma: | 6.5% (46,540) |
Number of families with income $40k - 50k:| Northwest Osage: | 8.0% (27) |
| Oklahoma: | 7.7% (55,082) |
Number of families with income $50k - 60k:| Northwest Osage: | 9.6% (32) |
| Oklahoma: | 7.5% (53,408) |
Number of families with income $60k - 75k:| Northwest Osage: | 10.8% (36) |
| State: | 10.4% (74,624) |
Number of families with income $75k - 100k:| Northwest Osage: | 15.1% (51) |
| Oklahoma: | 15.3% (109,679) |
Number of families with income $100k - 125k:| Northwest Osage: | 2.6% (9) |
| State: | 12.0% (86,208) |
Number of families with income $150k - 200k:| Northwest Osage: | 18.3% (61) |
| State: | 9.4% (67,640) |
Number of families with income > $200k:| Northwest Osage: | 3.8% (13) |
| State: | 9.7% (69,551) |
Median non-family income in Northwest Osage in 2022:| Northwest Osage: | $34,547 |
| State: | $36,941 |
Change in median non-family income between 2000 and 2022:| Northwest Osage, Oklahoma: | +88.8% |
| Oklahoma: | +83.5% |
Median per capita income in Northwest Osage in 2022:| Northwest Osage: | $35,643 |
| Oklahoma: | $37,390 |
Change in median per capita income between 2000 and 2022:| Northwest Osage, Oklahoma: | +94.7% |
| State: | +92.4% |
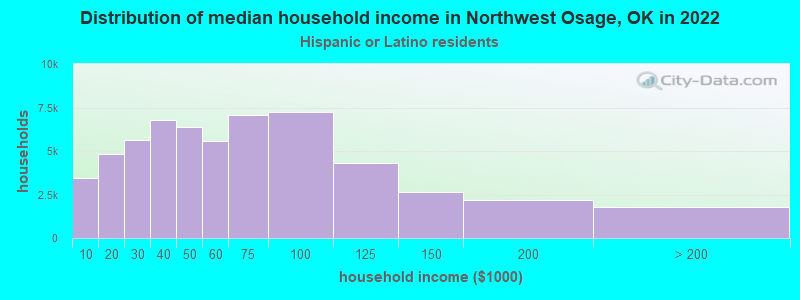
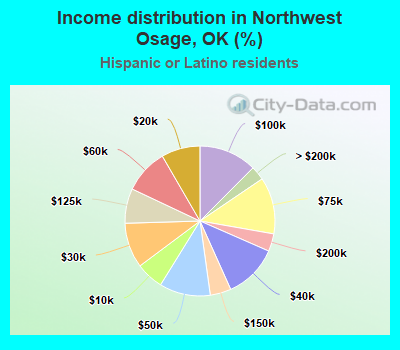
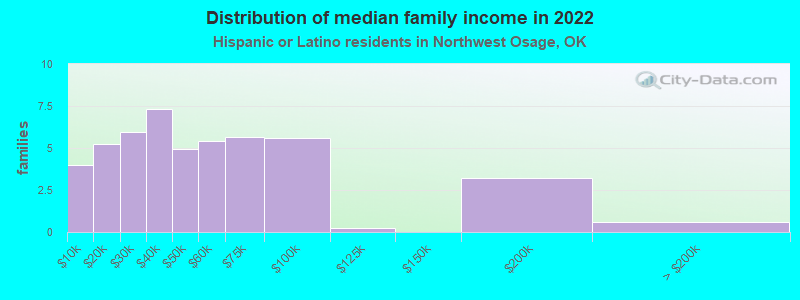
Income statistics for Hispanic or Latino residents
Median household income in Northwest Osage, OK in 2022:| Northwest Osage: | $49,126 |
| State: | $52,856 |
Change in median household income between 2000 and 2022:| Northwest Osage, Oklahoma: | +103.3% |
| State: | +89.4% |
Number of households with income < $10k:| Northwest Osage: | 6.0% (3,446) |
| Oklahoma: | 6.0% (7,958) |
Number of households with income $10k - 20k:| Northwest Osage: | 8.4% (4,830) |
| State: | 8.4% (11,153) |
Number of households with income $20k - 30k:| Northwest Osage: | 9.7% (5,630) |
| State: | 9.7% (13,003) |
Number of households with income $30k - 40k:| Northwest Osage: | 11.7% (6,765) |
| State: | 11.7% (15,624) |
Number of households with income $40k - 50k:| Northwest Osage: | 11.0% (6,364) |
| Oklahoma: | 11.0% (14,697) |
Number of households with income $50k - 60k:| Northwest Osage: | 9.6% (5,556) |
| Oklahoma: | 9.6% (12,832) |
Number of households with income $60k - 75k:| Northwest Osage: | 12.2% (7,066) |
| State: | 12.2% (16,321) |
Number of households with income $75k - 100k:| Northwest Osage: | 12.5% (7,214) |
| State: | 12.5% (16,668) |
Number of households with income $100k - 125k:| Northwest Osage: | 7.5% (4,324) |
| State: | 7.5% (9,988) |
Number of households with income $125k - 150k:| Northwest Osage: | 4.5% (2,616) |
| State: | 4.5% (6,042) |
Number of households with income $150k - 200k:| Northwest Osage: | 3.8% (2,199) |
| Oklahoma: | 3.8% (5,080) |
Number of households with income > $200k:| Northwest Osage: | 3.0% (1,759) |
| Oklahoma: | 3.0% (4,063) |
Aggregate household income in Northwest Osage in 2022: $2,667,199
Median family income in Northwest Osage in 2022:| Northwest Osage: | $49,955 |
| State: | $55,896 |
Number of families with income < $10k:| Northwest Osage: | 8.2% (4) |
| Oklahoma: | 5.1% (5,166) |
Number of families with income $10k - 20k:| Northwest Osage: | 10.9% (5) |
| State: | 6.4% (6,492) |
Number of families with income $20k - 30k:| Northwest Osage: | 12.3% (6) |
| Oklahoma: | 8.4% (8,466) |
Number of families with income $30k - 40k:| Northwest Osage: | 15.2% (7) |
| State: | 12.3% (12,391) |
Number of families with income $40k - 50k:| Northwest Osage: | 10.3% (5) |
| Oklahoma: | 11.7% (11,827) |
Number of families with income $50k - 60k:| Northwest Osage: | 11.2% (5) |
| Oklahoma: | 9.7% (9,746) |
Number of families with income $60k - 75k:| Northwest Osage: | 11.7% (6) |
| Oklahoma: | 12.9% (13,025) |
Number of families with income $75k - 100k:| Northwest Osage: | 11.6% (6) |
| State: | 13.1% (13,152) |
Number of families with income $100k - 125k:| Northwest Osage: | 0.5% (0) |
| State: | 8.2% (8,262) |
Number of families with income $150k - 200k:| Northwest Osage: | 6.7% (3) |
| State: | 3.9% (3,936) |
Number of families with income > $200k:| Northwest Osage: | 1.3% (1) |
| Oklahoma: | 3.6% (3,637) |
Median per capita income in Northwest Osage in 2022:| Northwest Osage: | $27,685 |
| State: | $19,473 |
Change in median per capita income between 2000 and 2022:| Northwest Osage, Oklahoma: | +104.2% |
| State: | +97.3% |
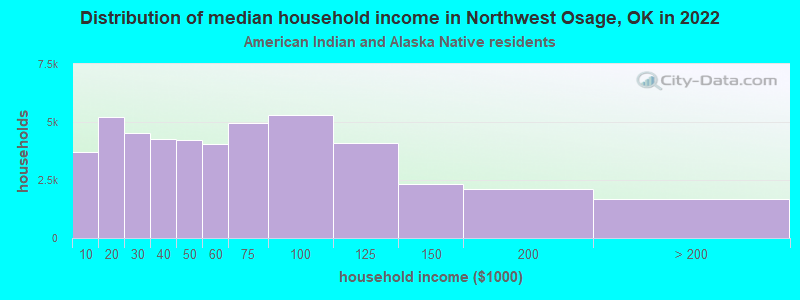
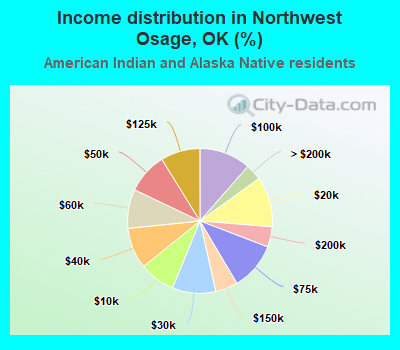
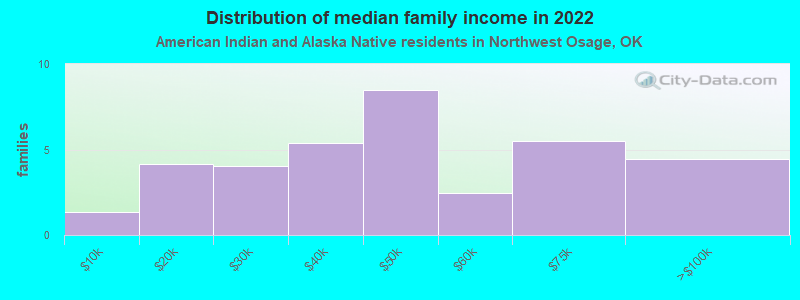
Income statistics for American Indian and Alaska Native residents
Median household income in Northwest Osage, OK in 2022:| Northwest Osage: | $49,588 |
| Oklahoma: | $53,261 |
Change in median household income between 2000 and 2022:| Northwest Osage, Oklahoma: | +93.5% |
| Oklahoma: | +94.7% |
Number of households with income < $10k:| Northwest Osage: | 8.0% (3,717) |
| State: | 8.0% (7,959) |
Number of households with income $10k - 20k:| Northwest Osage: | 11.2% (5,209) |
| Oklahoma: | 11.2% (11,175) |
Number of households with income $20k - 30k:| Northwest Osage: | 9.7% (4,509) |
| State: | 9.7% (9,654) |
Number of households with income $30k - 40k:| Northwest Osage: | 9.2% (4,250) |
| State: | 9.1% (9,092) |
Number of households with income $40k - 50k:| Northwest Osage: | 9.1% (4,218) |
| Oklahoma: | 9.1% (9,020) |
Number of households with income $50k - 60k:| Northwest Osage: | 8.7% (4,052) |
| State: | 8.8% (8,714) |
Number of households with income $60k - 75k:| Northwest Osage: | 10.7% (4,955) |
| State: | 10.7% (10,616) |
Number of households with income $75k - 100k:| Northwest Osage: | 11.5% (5,322) |
| State: | 11.5% (11,402) |
Number of households with income $100k - 125k:| Northwest Osage: | 8.8% (4,088) |
| Oklahoma: | 8.8% (8,769) |
Number of households with income $125k - 150k:| Northwest Osage: | 5.0% (2,323) |
| Oklahoma: | 5.0% (4,965) |
Number of households with income $150k - 200k:| Northwest Osage: | 4.5% (2,103) |
| Oklahoma: | 4.5% (4,512) |
Number of households with income > $200k:| Northwest Osage: | 3.6% (1,671) |
| Oklahoma: | 3.6% (3,569) |
Aggregate household income in Northwest Osage in 2022: $5,277,440
Median family income in Northwest Osage in 2022:| Northwest Osage: | $62,503 |
| State: | $61,590 |
Number of families with income < $10k:| Northwest Osage: | 3.7% (1) |
| State: | 7.2% (4,788) |
Number of families with income $10k - 20k:| Northwest Osage: | 11.6% (4) |
| Oklahoma: | 6.3% (4,189) |
Number of families with income $20k - 30k:| Northwest Osage: | 11.2% (4) |
| Oklahoma: | 7.3% (4,840) |
Number of families with income $30k - 40k:| Northwest Osage: | 15.0% (5) |
| State: | 8.6% (5,712) |
Number of families with income $40k - 50k:| Northwest Osage: | 23.8% (9) |
| State: | 9.6% (6,398) |
Number of families with income $50k - 60k:| Northwest Osage: | 6.9% (2) |
| State: | 9.9% (6,556) |
Number of families with income $60k - 75k:| Northwest Osage: | 15.3% (5) |
| State: | 10.8% (7,198) |
Number of families with income $75k - 100k:| Northwest Osage: | 12.4% (4) |
| State: | 12.8% (8,500) |
Median non-family income in Northwest Osage in 2022:| Northwest Osage: | $33,192 |
| Oklahoma: | $30,288 |
Change in median non-family income between 2000 and 2022:| Northwest Osage, Oklahoma: | +93.6% |
| Oklahoma: | +92.2% |
Median per capita income in Northwest Osage in 2022:| Northwest Osage: | $22,553 |
| Oklahoma: | $25,549 |
Change in median per capita income between 2000 and 2022:| Northwest Osage, Oklahoma: | +118.8% |
| State: | +118.7% |
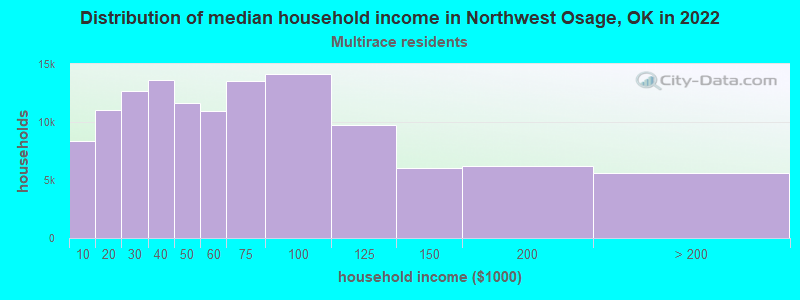
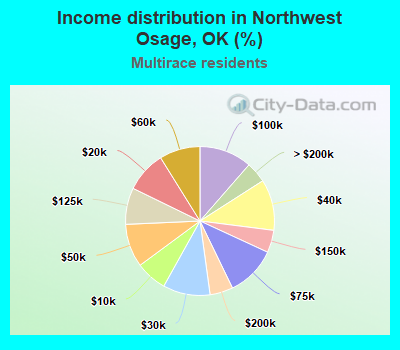
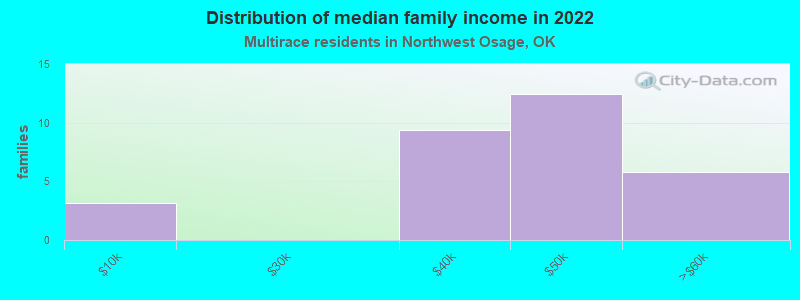
Income statistics for Multirace residents
Median household income in Northwest Osage, OK in 2022:| Northwest Osage: | $75,220 |
| State: | $53,626 |
Change in median household income between 2000 and 2022:| Northwest Osage, Oklahoma: | +85.2% |
| State: | +81.7% |
Number of households with income < $10k:| Northwest Osage: | 6.8% (8,387) |
| State: | 6.8% (11,975) |
Number of households with income $10k - 20k:| Northwest Osage: | 8.9% (10,992) |
| State: | 8.9% (15,797) |
Number of households with income $20k - 30k:| Northwest Osage: | 10.3% (12,650) |
| State: | 10.2% (18,071) |
Number of households with income $30k - 40k:| Northwest Osage: | 11.1% (13,663) |
| Oklahoma: | 11.0% (19,477) |
Number of households with income $40k - 50k:| Northwest Osage: | 9.4% (11,600) |
| State: | 9.3% (16,501) |
Number of households with income $50k - 60k:| Northwest Osage: | 8.9% (10,925) |
| Oklahoma: | 8.9% (15,635) |
Number of households with income $60k - 75k:| Northwest Osage: | 10.9% (13,498) |
| State: | 10.9% (19,250) |
Number of households with income $75k - 100k:| Northwest Osage: | 11.4% (14,095) |
| State: | 11.5% (20,279) |
Number of households with income $100k - 125k:| Northwest Osage: | 7.9% (9,784) |
| Oklahoma: | 8.0% (14,067) |
Number of households with income $125k - 150k:| Northwest Osage: | 4.9% (6,008) |
| Oklahoma: | 4.9% (8,612) |
Number of households with income $150k - 200k:| Northwest Osage: | 5.0% (6,171) |
| State: | 5.0% (8,897) |
Number of households with income > $200k:| Northwest Osage: | 4.5% (5,563) |
| State: | 4.5% (7,970) |
Aggregate household income in Northwest Osage in 2022: $3,960,513
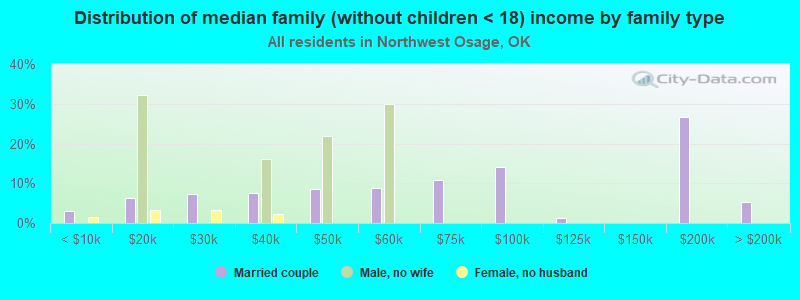
Median family income in Northwest Osage in 2022:| Northwest Osage: | $76,280 |
| Oklahoma: | $62,946 |
Number of families with income < $10k:| Northwest Osage: | 10.3% (3) |
| State: | 5.1% (6,084) |
Number of families with income $30k - 40k:| Northwest Osage: | 30.5% (9) |
| Oklahoma: | 10.8% (12,890) |
Number of families with income $40k - 50k:| Northwest Osage: | 40.4% (12) |
| State: | 9.6% (11,468) |
Number of families with income $50k - 60k:| Northwest Osage: | 18.8% (6) |
| State: | 7.7% (9,220) |
Median non-family income in Northwest Osage in 2022:| Northwest Osage: | $63,144 |
| State: | $34,773 |
Change in median non-family income between 2000 and 2022:| Northwest Osage, Oklahoma: | +94.3% |
| State: | +103.1% |
Median per capita income in Northwest Osage in 2022:| Northwest Osage: | $16,340 |
| Oklahoma: | $23,085 |
Change in median per capita income between 2000 and 2022:| Northwest Osage, Oklahoma: | +94.4% |
| Oklahoma: | +93.8% |