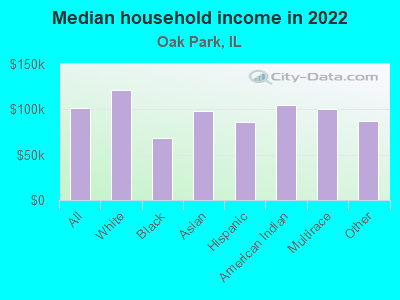
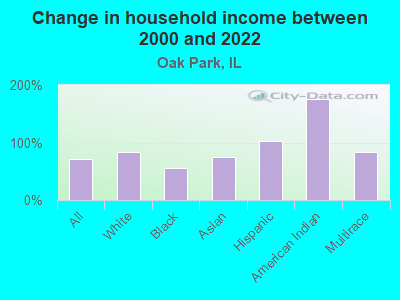
The median household income in Oak Park, IL in 2022 was $101,059, which was 24.1% greater than the median annual income of $76,708 across the entire state of Illinois. Compared to the median income of $59,183 in 2000 this represents an increase of 41.4%. The per capita income in 2022 was $66,655, which means an increase of 45.5% compared to 2000 when it was $36,340.
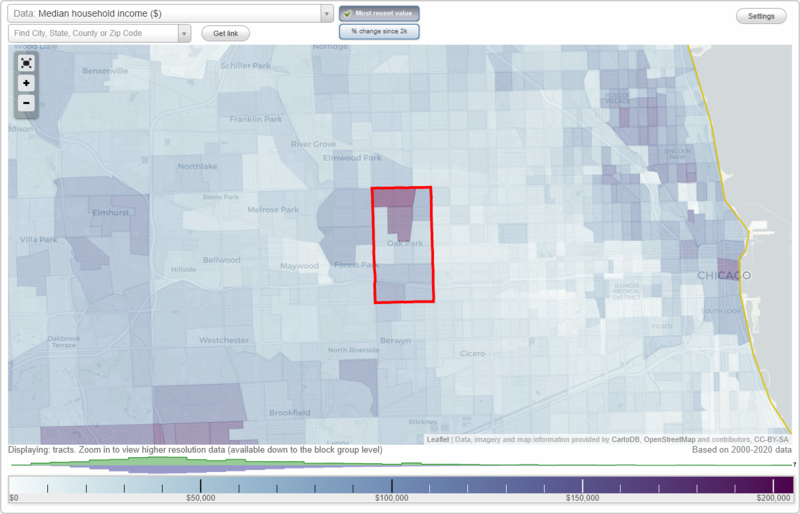
Whole page based on the data from 2000 / 2022 when the population of Oak Park, Illinois was 52,524 / 52,638
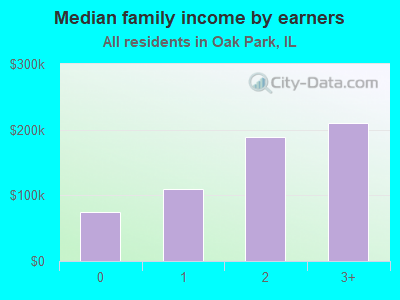
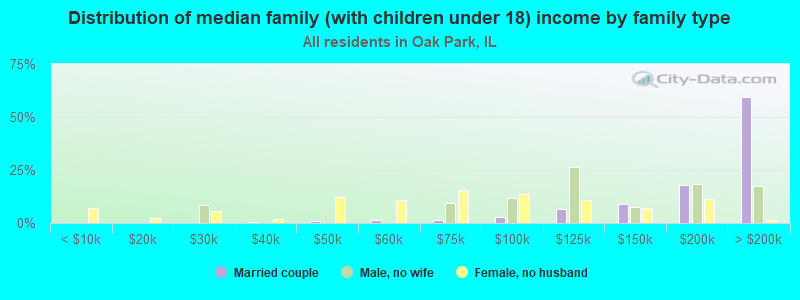
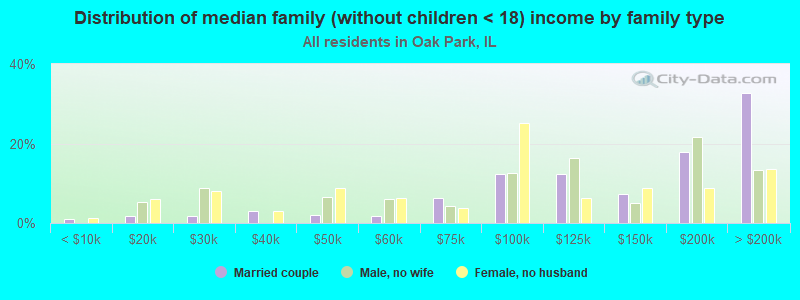
Income statistics for all residents
Median household income in Oak Park, IL in 2022:
Oak Park:
$101,059
Illinois:
$76,708
Change in median household income between 2000 and 2022:
Oak Park, Illinois:
+70.8%
State:
+64.6%
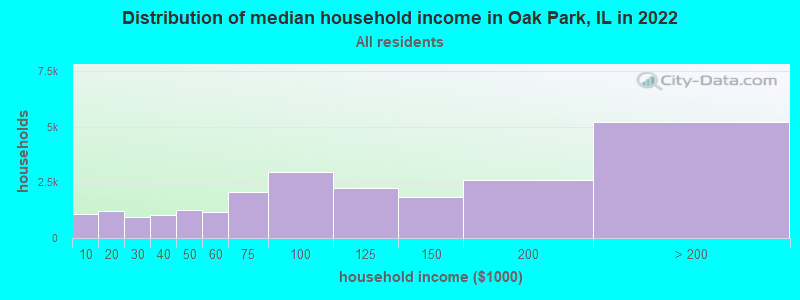
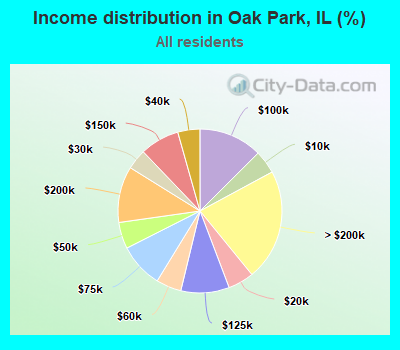
Number of households with income < $10k:
Oak Park:
4.6% (1,088)
Illinois:
5.9% (296,090)
Number of households with income $10k - 20k:
Oak Park:
5.1% (1,212)
State:
6.6% (333,259)
Number of households with income $20k - 30k:
Oak Park:
4.0% (950)
State:
6.8% (342,921)
Number of households with income $30k - 40k:
Oak Park:
4.4% (1,037)
Illinois:
7.0% (355,254)
Number of households with income $40k - 50k:
Oak Park:
5.2% (1,239)
Illinois:
6.7% (340,678)
Number of households with income $50k - 60k:
Oak Park:
5.0% (1,182)
Illinois:
6.7% (339,405)
Number of households with income $60k - 75k:
Oak Park:
8.8% (2,082)
State:
9.2% (465,709)
Number of households with income $75k - 100k:
Oak Park:
12.5% (2,976)
State:
12.9% (651,353)
Number of households with income $100k - 125k:
Oak Park:
9.6% (2,266)
Illinois:
10.3% (522,359)
Number of households with income $125k - 150k:
Oak Park:
7.8% (1,845)
Illinois:
7.3% (367,136)
Number of households with income $150k - 200k:
Oak Park:
11.1% (2,631)
Illinois:
9.0% (455,249)
Number of households with income > $200k:
Oak Park:
22.0% (5,219)
State:
11.6% (586,947)
Aggregate household income in Oak Park in 2022: $3,509,478,070
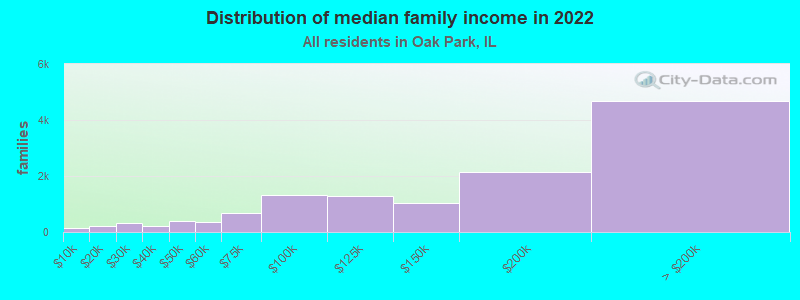
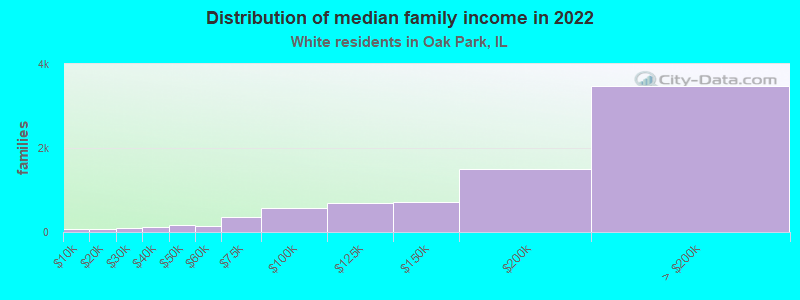
Median family income in Oak Park in 2022:
Oak Park:
$155,453
State:
$96,948
Number of families with income < $10k:
Oak Park:
1.1% (147)
State:
3.4% (105,875)
Number of families with income $10k - 20k:
Oak Park:
1.7% (213)
Illinois:
3.3% (105,017)
Number of families with income $20k - 30k:
Oak Park:
2.5% (318)
Illinois:
4.7% (146,403)
Number of families with income $30k - 40k:
Oak Park:
1.8% (227)
State:
5.3% (167,069)
Number of families with income $40k - 50k:
Oak Park:
3.1% (404)
State:
5.8% (181,164)
Number of families with income $50k - 60k:
Oak Park:
2.9% (374)
Illinois:
6.1% (191,561)
Number of families with income $60k - 75k:
Oak Park:
5.2% (671)
State:
9.0% (282,985)
Number of families with income $75k - 100k:
Oak Park:
10.2% (1,309)
State:
13.8% (432,725)
Number of families with income $100k - 125k:
Oak Park:
10.2% (1,303)
State:
11.9% (373,296)
Number of families with income $125k - 150k:
Oak Park:
8.2% (1,053)
Illinois:
8.9% (279,791)
Number of families with income $150k - 200k:
Oak Park:
16.7% (2,146)
Illinois:
11.9% (372,004)
Number of families with income > $200k:
Oak Park:
36.4% (4,666)
Illinois:
15.9% (500,033)
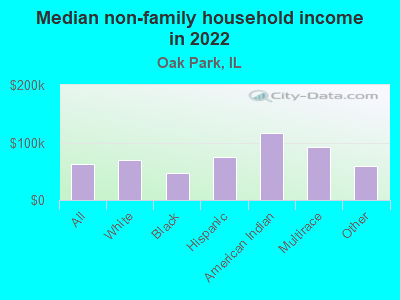
Median non-family income in Oak Park in 2022:
Oak Park:
$63,188
Illinois:
$46,533
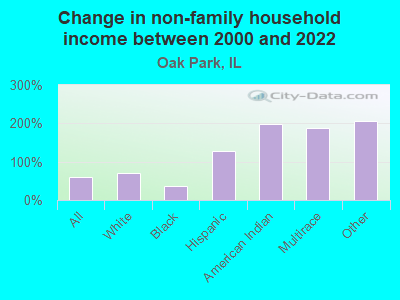
Change in median non-family income between 2000 and 2022:
Oak Park, Illinois:
+61.0%
State:
+64.0%
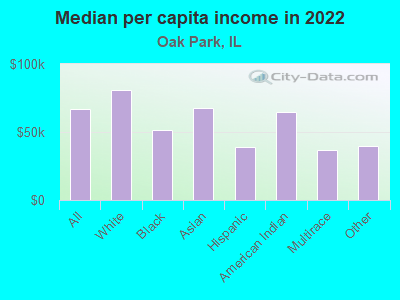
Median per capita income in Oak Park in 2022:
Oak Park:
$66,656
State:
$43,317
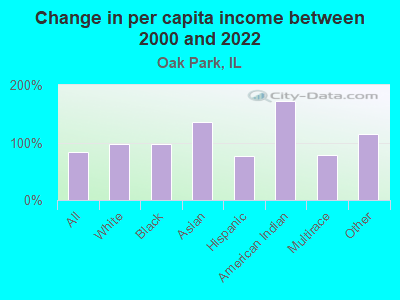
Change in median per capita income between 2000 and 2022:
Oak Park, Illinois:
+83.4%
State:
+87.5%
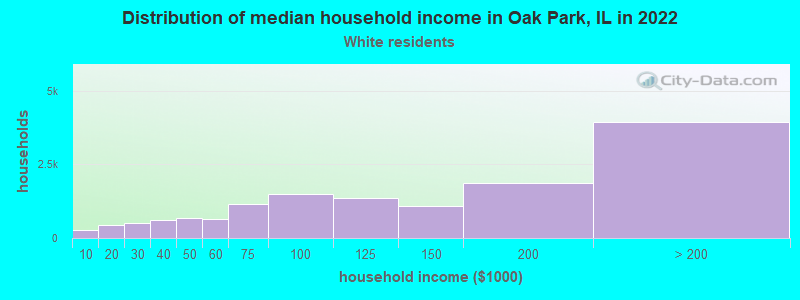
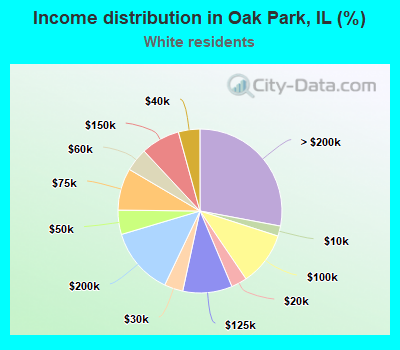
Income statistics for White residents
Median household income in Oak Park, IL in 2022:
Oak Park:
$121,506
State:
$83,346
Change in median household income between 2000 and 2022:
Oak Park, Illinois:
+84.3%
State:
+67.5%
Number of households with income < $10k:
Oak Park:
2.0% (283)
State:
4.5% (149,895)
Number of households with income $10k - 20k:
Oak Park:
3.1% (439)
State:
5.5% (184,529)
Number of households with income $20k - 30k:
Oak Park:
3.7% (520)
State:
6.1% (205,767)
Number of households with income $30k - 40k:
Oak Park:
4.2% (598)
State:
6.7% (225,572)
Number of households with income $40k - 50k:
Oak Park:
4.8% (676)
State:
6.5% (216,965)
Number of households with income $50k - 60k:
Oak Park:
4.6% (645)
State:
6.6% (222,841)
Number of households with income $60k - 75k:
Oak Park:
8.3% (1,169)
State:
9.3% (312,758)
Number of households with income $75k - 100k:
Oak Park:
10.6% (1,489)
State:
12.9% (433,180)
Number of households with income $100k - 125k:
Oak Park:
9.7% (1,373)
State:
10.7% (360,753)
Number of households with income $125k - 150k:
Oak Park:
7.7% (1,085)
State:
7.9% (266,532)
Number of households with income $150k - 200k:
Oak Park:
13.3% (1,873)
State:
10.0% (337,357)
Number of households with income > $200k:
Oak Park:
28.0% (3,940)
State:
13.3% (446,069)
Aggregate household income in Oak Park in 2022: $2,373,652,691
Median family income in Oak Park in 2022:
Oak Park:
$181,590
State:
$107,938
Number of families with income < $10k:
Oak Park:
0.9% (75)
State:
2.2% (45,983)
Number of families with income $10k - 20k:
Oak Park:
0.8% (65)
State:
2.5% (50,574)
Number of families with income $20k - 30k:
Oak Park:
1.2% (98)
Illinois:
3.5% (70,927)
Number of families with income $30k - 40k:
Oak Park:
1.6% (128)
State:
4.4% (90,563)
Number of families with income $40k - 50k:
Oak Park:
2.1% (171)
State:
5.0% (102,597)
Number of families with income $50k - 60k:
Oak Park:
1.8% (146)
Illinois:
5.8% (119,129)
Number of families with income $60k - 75k:
Oak Park:
4.5% (364)
Illinois:
8.8% (179,665)
Number of families with income $75k - 100k:
Oak Park:
7.2% (577)
State:
13.5% (276,887)
Number of families with income $100k - 125k:
Oak Park:
8.5% (684)
Illinois:
12.5% (256,099)
Number of families with income $125k - 150k:
Oak Park:
8.9% (717)
State:
9.8% (199,855)
Number of families with income $150k - 200k:
Oak Park:
18.7% (1,499)
State:
13.4% (274,569)
Number of families with income > $200k:
Oak Park:
43.5% (3,487)
Illinois:
18.6% (381,354)
Median non-family income in Oak Park in 2022:
Oak Park:
$69,566
State:
$50,934
Change in median non-family income between 2000 and 2022:
Oak Park, Illinois:
+69.9%
State:
+70.7%
Median per capita income in Oak Park in 2022:
Oak Park:
$81,190
State:
$50,738
Change in median per capita income between 2000 and 2022:
Oak Park, Illinois:
+96.9%
State:
+95.5%
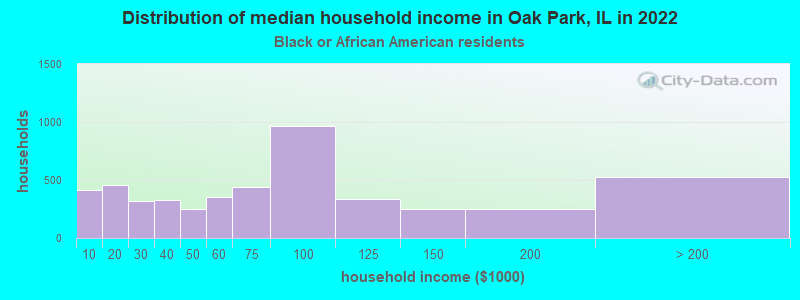
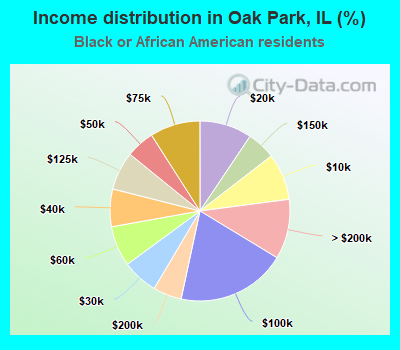
Income statistics for Black or African American residents
Median household income in Oak Park, IL in 2022:
Oak Park:
$68,270
Illinois:
$45,019
Change in median household income between 2000 and 2022:
Oak Park, Illinois:
+55.8%
State:
+42.0%
Number of households with income < $10k:
Oak Park:
8.4% (410)
Illinois:
13.3% (92,224)
Number of households with income $10k - 20k:
Oak Park:
9.4% (460)
State:
13.5% (93,732)
Number of households with income $20k - 30k:
Oak Park:
6.4% (315)
Illinois:
9.9% (68,453)
Number of households with income $30k - 40k:
Oak Park:
6.8% (331)
State:
8.5% (59,072)
Number of households with income $40k - 50k:
Oak Park:
5.1% (250)
Illinois:
7.9% (55,033)
Number of households with income $50k - 60k:
Oak Park:
7.3% (355)
State:
7.2% (49,556)
Number of households with income $60k - 75k:
Oak Park:
9.1% (443)
Illinois:
7.8% (53,726)
Number of households with income $75k - 100k:
Oak Park:
19.7% (963)
State:
11.6% (80,439)
Number of households with income $100k - 125k:
Oak Park:
6.9% (337)
State:
7.5% (52,244)
Number of households with income $125k - 150k:
Oak Park:
5.1% (252)
State:
3.9% (27,058)
Number of households with income $150k - 200k:
Oak Park:
5.1% (251)
State:
4.6% (32,057)
Number of households with income > $200k:
Oak Park:
10.8% (527)
State:
4.1% (28,731)
Aggregate household income in Oak Park in 2022: $506,342,462
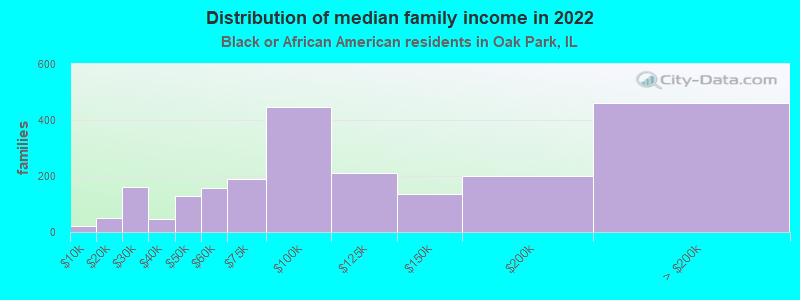
Median family income in Oak Park in 2022:
Oak Park:
$93,440
State:
$60,661
Number of families with income < $10k:
Oak Park:
1.0% (23)
State:
9.5% (35,136)
Number of families with income $10k - 20k:
Oak Park:
2.3% (51)
Illinois:
7.9% (29,324)
Number of families with income $20k - 30k:
Oak Park:
7.3% (162)
Illinois:
8.8% (32,666)
Number of families with income $30k - 40k:
Oak Park:
2.1% (46)
Illinois:
7.8% (28,775)
Number of families with income $40k - 50k:
Oak Park:
5.8% (128)
State:
8.5% (31,429)
Number of families with income $50k - 60k:
Oak Park:
7.0% (156)
State:
7.1% (26,341)
Number of families with income $60k - 75k:
Oak Park:
8.6% (190)
State:
8.3% (30,626)
Number of families with income $75k - 100k:
Oak Park:
20.3% (448)
State:
14.0% (51,750)
Number of families with income $100k - 125k:
Oak Park:
9.5% (211)
Illinois:
9.3% (34,471)
Number of families with income $125k - 150k:
Oak Park:
6.2% (137)
State:
5.7% (21,103)
Number of families with income $150k - 200k:
Oak Park:
9.1% (201)
Illinois:
6.8% (25,177)
Number of families with income > $200k:
Oak Park:
20.8% (459)
State:
6.3% (23,371)
Median non-family income in Oak Park in 2022:
Oak Park:
$46,420
Illinois:
$29,966
Change in median non-family income between 2000 and 2022:
Oak Park, Illinois:
+35.6%
State:
+44.4%
Median per capita income in Oak Park in 2022:
Oak Park:
$51,450
State:
$28,045
Change in median per capita income between 2000 and 2022:
Oak Park, Illinois:
+97.4%
Illinois:
+90.2%
Income statistics for Asian residents
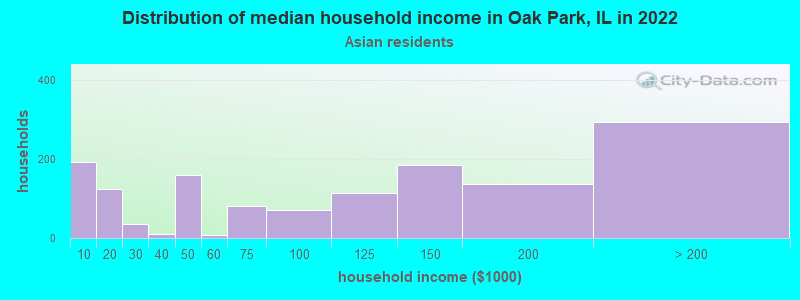
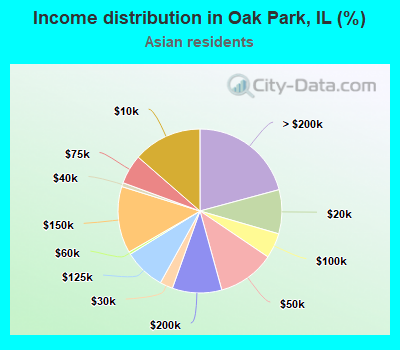
Median household income in Oak Park, IL in 2022:
Oak Park:
$97,973
State:
$104,287
Change in median household income between 2000 and 2022:
Oak Park, Illinois:
+75.2%
State:
+81.9%
Number of households with income < $10k:
Oak Park:
13.6% (192)
State:
5.3% (14,653)
Number of households with income $10k - 20k:
Oak Park:
8.7% (123)
State:
4.5% (12,283)
Number of households with income $20k - 30k:
Oak Park:
2.5% (36)
State:
4.8% (13,135)
Number of households with income $30k - 40k:
Oak Park:
0.8% (11)
State:
5.0% (13,655)
Number of households with income $40k - 50k:
Oak Park:
11.3% (159)
Illinois:
4.5% (12,357)
Number of households with income $50k - 60k:
Oak Park:
0.5% (7)
Illinois:
4.9% (13,568)
Number of households with income $60k - 75k:
Oak Park:
5.8% (82)
State:
7.1% (19,606)
Number of households with income $75k - 100k:
Oak Park:
5.0% (70)
Illinois:
12.1% (33,349)
Number of households with income $100k - 125k:
Oak Park:
8.1% (115)
Illinois:
9.7% (26,669)
Number of households with income $125k - 150k:
Oak Park:
13.2% (186)
State:
7.3% (20,172)
Number of households with income $150k - 200k:
Oak Park:
9.8% (138)
State:
11.5% (31,711)
Number of households with income > $200k:
Oak Park:
20.8% (294)
State:
23.1% (63,411)
Aggregate household income in Oak Park in 2022: $211,341,353
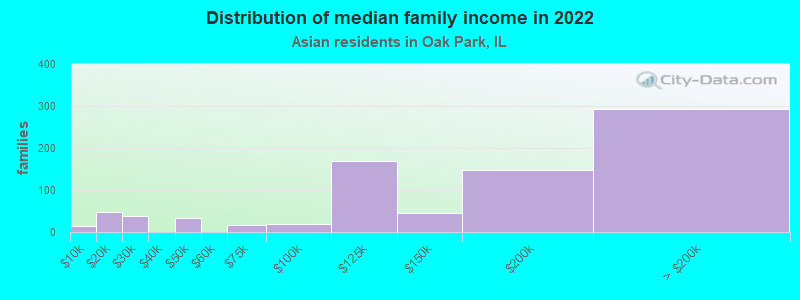
Median family income in Oak Park in 2022:
Oak Park:
$148,591
Illinois:
$124,630
Number of families with income < $10k:
Oak Park:
1.8% (15)
State:
2.0% (3,841)
Number of families with income $10k - 20k:
Oak Park:
5.7% (47)
Illinois:
2.6% (5,077)
Number of families with income $20k - 30k:
Oak Park:
4.6% (38)
Illinois:
4.4% (8,618)
Number of families with income $40k - 50k:
Oak Park:
4.0% (33)
Illinois:
3.9% (7,584)
Number of families with income $60k - 75k:
Oak Park:
2.0% (16)
Illinois:
7.0% (13,773)
Number of families with income $75k - 100k:
Oak Park:
2.3% (19)
State:
12.3% (24,156)
Number of families with income $100k - 125k:
Oak Park:
20.6% (170)
State:
9.6% (18,808)
Number of families with income $125k - 150k:
Oak Park:
5.6% (46)
Illinois:
8.0% (15,639)
Number of families with income $150k - 200k:
Oak Park:
17.8% (147)
State:
13.9% (27,222)
Number of families with income > $200k:
Oak Park:
35.7% (294)
State:
28.0% (54,999)
Median per capita income in Oak Park in 2022:
Oak Park:
$67,604
State:
$52,977
Change in median per capita income between 2000 and 2022:
Oak Park, Illinois:
+136.1%
Illinois:
+119.5%
Income statistics for Hispanic or Latino residents
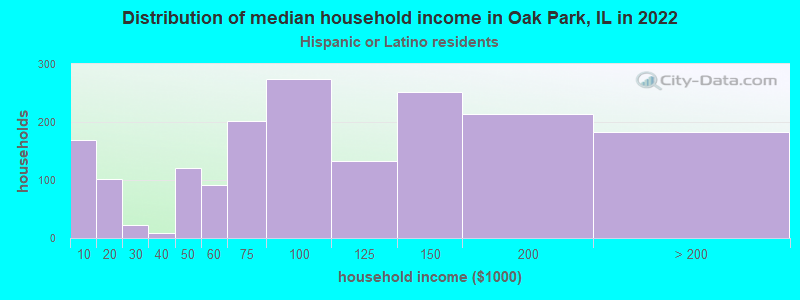
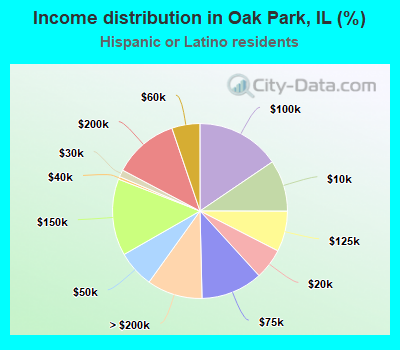
Median household income in Oak Park, IL in 2022:
Oak Park:
$86,481
State:
$72,139
Change in median household income between 2000 and 2022:
Oak Park, Illinois:
+103.2%
Illinois:
+75.7%
Number of households with income < $10k:
Oak Park:
9.5% (169)
State:
4.9% (33,145)
Number of households with income $10k - 20k:
Oak Park:
5.7% (101)
State:
5.4% (36,345)
Number of households with income $20k - 30k:
Oak Park:
1.3% (23)
State:
7.5% (50,677)
Number of households with income $30k - 40k:
Oak Park:
0.5% (9)
Illinois:
7.7% (52,008)
Number of households with income $40k - 50k:
Oak Park:
6.8% (121)
State:
8.1% (54,702)
Number of households with income $50k - 60k:
Oak Park:
5.2% (92)
Illinois:
7.5% (51,062)
Number of households with income $60k - 75k:
Oak Park:
11.4% (202)
Illinois:
11.3% (76,576)
Number of households with income $75k - 100k:
Oak Park:
15.5% (275)
State:
15.5% (105,152)
Number of households with income $100k - 125k:
Oak Park:
7.5% (133)
State:
11.5% (77,760)
Number of households with income $125k - 150k:
Oak Park:
14.2% (252)
State:
7.3% (49,310)
Number of households with income $150k - 200k:
Oak Park:
12.1% (214)
State:
7.6% (51,233)
Number of households with income > $200k:
Oak Park:
10.3% (182)
Illinois:
5.9% (40,028)
Aggregate household income in Oak Park in 2022: $201,787,868
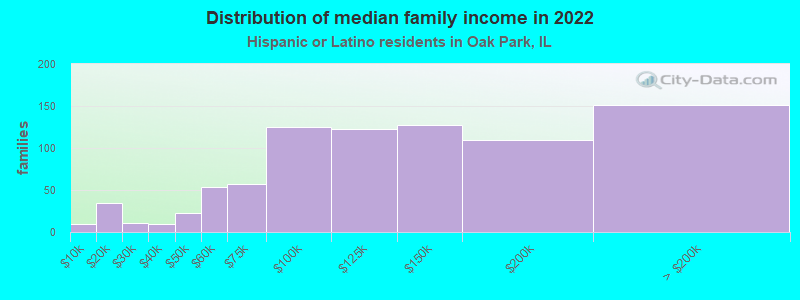
Median family income in Oak Park in 2022:
Oak Park:
$125,415
State:
$76,467
Number of families with income < $10k:
Oak Park:
1.2% (10)
State:
3.8% (19,330)
Number of families with income $10k - 20k:
Oak Park:
4.2% (35)
Illinois:
3.8% (19,314)
Number of families with income $20k - 30k:
Oak Park:
1.3% (11)
State:
6.8% (34,467)
Number of families with income $30k - 40k:
Oak Park:
1.0% (9)
State:
7.5% (37,976)
Number of families with income $40k - 50k:
Oak Park:
2.8% (23)
State:
7.7% (38,858)
Number of families with income $50k - 60k:
Oak Park:
6.4% (54)
State:
7.6% (38,606)
Number of families with income $60k - 75k:
Oak Park:
6.9% (57)
Illinois:
11.5% (58,164)
Number of families with income $75k - 100k:
Oak Park:
15.0% (125)
State:
16.0% (81,055)
Number of families with income $100k - 125k:
Oak Park:
14.8% (123)
State:
12.1% (61,491)
Number of families with income $125k - 150k:
Oak Park:
15.3% (127)
State:
8.0% (40,271)
Number of families with income $150k - 200k:
Oak Park:
13.0% (109)
Illinois:
8.6% (43,536)
Number of families with income > $200k:
Oak Park:
18.1% (151)
State:
6.6% (33,240)
Median non-family income in Oak Park in 2022:
Oak Park:
$74,617
State:
$45,965
Change in median non-family income between 2000 and 2022:
Oak Park, Illinois:
+126.7%
State:
+75.9%
Median per capita income in Oak Park in 2022:
Oak Park:
$38,955
State:
$26,551
Change in median per capita income between 2000 and 2022:
Oak Park, Illinois:
+76.1%
State:
+111.0%
Income statistics for American Indian and Alaska Native residents
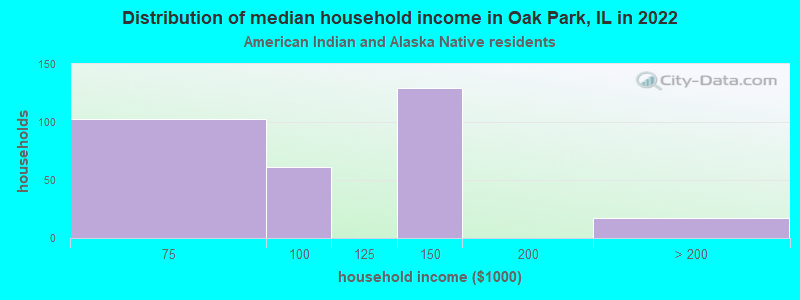
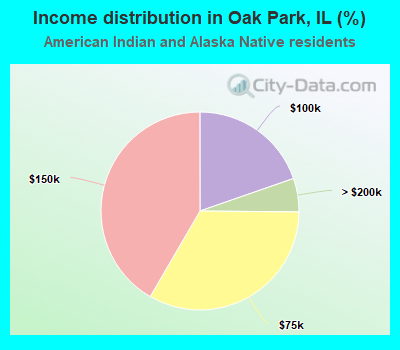
Median household income in Oak Park, IL in 2022:
Oak Park:
$104,316
Illinois:
$66,282
Number of households with income < $10k:
Oak Park:
0.0% (0)
State:
3.2% (935)
Number of households with income $10k - 20k:
Oak Park:
0.0% (0)
State:
7.1% (2,053)
Number of households with income $20k - 30k:
Oak Park:
0.0% (0)
State:
10.1% (2,939)
Number of households with income $30k - 40k:
Oak Park:
0.0% (0)
State:
7.7% (2,246)
Number of households with income $40k - 50k:
Oak Park:
0.0% (0)
State:
7.9% (2,300)
Number of households with income $50k - 60k:
Oak Park:
0.0% (0)
State:
8.5% (2,460)
Number of households with income $60k - 75k:
Oak Park:
33.2% (103)
Illinois:
10.7% (3,095)
Number of households with income $75k - 100k:
Oak Park:
19.7% (61)
Illinois:
15.3% (4,451)
Number of households with income $100k - 125k:
Oak Park:
0.0% (0)
State:
11.7% (3,386)
Number of households with income $125k - 150k:
Oak Park:
41.6% (129)
State:
7.8% (2,269)
Number of households with income $150k - 200k:
Oak Park:
0.0% (0)
Illinois:
5.8% (1,673)
Number of households with income > $200k:
Oak Park:
5.5% (17)
State:
4.1% (1,198)
Aggregate household income in Oak Park in 2022: $40,936,883
Median non-family income in Oak Park in 2022:
Oak Park:
$115,877
State:
$34,674
Median per capita income in Oak Park in 2022:
Oak Park:
$64,504
State:
$26,979
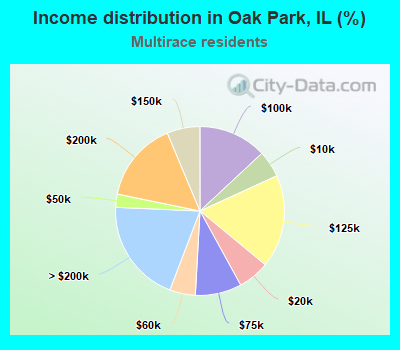
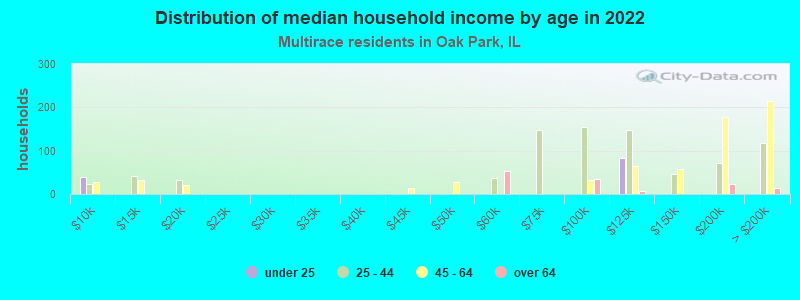
Income statistics for Multirace residents
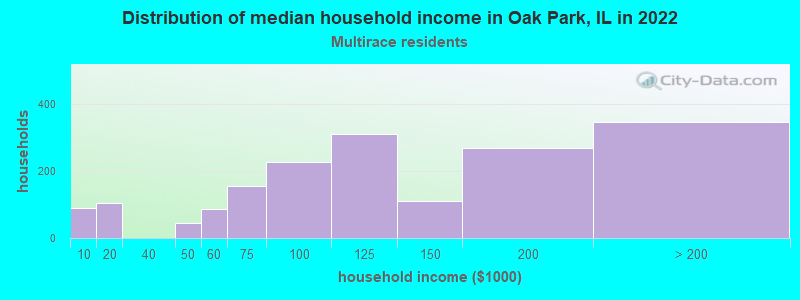
Median household income in Oak Park, IL in 2022:
Oak Park:
$100,045
Illinois:
$71,185
Change in median household income between 2000 and 2022:
Oak Park, Illinois:
+82.6%
State:
+81.4%
Number of households with income < $10k:
Oak Park:
5.1% (89)
State:
5.3% (21,595)
Number of households with income $10k - 20k:
Oak Park:
6.0% (105)
State:
6.5% (26,720)
Number of households with income $20k - 30k:
Oak Park:
0.0% (0)
State:
8.0% (32,573)
Number of households with income $30k - 40k:
Oak Park:
0.0% (0)
State:
8.4% (34,383)
Number of households with income $40k - 50k:
Oak Park:
2.5% (44)
State:
7.4% (30,234)
Number of households with income $50k - 60k:
Oak Park:
4.9% (86)
State:
6.9% (28,432)
Number of households with income $60k - 75k:
Oak Park:
8.9% (155)
State:
10.2% (41,780)
Number of households with income $75k - 100k:
Oak Park:
13.1% (228)
Illinois:
13.0% (53,426)
Number of households with income $100k - 125k:
Oak Park:
17.8% (311)
Illinois:
10.5% (43,126)
Number of households with income $125k - 150k:
Oak Park:
6.3% (110)
State:
7.6% (31,153)
Number of households with income $150k - 200k:
Oak Park:
15.5% (270)
State:
7.6% (30,946)
Number of households with income > $200k:
Oak Park:
19.9% (347)
State:
8.6% (35,208)
Aggregate household income in Oak Park in 2022: $258,149,731
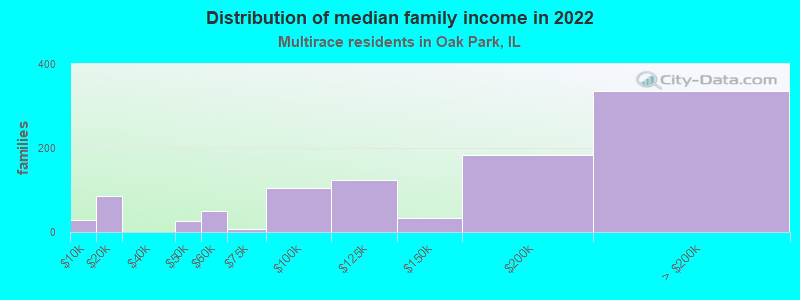
Median family income in Oak Park in 2022:
Oak Park:
$154,347
State:
$84,400
Number of families with income < $10k:
Oak Park:
3.0% (29)
Illinois:
3.9% (10,812)
Number of families with income $10k - 20k:
Oak Park:
8.8% (86)
Illinois:
4.2% (11,692)
Number of families with income $40k - 50k:
Oak Park:
2.8% (27)
State:
7.1% (19,595)
Number of families with income $50k - 60k:
Oak Park:
5.2% (51)
State:
6.9% (19,177)
Number of families with income $60k - 75k:
Oak Park:
0.7% (7)
State:
9.3% (25,936)
Number of families with income $75k - 100k:
Oak Park:
10.6% (104)
Illinois:
13.6% (37,857)
Number of families with income $100k - 125k:
Oak Park:
12.6% (124)
Illinois:
12.2% (33,852)
Number of families with income $125k - 150k:
Oak Park:
3.5% (34)
State:
9.0% (25,085)
Number of families with income $150k - 200k:
Oak Park:
18.7% (183)
State:
9.5% (26,306)
Number of families with income > $200k:
Oak Park:
34.1% (335)
Illinois:
10.4% (28,926)
Median non-family income in Oak Park in 2022:
Oak Park:
$91,518
State:
$43,615
Median per capita income in Oak Park in 2022:
Oak Park:
$36,788
Illinois:
$29,285
Change in median per capita income between 2000 and 2022:
Oak Park, Illinois:
+77.8%
State:
+112.9%
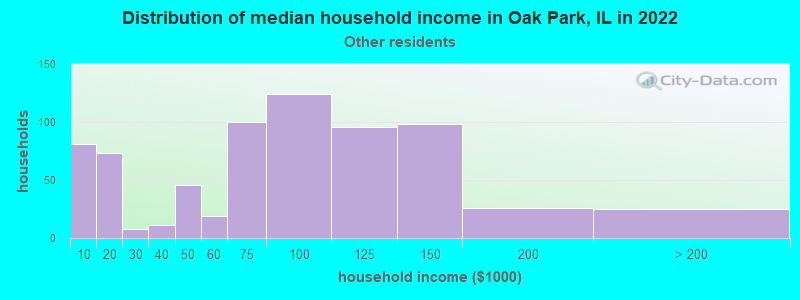
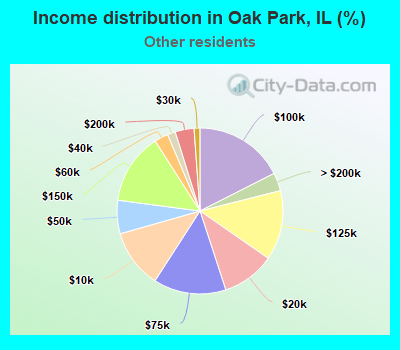
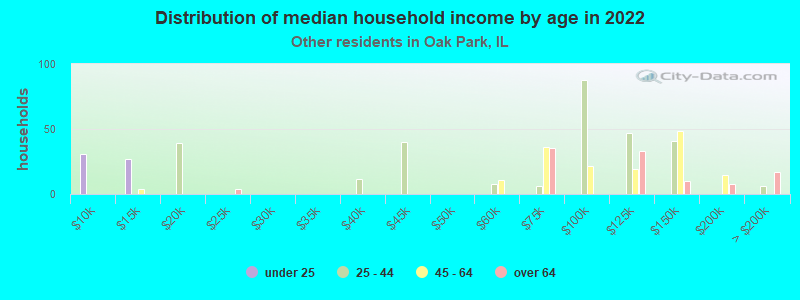
Income statistics for other residents
Median household income in Oak Park, IL in 2022:
Oak Park:
$86,611
Illinois:
$71,711
Number of households with income < $10k:
Oak Park:
11.5% (81)
State:
5.7% (16,383)
Number of households with income $10k - 20k:
Oak Park:
10.3% (73)
State:
4.8% (13,886)
Number of households with income $20k - 30k:
Oak Park:
1.1% (8)
Illinois:
7.0% (20,054)
Number of households with income $30k - 40k:
Oak Park:
1.6% (11)
State:
7.0% (20,038)
Number of households with income $40k - 50k:
Oak Park:
6.5% (46)
State:
8.3% (23,759)
Number of households with income $50k - 60k:
Oak Park:
2.7% (19)
State:
7.8% (22,410)
Number of households with income $60k - 75k:
Oak Park:
14.1% (100)
State:
12.0% (34,448)
Number of households with income $75k - 100k:
Oak Park:
17.5% (124)
Illinois:
16.2% (46,508)
Number of households with income $100k - 125k:
Oak Park:
13.6% (96)
State:
12.5% (35,952)
Number of households with income $125k - 150k:
Oak Park:
13.9% (98)
Illinois:
6.9% (19,732)
Number of households with income $150k - 200k:
Oak Park:
3.7% (26)
State:
7.5% (21,422)
Number of households with income > $200k:
Oak Park:
3.5% (25)
State:
4.3% (12,194)
Aggregate household income in Oak Park in 2022: $57,415,689
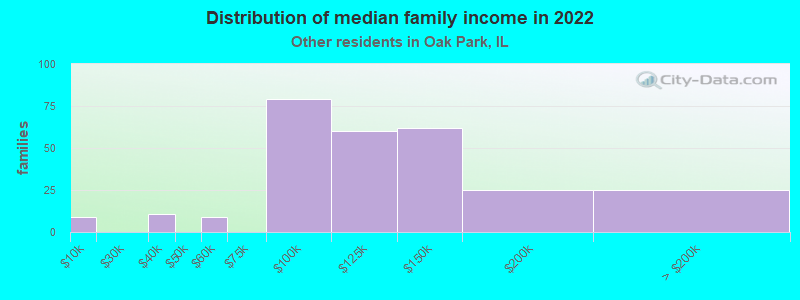
Median family income in Oak Park in 2022:
Oak Park:
$120,492
State:
$74,069
Number of families with income < $10k:
Oak Park:
3.2% (9)
State:
4.1% (9,256)
Number of families with income $30k - 40k:
Oak Park:
3.7% (10)
Illinois:
7.6% (17,087)
Number of families with income $50k - 60k:
Oak Park:
3.3% (9)
State:
7.4% (16,614)
Number of families with income $75k - 100k:
Oak Park:
28.4% (79)
State:
17.2% (38,560)
Number of families with income $100k - 125k:
Oak Park:
21.5% (60)
State:
12.3% (27,638)
Number of families with income $125k - 150k:
Oak Park:
22.1% (62)
Illinois:
7.3% (16,287)
Number of families with income $150k - 200k:
Oak Park:
9.0% (25)
State:
7.7% (17,122)
Number of families with income > $200k:
Oak Park:
8.8% (25)
Illinois:
4.6% (10,400)
Median non-family income in Oak Park in 2022:
Oak Park:
$58,857
State:
$44,975
Median per capita income in Oak Park in 2022:
Oak Park:
$39,652
State:
$25,392
Change in median per capita income between 2000 and 2022:
Oak Park, Illinois:
+113.6%
Illinois:
+117.4%
Discuss Oak Park, Illinois (IL) on our hugely popular Illinois forum.