Oakhurst-North Fork, California (CA) income map, earnings map, and wages data
The median household income in Oakhurst-North Fork, CA in 2022 was $83,457, which was 9.7% less than the median annual income of $91,551 across the entire state of California. Compared to the median income of $39,370 in 2000 this represents an increase of 52.8%. The per capita income in 2022 was $42,277, which means an increase of 52.1% compared to 2000 when it was $20,245.
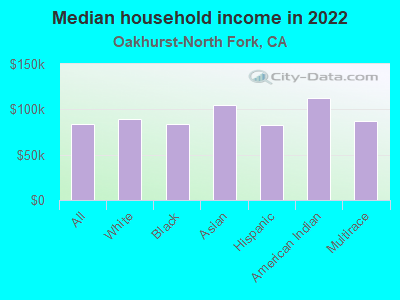
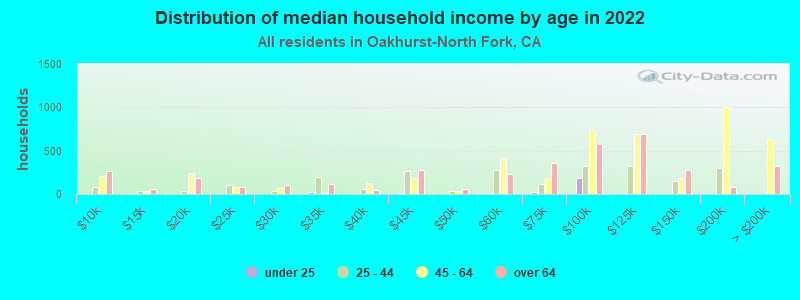
Income statistics for all residents
Median household income in Oakhurst-North Fork, CA in 2022:| Oakhurst-North Fork: | $83,458 |
| State: | $91,551 |
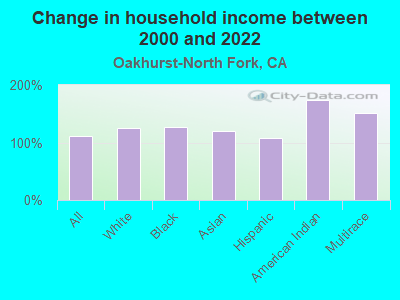
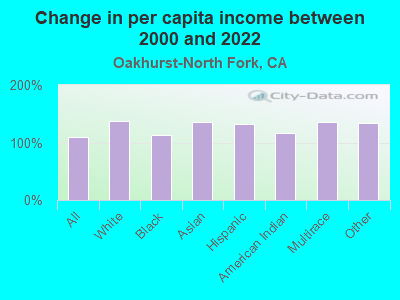
Change in median household income between 2000 and 2022:| Oakhurst-North Fork, California: | +112.0% |
| State: | +92.8% |
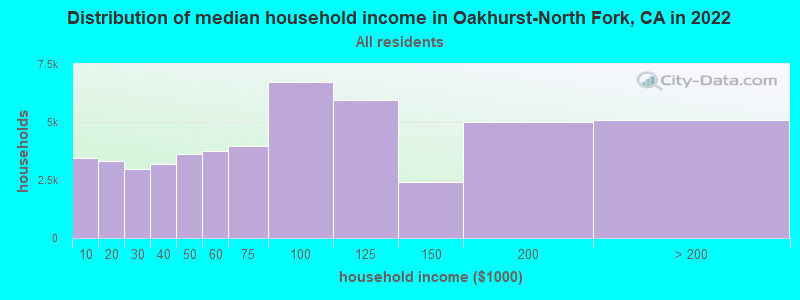
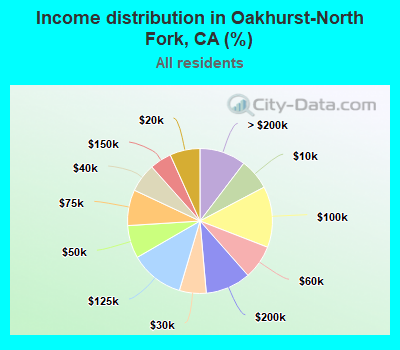
Number of households with income < $10k:| Oakhurst-North Fork: | 6.9% (3,429) |
| State: | 4.8% (654,370) |
Number of households with income $10k - 20k:| Oakhurst-North Fork: | 6.7% (3,320) |
| State: | 5.8% (789,493) |
Number of households with income $20k - 30k:| Oakhurst-North Fork: | 6.0% (2,958) |
| California: | 5.7% (778,318) |
Number of households with income $30k - 40k:| Oakhurst-North Fork: | 6.4% (3,175) |
| California: | 5.8% (783,170) |
Number of households with income $40k - 50k:| Oakhurst-North Fork: | 7.3% (3,625) |
| State: | 5.8% (781,352) |
Number of households with income $50k - 60k:| Oakhurst-North Fork: | 7.6% (3,757) |
| California: | 5.6% (760,175) |
Number of households with income $60k - 75k:| Oakhurst-North Fork: | 8.0% (3,958) |
| State: | 8.2% (1,104,699) |
Number of households with income $75k - 100k:| Oakhurst-North Fork: | 13.6% (6,736) |
| State: | 12.0% (1,627,633) |
Number of households with income $100k - 125k:| Oakhurst-North Fork: | 12.0% (5,952) |
| State: | 10.0% (1,358,619) |
Number of households with income $125k - 150k:| Oakhurst-North Fork: | 4.9% (2,402) |
| California: | 7.6% (1,027,455) |
Number of households with income $150k - 200k:| Oakhurst-North Fork: | 10.1% (4,992) |
| California: | 10.6% (1,439,811) |
Number of households with income > $200k:| Oakhurst-North Fork: | 10.3% (5,106) |
| State: | 18.0% (2,445,491) |
Aggregate household income in Oakhurst-North Fork in 2022: $1,405,333,504
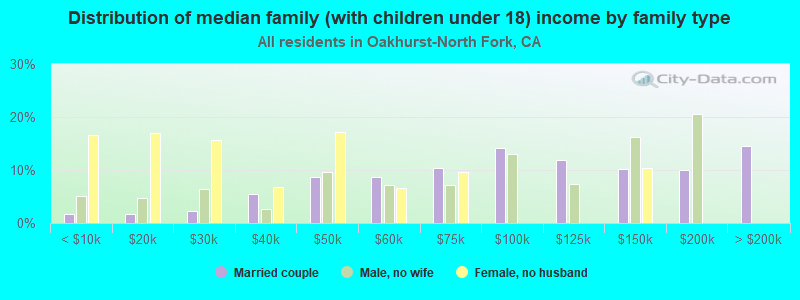
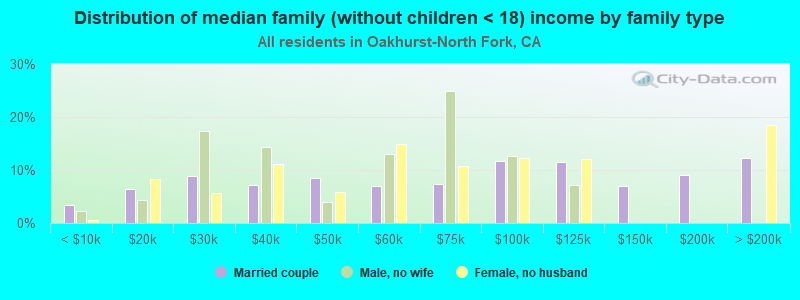
Median family income in Oakhurst-North Fork in 2022:| Oakhurst-North Fork: | $93,619 |
| State: | $104,823 |
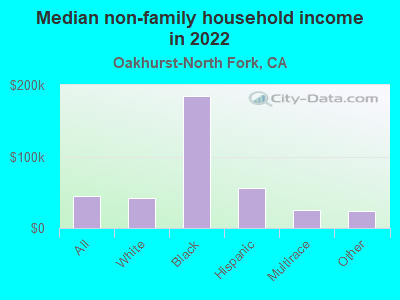
Median non-family income in Oakhurst-North Fork in 2022:| Oakhurst-North Fork: | $44,717 |
| California: | $59,348 |
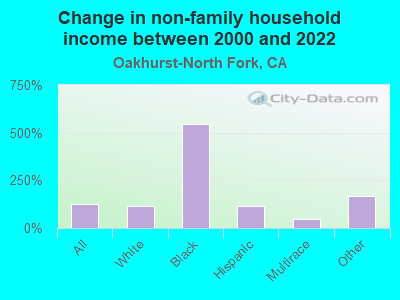
Change in median non-family income between 2000 and 2022:| Oakhurst-North Fork, California: | +126.9% |
| State: | +85.3% |
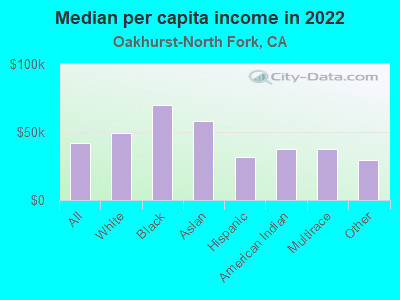
Median per capita income in Oakhurst-North Fork in 2022:| Oakhurst-North Fork: | $42,277 |
| California: | $46,661 |
Change in median per capita income between 2000 and 2022:| Oakhurst-North Fork, California: | +108.8% |
| State: | +105.5% |
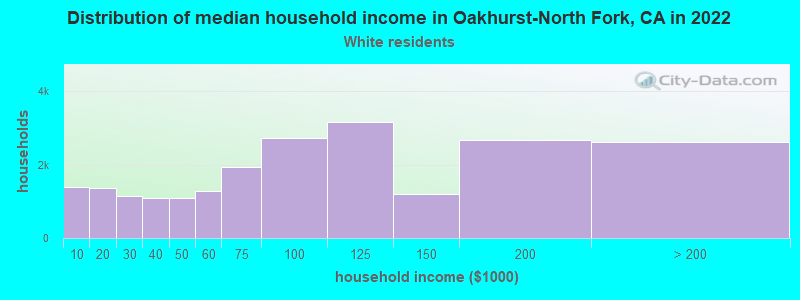
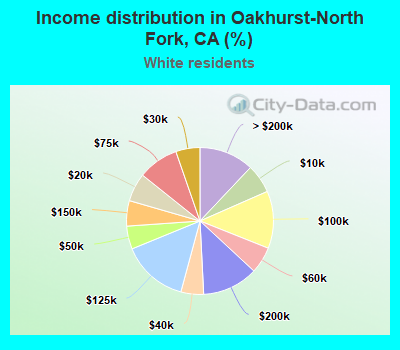
Income statistics for White residents
Median household income in Oakhurst-North Fork, CA in 2022:| Oakhurst-North Fork: | $89,415 |
| State: | $100,917 |
Change in median household income between 2000 and 2022:| Oakhurst-North Fork, California: | +126.2% |
| State: | +96.8% |
Number of households with income < $10k:| Oakhurst-North Fork: | 6.4% (1,380) |
| State: | 4.4% (284,109) |
Number of households with income $10k - 20k:| Oakhurst-North Fork: | 6.3% (1,353) |
| California: | 5.3% (340,330) |
Number of households with income $20k - 30k:| Oakhurst-North Fork: | 5.3% (1,147) |
| State: | 5.3% (343,145) |
Number of households with income $30k - 40k:| Oakhurst-North Fork: | 5.0% (1,081) |
| State: | 5.1% (330,146) |
Number of households with income $40k - 50k:| Oakhurst-North Fork: | 5.1% (1,097) |
| State: | 5.2% (335,310) |
Number of households with income $50k - 60k:| Oakhurst-North Fork: | 5.9% (1,270) |
| State: | 5.1% (326,299) |
Number of households with income $60k - 75k:| Oakhurst-North Fork: | 9.0% (1,940) |
| State: | 7.6% (487,640) |
Number of households with income $75k - 100k:| Oakhurst-North Fork: | 12.6% (2,732) |
| State: | 11.5% (736,578) |
Number of households with income $100k - 125k:| Oakhurst-North Fork: | 14.6% (3,161) |
| State: | 10.1% (648,782) |
Number of households with income $125k - 150k:| Oakhurst-North Fork: | 5.6% (1,210) |
| State: | 7.8% (499,671) |
Number of households with income $150k - 200k:| Oakhurst-North Fork: | 12.3% (2,658) |
| State: | 11.4% (729,603) |
Number of households with income > $200k:| Oakhurst-North Fork: | 12.0% (2,607) |
| California: | 21.2% (1,364,246) |
Aggregate household income in Oakhurst-North Fork in 2022: $842,752,497
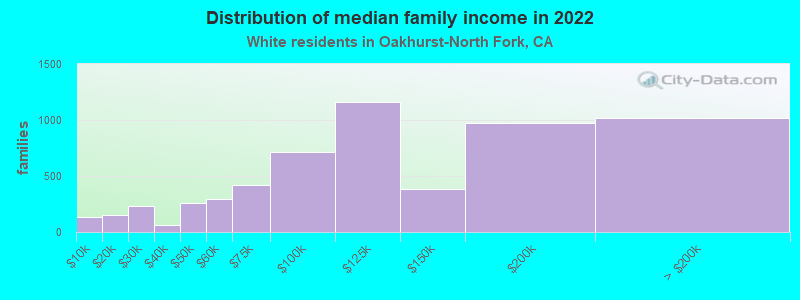
Median family income in Oakhurst-North Fork in 2022:| Oakhurst-North Fork: | $106,913 |
| State: | $125,379 |
Number of families with income < $10k:| Oakhurst-North Fork: | 2.4% (138) |
| California: | 2.2% (87,079) |
Number of families with income $10k - 20k:| Oakhurst-North Fork: | 2.7% (155) |
| State: | 2.5% (97,716) |
Number of families with income $20k - 30k:| Oakhurst-North Fork: | 3.9% (229) |
| State: | 3.5% (137,295) |
Number of families with income $30k - 40k:| Oakhurst-North Fork: | 1.1% (66) |
| State: | 3.9% (152,947) |
Number of families with income $40k - 50k:| Oakhurst-North Fork: | 4.4% (257) |
| California: | 4.3% (169,197) |
Number of families with income $50k - 60k:| Oakhurst-North Fork: | 5.1% (295) |
| State: | 4.5% (176,192) |
Number of families with income $60k - 75k:| Oakhurst-North Fork: | 7.2% (418) |
| California: | 7.0% (274,752) |
Number of families with income $75k - 100k:| Oakhurst-North Fork: | 12.4% (718) |
| California: | 11.3% (445,632) |
Number of families with income $100k - 125k:| Oakhurst-North Fork: | 20.0% (1,163) |
| State: | 10.7% (423,630) |
Number of families with income $125k - 150k:| Oakhurst-North Fork: | 6.6% (384) |
| California: | 9.1% (357,408) |
Number of families with income $150k - 200k:| Oakhurst-North Fork: | 16.7% (970) |
| California: | 13.5% (532,693) |
Number of families with income > $200k:| Oakhurst-North Fork: | 17.5% (1,015) |
| State: | 27.6% (1,086,948) |
Median non-family income in Oakhurst-North Fork in 2022:| Oakhurst-North Fork: | $42,391 |
| State: | $62,819 |
Change in median non-family income between 2000 and 2022:| Oakhurst-North Fork, California: | +113.2% |
| State: | +84.4% |
Median per capita income in Oakhurst-North Fork in 2022:| Oakhurst-North Fork: | $48,998 |
| California: | $61,706 |
Change in median per capita income between 2000 and 2022:| Oakhurst-North Fork, California: | +136.7% |
| California: | +122.7% |
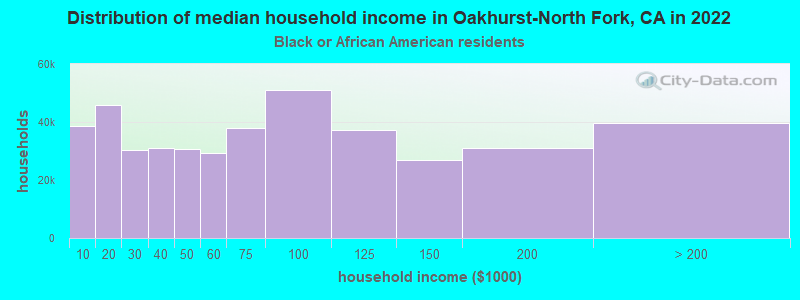
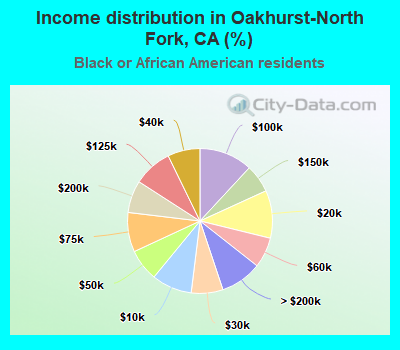
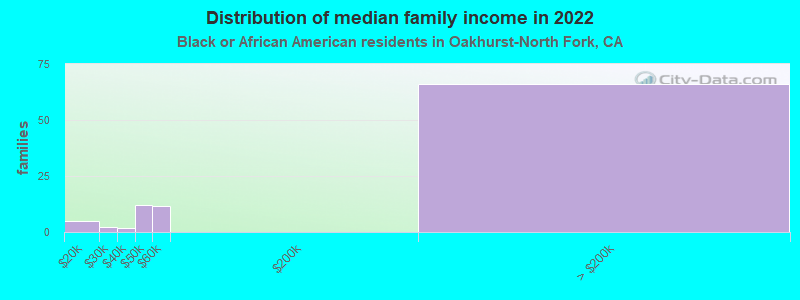
Income statistics for Black or African American residents
Median household income in Oakhurst-North Fork, CA in 2022:| Oakhurst-North Fork: | $83,767 |
| State: | $63,268 |
Change in median household income between 2000 and 2022:| Oakhurst-North Fork, California: | +127.2% |
| State: | +81.0% |
Number of households with income < $10k:| Oakhurst-North Fork: | 9.0% (38,602) |
| State: | 9.0% (73,219) |
Number of households with income $10k - 20k:| Oakhurst-North Fork: | 10.6% (45,690) |
| California: | 10.6% (86,666) |
Number of households with income $20k - 30k:| Oakhurst-North Fork: | 7.1% (30,425) |
| California: | 7.1% (57,719) |
Number of households with income $30k - 40k:| Oakhurst-North Fork: | 7.2% (30,978) |
| State: | 7.2% (58,714) |
Number of households with income $40k - 50k:| Oakhurst-North Fork: | 7.1% (30,602) |
| California: | 7.1% (58,075) |
Number of households with income $50k - 60k:| Oakhurst-North Fork: | 6.8% (29,144) |
| State: | 6.8% (55,229) |
Number of households with income $60k - 75k:| Oakhurst-North Fork: | 8.8% (37,873) |
| California: | 8.8% (71,895) |
Number of households with income $75k - 100k:| Oakhurst-North Fork: | 11.9% (51,076) |
| State: | 11.9% (96,893) |
Number of households with income $100k - 125k:| Oakhurst-North Fork: | 8.7% (37,252) |
| California: | 8.7% (70,729) |
Number of households with income $125k - 150k:| Oakhurst-North Fork: | 6.3% (27,010) |
| California: | 6.3% (51,211) |
Number of households with income $150k - 200k:| Oakhurst-North Fork: | 7.2% (30,941) |
| State: | 7.2% (58,687) |
Number of households with income > $200k:| Oakhurst-North Fork: | 9.3% (39,766) |
| State: | 9.3% (75,487) |
Aggregate household income in Oakhurst-North Fork in 2022: $7,963,189
Median family income in Oakhurst-North Fork in 2022:| Oakhurst-North Fork: | $107,115 |
| State: | $77,263 |
Number of families with income $10k - 20k:| Oakhurst-North Fork: | 5.1% (5) |
| California: | 6.4% (29,505) |
Number of families with income $20k - 30k:| Oakhurst-North Fork: | 2.5% (2) |
| State: | 5.6% (25,755) |
Number of families with income $30k - 40k:| Oakhurst-North Fork: | 1.8% (2) |
| State: | 6.8% (30,948) |
Number of families with income $40k - 50k:| Oakhurst-North Fork: | 12.0% (12) |
| State: | 8.3% (38,171) |
Number of families with income $50k - 60k:| Oakhurst-North Fork: | 11.9% (12) |
| State: | 7.0% (31,860) |
Number of families with income > $200k:| Oakhurst-North Fork: | 66.7% (66) |
| State: | 12.2% (56,093) |
Median non-family income in Oakhurst-North Fork in 2022:| Oakhurst-North Fork: | $185,261 |
| State: | $41,942 |
Median per capita income in Oakhurst-North Fork in 2022:| Oakhurst-North Fork: | $70,031 |
| California: | $36,708 |
Change in median per capita income between 2000 and 2022:| Oakhurst-North Fork, California: | +113.1% |
| State: | +110.4% |
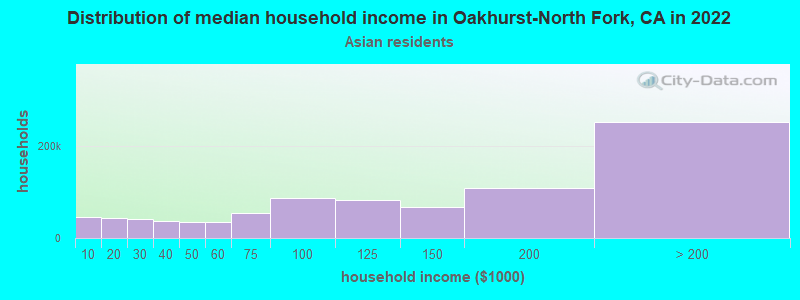
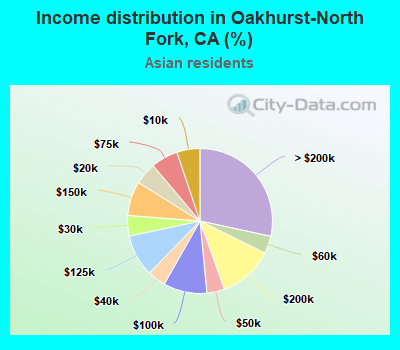
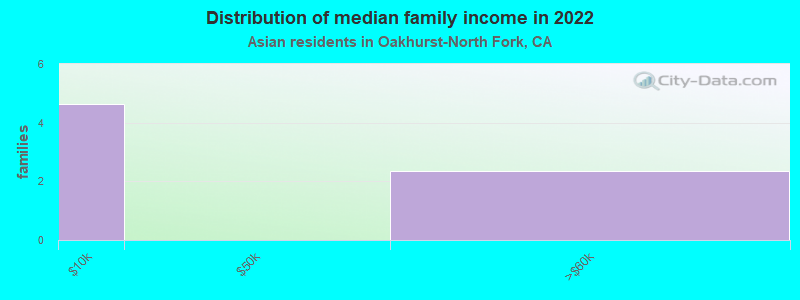
Income statistics for Asian residents
Median household income in Oakhurst-North Fork, CA in 2022:| Oakhurst-North Fork: | $104,944 |
| California: | $119,861 |
Change in median household income between 2000 and 2022:| Oakhurst-North Fork, California: | +119.6% |
| State: | +116.5% |
Number of households with income < $10k:| Oakhurst-North Fork: | 5.1% (45,841) |
| State: | 5.1% (106,273) |
Number of households with income $10k - 20k:| Oakhurst-North Fork: | 4.9% (43,940) |
| California: | 4.9% (101,815) |
Number of households with income $20k - 30k:| Oakhurst-North Fork: | 4.6% (40,728) |
| California: | 4.6% (94,414) |
Number of households with income $30k - 40k:| Oakhurst-North Fork: | 4.1% (36,456) |
| California: | 4.1% (84,491) |
Number of households with income $40k - 50k:| Oakhurst-North Fork: | 4.0% (35,270) |
| State: | 4.0% (81,758) |
Number of households with income $50k - 60k:| Oakhurst-North Fork: | 3.9% (34,915) |
| State: | 3.9% (80,971) |
Number of households with income $60k - 75k:| Oakhurst-North Fork: | 6.0% (53,569) |
| California: | 6.0% (124,194) |
Number of households with income $75k - 100k:| Oakhurst-North Fork: | 9.7% (86,456) |
| State: | 9.7% (200,337) |
Number of households with income $100k - 125k:| Oakhurst-North Fork: | 9.4% (83,464) |
| State: | 9.4% (193,488) |
Number of households with income $125k - 150k:| Oakhurst-North Fork: | 7.7% (68,281) |
| State: | 7.7% (158,253) |
Number of households with income $150k - 200k:| Oakhurst-North Fork: | 12.2% (108,757) |
| State: | 12.2% (252,139) |
Number of households with income > $200k:| Oakhurst-North Fork: | 28.4% (253,024) |
| State: | 28.4% (586,641) |
Aggregate household income in Oakhurst-North Fork in 2022: $109,781,187
Median family income in Oakhurst-North Fork in 2022:| Oakhurst-North Fork: | $5,400 |
| California: | $136,040 |
Median per capita income in Oakhurst-North Fork in 2022:| Oakhurst-North Fork: | $57,803 |
| State: | $58,824 |
Change in median per capita income between 2000 and 2022:| Oakhurst-North Fork, California: | +135.2% |
| State: | +166.8% |
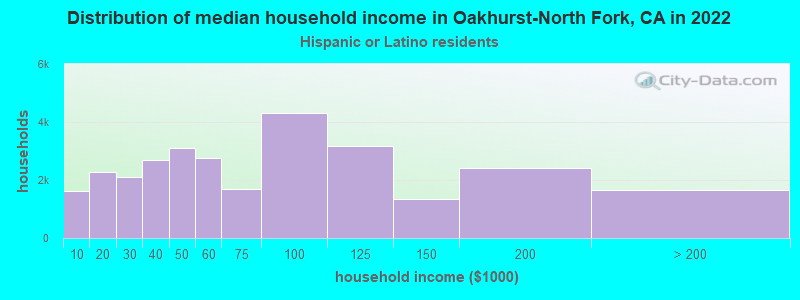
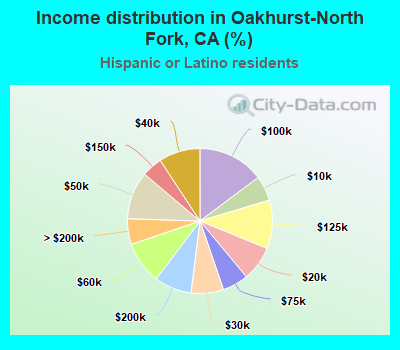
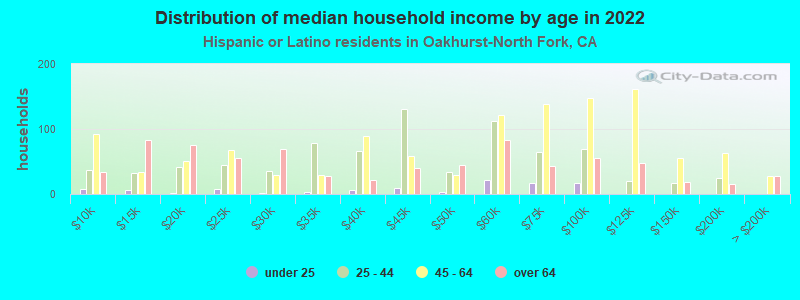
Income statistics for Hispanic or Latino residents
Median household income in Oakhurst-North Fork, CA in 2022:| Oakhurst-North Fork: | $82,282 |
| State: | $75,698 |
Change in median household income between 2000 and 2022:| Oakhurst-North Fork, California: | +107.9% |
| California: | +107.2% |
Number of households with income < $10k:| Oakhurst-North Fork: | 5.6% (1,624) |
| California: | 4.3% (183,294) |
Number of households with income $10k - 20k:| Oakhurst-North Fork: | 7.8% (2,268) |
| California: | 6.0% (253,903) |
Number of households with income $20k - 30k:| Oakhurst-North Fork: | 7.2% (2,109) |
| State: | 6.8% (286,386) |
Number of households with income $30k - 40k:| Oakhurst-North Fork: | 9.2% (2,691) |
| State: | 7.4% (313,728) |
Number of households with income $40k - 50k:| Oakhurst-North Fork: | 10.7% (3,107) |
| State: | 7.4% (313,199) |
Number of households with income $50k - 60k:| Oakhurst-North Fork: | 9.5% (2,766) |
| State: | 7.2% (305,366) |
Number of households with income $60k - 75k:| Oakhurst-North Fork: | 5.8% (1,689) |
| State: | 10.3% (434,937) |
Number of households with income $75k - 100k:| Oakhurst-North Fork: | 14.8% (4,308) |
| State: | 14.4% (607,302) |
Number of households with income $100k - 125k:| Oakhurst-North Fork: | 10.8% (3,156) |
| State: | 10.6% (447,424) |
Number of households with income $125k - 150k:| Oakhurst-North Fork: | 4.6% (1,337) |
| State: | 7.5% (316,022) |
Number of households with income $150k - 200k:| Oakhurst-North Fork: | 8.3% (2,419) |
| State: | 9.2% (386,269) |
Number of households with income > $200k:| Oakhurst-North Fork: | 5.7% (1,662) |
| State: | 8.8% (372,651) |
Aggregate household income in Oakhurst-North Fork in 2022: $103,631,501
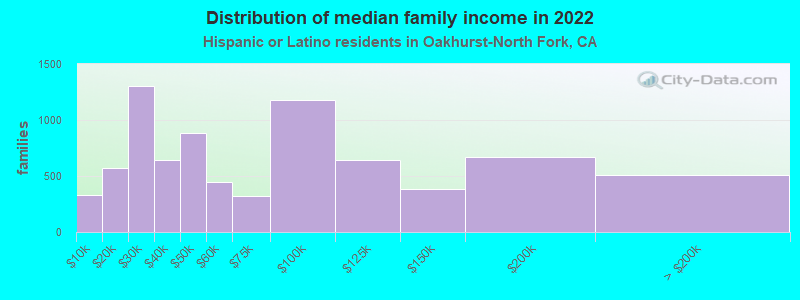
Median family income in Oakhurst-North Fork in 2022:| Oakhurst-North Fork: | $84,738 |
| State: | $77,589 |
Number of families with income < $10k:| Oakhurst-North Fork: | 4.2% (328) |
| State: | 3.9% (129,468) |
Number of families with income $10k - 20k:| Oakhurst-North Fork: | 7.3% (575) |
| State: | 4.6% (151,997) |
Number of families with income $20k - 30k:| Oakhurst-North Fork: | 16.6% (1,306) |
| State: | 6.6% (216,764) |
Number of families with income $30k - 40k:| Oakhurst-North Fork: | 8.2% (643) |
| California: | 7.6% (249,849) |
Number of families with income $40k - 50k:| Oakhurst-North Fork: | 11.2% (883) |
| State: | 7.7% (254,822) |
Number of families with income $50k - 60k:| Oakhurst-North Fork: | 5.7% (449) |
| State: | 7.4% (244,815) |
Number of families with income $60k - 75k:| Oakhurst-North Fork: | 4.1% (321) |
| California: | 10.5% (345,838) |
Number of families with income $75k - 100k:| Oakhurst-North Fork: | 14.9% (1,176) |
| State: | 14.9% (491,589) |
Number of families with income $100k - 125k:| Oakhurst-North Fork: | 8.2% (645) |
| State: | 10.7% (355,400) |
Number of families with income $125k - 150k:| Oakhurst-North Fork: | 4.9% (383) |
| California: | 7.8% (259,317) |
Number of families with income $150k - 200k:| Oakhurst-North Fork: | 8.5% (673) |
| State: | 9.3% (306,566) |
Number of families with income > $200k:| Oakhurst-North Fork: | 6.4% (508) |
| State: | 9.1% (299,984) |
Median non-family income in Oakhurst-North Fork in 2022:| Oakhurst-North Fork: | $56,442 |
| State: | $49,746 |
Change in median non-family income between 2000 and 2022:| Oakhurst-North Fork, California: | +116.4% |
| State: | +100.7% |
Median per capita income in Oakhurst-North Fork in 2022:| Oakhurst-North Fork: | $31,319 |
| State: | $27,240 |
Change in median per capita income between 2000 and 2022:| Oakhurst-North Fork, California: | +132.2% |
| State: | +133.3% |
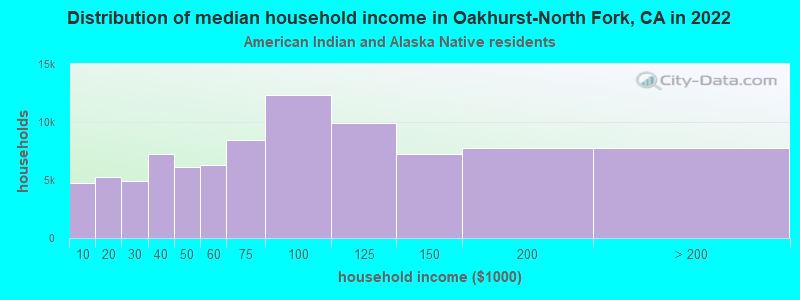
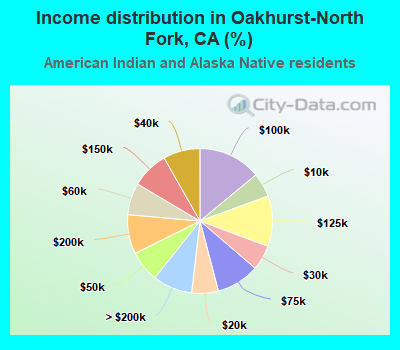
Income statistics for American Indian and Alaska Native residents
Median household income in Oakhurst-North Fork, CA in 2022:| Oakhurst-North Fork: | $113,017 |
| California: | $76,752 |
Number of households with income < $10k:| Oakhurst-North Fork: | 5.4% (4,760) |
| State: | 5.4% (8,471) |
Number of households with income $10k - 20k:| Oakhurst-North Fork: | 6.0% (5,252) |
| California: | 6.0% (9,381) |
Number of households with income $20k - 30k:| Oakhurst-North Fork: | 5.6% (4,934) |
| State: | 5.5% (8,668) |
Number of households with income $30k - 40k:| Oakhurst-North Fork: | 8.2% (7,238) |
| State: | 8.3% (13,030) |
Number of households with income $40k - 50k:| Oakhurst-North Fork: | 7.0% (6,124) |
| State: | 6.9% (10,908) |
Number of households with income $50k - 60k:| Oakhurst-North Fork: | 7.1% (6,260) |
| State: | 7.1% (11,198) |
Number of households with income $60k - 75k:| Oakhurst-North Fork: | 9.6% (8,455) |
| California: | 9.6% (15,190) |
Number of households with income $75k - 100k:| Oakhurst-North Fork: | 14.0% (12,351) |
| State: | 14.1% (22,274) |
Number of households with income $100k - 125k:| Oakhurst-North Fork: | 11.3% (9,923) |
| California: | 11.2% (17,643) |
Number of households with income $125k - 150k:| Oakhurst-North Fork: | 8.3% (7,270) |
| State: | 8.3% (13,117) |
Number of households with income $150k - 200k:| Oakhurst-North Fork: | 8.8% (7,727) |
| State: | 8.8% (13,853) |
Number of households with income > $200k:| Oakhurst-North Fork: | 8.8% (7,758) |
| State: | 8.8% (13,925) |
Aggregate household income in Oakhurst-North Fork in 2022: $43,149,752
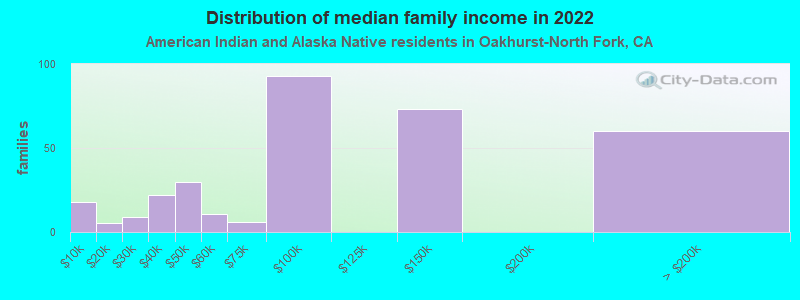
Median family income in Oakhurst-North Fork in 2022:| Oakhurst-North Fork: | $114,166 |
| State: | $81,108 |
Number of families with income < $10k:| Oakhurst-North Fork: | 5.4% (18) |
| State: | 5.0% (5,711) |
Number of families with income $10k - 20k:| Oakhurst-North Fork: | 1.6% (5) |
| State: | 3.7% (4,148) |
Number of families with income $20k - 30k:| Oakhurst-North Fork: | 2.7% (9) |
| State: | 4.3% (4,876) |
Number of families with income $30k - 40k:| Oakhurst-North Fork: | 6.7% (22) |
| California: | 8.8% (9,994) |
Number of families with income $40k - 50k:| Oakhurst-North Fork: | 9.1% (30) |
| California: | 7.8% (8,776) |
Number of families with income $50k - 60k:| Oakhurst-North Fork: | 3.3% (11) |
| California: | 6.9% (7,834) |
Number of families with income $60k - 75k:| Oakhurst-North Fork: | 1.8% (6) |
| State: | 9.1% (10,247) |
Number of families with income $75k - 100k:| Oakhurst-North Fork: | 28.5% (93) |
| State: | 14.8% (16,731) |
Number of families with income $125k - 150k:| Oakhurst-North Fork: | 22.4% (73) |
| California: | 8.0% (9,104) |
Number of families with income > $200k:| Oakhurst-North Fork: | 18.4% (60) |
| State: | 10.1% (11,409) |
Median per capita income in Oakhurst-North Fork in 2022:| Oakhurst-North Fork: | $37,703 |
| State: | $30,289 |
Change in median per capita income between 2000 and 2022:| Oakhurst-North Fork, California: | +117.4% |
| California: | +98.9% |
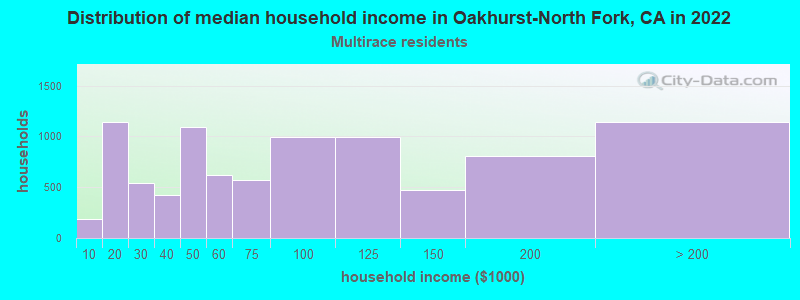
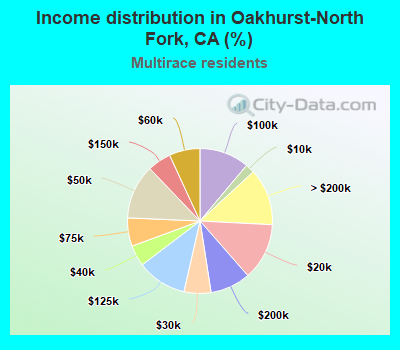
Income statistics for Multirace residents
Median household income in Oakhurst-North Fork, CA in 2022:| Oakhurst-North Fork: | $87,201 |
| California: | $83,153 |
Number of households with income < $10k:| Oakhurst-North Fork: | 2.0% (183) |
| California: | 4.2% (85,299) |
Number of households with income $10k - 20k:| Oakhurst-North Fork: | 12.7% (1,142) |
| State: | 6.1% (122,966) |
Number of households with income $20k - 30k:| Oakhurst-North Fork: | 6.0% (540) |
| California: | 6.4% (129,328) |
Number of households with income $30k - 40k:| Oakhurst-North Fork: | 4.7% (421) |
| State: | 6.4% (130,070) |
Number of households with income $40k - 50k:| Oakhurst-North Fork: | 12.1% (1,090) |
| State: | 6.5% (131,254) |
Number of households with income $50k - 60k:| Oakhurst-North Fork: | 6.9% (616) |
| State: | 6.5% (132,382) |
Number of households with income $60k - 75k:| Oakhurst-North Fork: | 6.3% (568) |
| California: | 9.4% (191,472) |
Number of households with income $75k - 100k:| Oakhurst-North Fork: | 11.1% (996) |
| California: | 13.3% (269,691) |
Number of households with income $100k - 125k:| Oakhurst-North Fork: | 11.1% (997) |
| State: | 10.2% (207,286) |
Number of households with income $125k - 150k:| Oakhurst-North Fork: | 5.3% (474) |
| State: | 7.8% (158,259) |
Number of households with income $150k - 200k:| Oakhurst-North Fork: | 9.0% (807) |
| California: | 10.3% (209,227) |
Number of households with income > $200k:| Oakhurst-North Fork: | 12.7% (1,138) |
| State: | 13.0% (263,210) |
Aggregate household income in Oakhurst-North Fork in 2022: $213,037,146
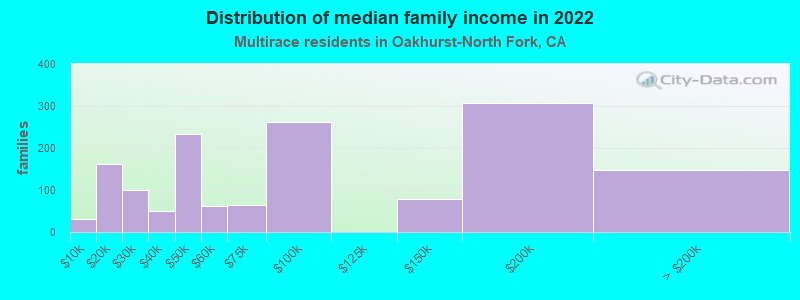
Median family income in Oakhurst-North Fork in 2022:| Oakhurst-North Fork: | $95,083 |
| State: | $87,642 |
Number of families with income < $10k:| Oakhurst-North Fork: | 2.1% (31) |
| State: | 3.2% (48,017) |
Number of families with income $10k - 20k:| Oakhurst-North Fork: | 10.8% (161) |
| State: | 4.1% (60,419) |
Number of families with income $20k - 30k:| Oakhurst-North Fork: | 6.6% (99) |
| State: | 6.1% (89,742) |
Number of families with income $30k - 40k:| Oakhurst-North Fork: | 3.4% (50) |
| California: | 6.2% (91,415) |
Number of families with income $40k - 50k:| Oakhurst-North Fork: | 15.6% (233) |
| State: | 6.8% (100,085) |
Number of families with income $50k - 60k:| Oakhurst-North Fork: | 4.2% (63) |
| State: | 6.7% (98,298) |
Number of families with income $60k - 75k:| Oakhurst-North Fork: | 4.4% (65) |
| State: | 9.5% (140,131) |
Number of families with income $75k - 100k:| Oakhurst-North Fork: | 17.4% (261) |
| State: | 13.8% (203,439) |
Number of families with income $125k - 150k:| Oakhurst-North Fork: | 5.2% (78) |
| State: | 8.4% (124,115) |
Number of families with income $150k - 200k:| Oakhurst-North Fork: | 20.5% (307) |
| State: | 10.9% (161,643) |
Number of families with income > $200k:| Oakhurst-North Fork: | 9.9% (148) |
| California: | 14.0% (207,317) |
Median non-family income in Oakhurst-North Fork in 2022:| Oakhurst-North Fork: | $25,026 |
| State: | $56,558 |
Change in median non-family income between 2000 and 2022:| Oakhurst-North Fork, California: | +48.6% |
| State: | +100.2% |
Median per capita income in Oakhurst-North Fork in 2022:| Oakhurst-North Fork: | $37,412 |
| State: | $32,124 |
Change in median per capita income between 2000 and 2022:| Oakhurst-North Fork, California: | +136.1% |
| California: | +120.4% |
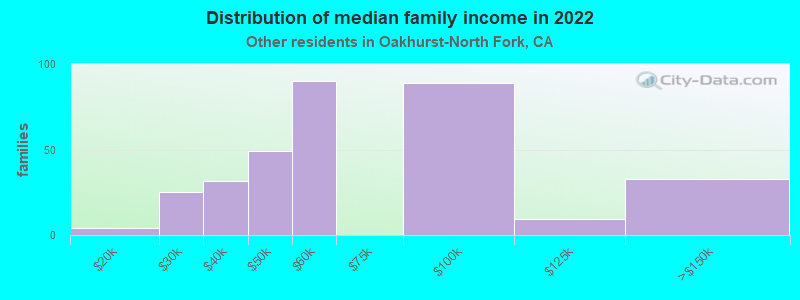
Income statistics for other residents
Number of households with income < $10k:| Oakhurst-North Fork: | 7.9% (30) |
| State: | 4.6% (93,035) |
Number of households with income $10k - 20k:| Oakhurst-North Fork: | 5.3% (20) |
| California: | 6.3% (126,222) |
Number of households with income $20k - 30k:| Oakhurst-North Fork: | 8.2% (31) |
| State: | 7.1% (142,656) |
Number of households with income $30k - 40k:| Oakhurst-North Fork: | 11.1% (42) |
| California: | 8.2% (165,018) |
Number of households with income $40k - 50k:| Oakhurst-North Fork: | 10.8% (41) |
| State: | 8.0% (161,732) |
Number of households with income $50k - 60k:| Oakhurst-North Fork: | 11.9% (45) |
| State: | 7.6% (152,152) |
Number of households with income $60k - 75k:| Oakhurst-North Fork: | 4.5% (17) |
| California: | 10.4% (209,951) |
Number of households with income $75k - 100k:| Oakhurst-North Fork: | 16.9% (64) |
| State: | 14.7% (296,102) |
Number of households with income $100k - 125k:| Oakhurst-North Fork: | 6.9% (26) |
| State: | 10.7% (214,281) |
Number of households with income $125k - 150k:| Oakhurst-North Fork: | 5.0% (19) |
| California: | 7.1% (143,092) |
Number of households with income $150k - 200k:| Oakhurst-North Fork: | 8.5% (32) |
| State: | 8.6% (172,215) |
Number of households with income > $200k:| Oakhurst-North Fork: | 2.9% (11) |
| California: | 6.7% (134,102) |
Aggregate household income in Oakhurst-North Fork in 2022: $29,933,268
Median family income in Oakhurst-North Fork in 2022:| Oakhurst-North Fork: | $78,369 |
| State: | $72,756 |
Number of families with income $10k - 20k:| Oakhurst-North Fork: | 1.3% (4) |
| State: | 5.1% (82,116) |
Number of families with income $20k - 30k:| Oakhurst-North Fork: | 7.7% (25) |
| State: | 7.0% (112,854) |
Number of families with income $30k - 40k:| Oakhurst-North Fork: | 9.6% (32) |
| California: | 8.4% (135,938) |
Number of families with income $40k - 50k:| Oakhurst-North Fork: | 14.9% (49) |
| State: | 8.4% (135,353) |
Number of families with income $50k - 60k:| Oakhurst-North Fork: | 27.2% (90) |
| State: | 7.7% (124,826) |
Number of families with income $75k - 100k:| Oakhurst-North Fork: | 26.8% (89) |
| State: | 15.2% (245,724) |
Number of families with income $100k - 125k:| Oakhurst-North Fork: | 2.8% (9) |
| California: | 10.9% (176,716) |
Number of families with income $125k - 150k:| Oakhurst-North Fork: | 9.8% (33) |
| State: | 7.4% (119,985) |
Median non-family income in Oakhurst-North Fork in 2022:| Oakhurst-North Fork: | $23,859 |
| State: | $43,881 |
Median per capita income in Oakhurst-North Fork in 2022:| Oakhurst-North Fork: | $29,667 |
| California: | $25,164 |
Change in median per capita income between 2000 and 2022:| Oakhurst-North Fork, California: | +134.4% |
| State: | +137.9% |