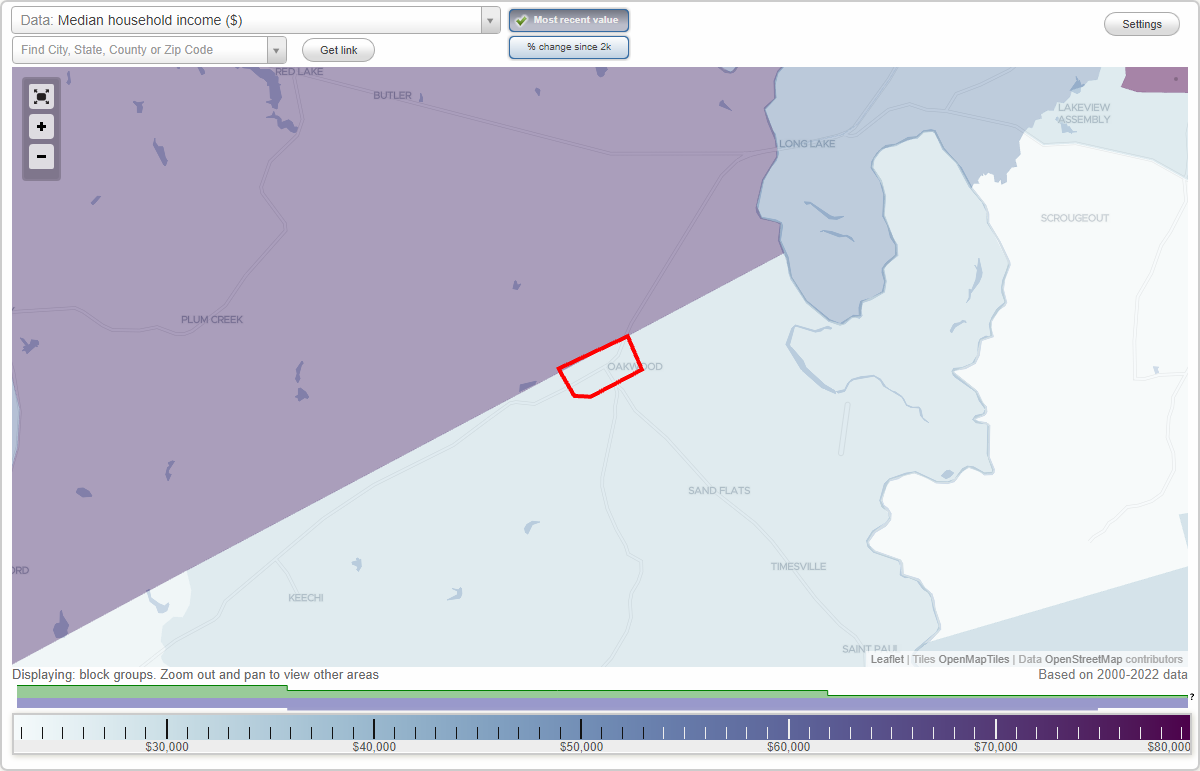
The median household income in Oakwood, TX in 2022 was $64,331, which was 12.4% less than the median annual income of $72,284 across the entire state of Texas. Compared to the median income of $25,625 in 2000 this represents an increase of 60.2%. The per capita income in 2022 was $27,618, which means an increase of 40.7% compared to 2000 when it was $16,371.
Whole page based on the data from 2000 / 2022 when the population of Oakwood, Texas was 471 / 553
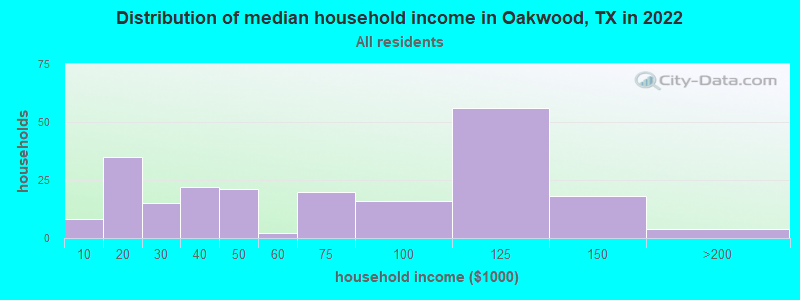
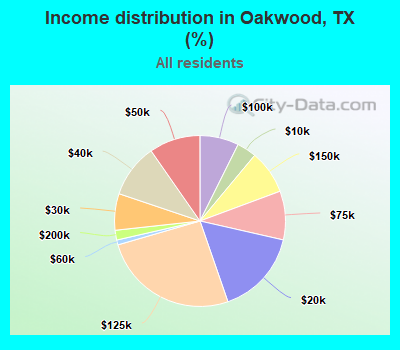
Income statistics for all residents
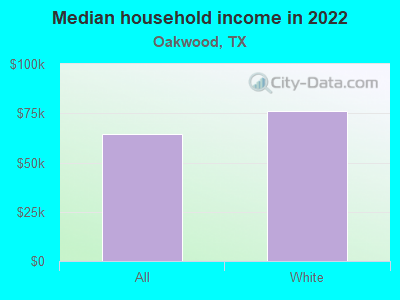
Median household income in Oakwood, TX in 2022:
Oakwood:
$64,332
Texas:
$72,284
Number of households with income < $10k:
Oakwood:
3.7% (8)
State:
5.5% (611,011)
Number of households with income $10k - 20k:
Oakwood:
16.1% (35)
State:
6.7% (743,157)
Number of households with income $20k - 30k:
Oakwood:
6.9% (15)
State:
7.2% (803,381)
Number of households with income $30k - 40k:
Oakwood:
10.1% (22)
State:
7.8% (866,080)
Number of households with income $40k - 50k:
Oakwood:
9.7% (21)
Texas:
7.3% (810,440)
Number of households with income $50k - 60k:
Oakwood:
0.9% (2)
State:
7.2% (799,783)
Number of households with income $60k - 75k:
Oakwood:
9.2% (20)
State:
9.9% (1,095,384)
Number of households with income $75k - 100k:
Oakwood:
7.4% (16)
State:
12.8% (1,419,057)
Number of households with income $100k - 125k:
Oakwood:
25.8% (56)
State:
9.5% (1,054,577)
Number of households with income $125k - 150k:
Oakwood:
8.3% (18)
State:
6.7% (741,518)
Number of households with income $150k - 200k:
Oakwood:
1.8% (4)
Texas:
8.7% (961,776)
Number of households with income > $200k:
Oakwood:
0.0% (0)
State:
10.7% (1,181,544)
Aggregate household income in Oakwood in 2022: $14,554,174
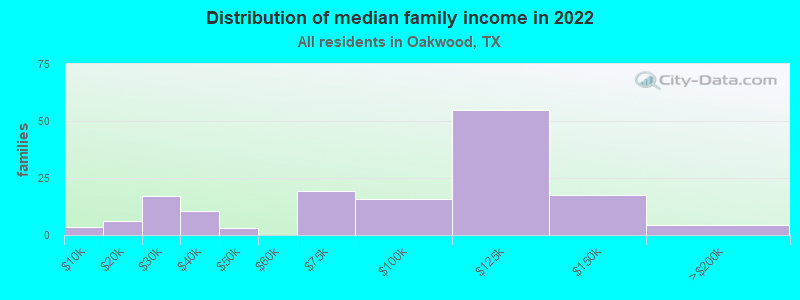
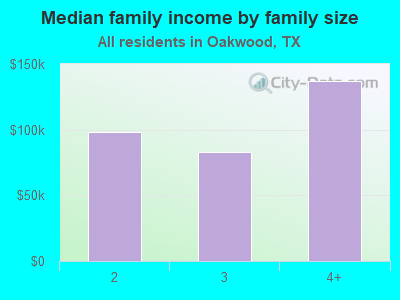
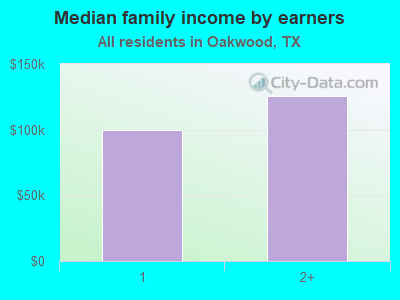
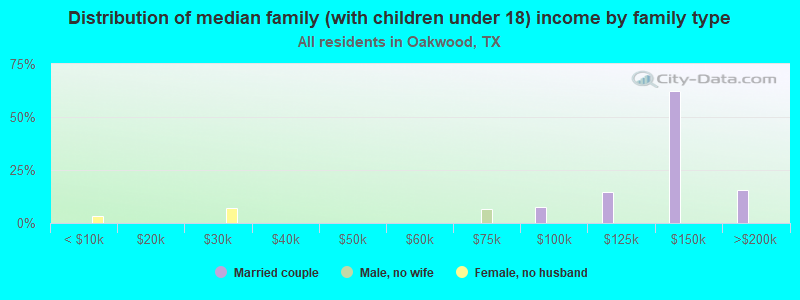
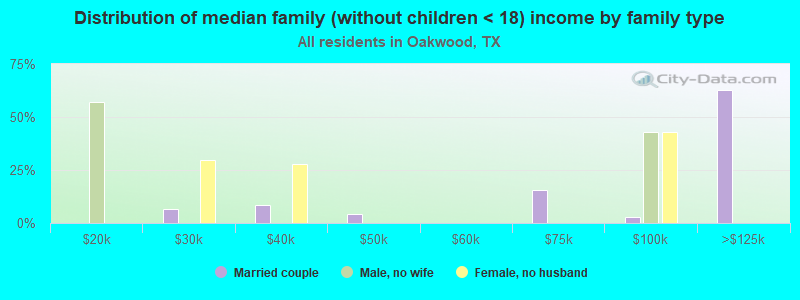
Median family income in Oakwood in 2022:
Oakwood:
$98,602
State:
$86,267
Number of families with income < $10k:
Oakwood:
2.3% (4)
State:
4.0% (297,884)
Number of families with income $10k - 20k:
Oakwood:
4.0% (6)
State:
4.3% (324,514)
Number of families with income $20k - 30k:
Oakwood:
11.1% (17)
State:
5.8% (430,949)
Number of families with income $30k - 40k:
Oakwood:
6.9% (11)
State:
6.6% (493,535)
Number of families with income $40k - 50k:
Oakwood:
2.1% (3)
State:
6.7% (499,663)
Number of families with income $60k - 75k:
Oakwood:
12.6% (19)
Texas:
9.5% (710,229)
Number of families with income $75k - 100k:
Oakwood:
10.4% (16)
Texas:
13.6% (1,015,480)
Number of families with income $100k - 125k:
Oakwood:
36.1% (55)
Texas:
10.7% (797,961)
Number of families with income $125k - 150k:
Oakwood:
11.6% (18)
State:
8.1% (602,985)
Number of families with income $150k - 200k:
Oakwood:
2.8% (4)
Texas:
10.7% (804,459)
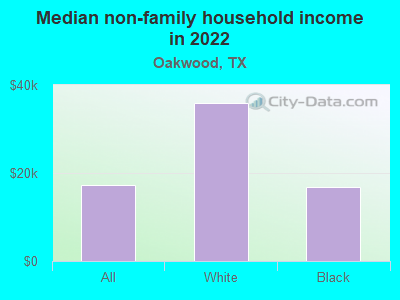
Median non-family income in Oakwood in 2022:
Oakwood:
$17,316
State:
$45,999
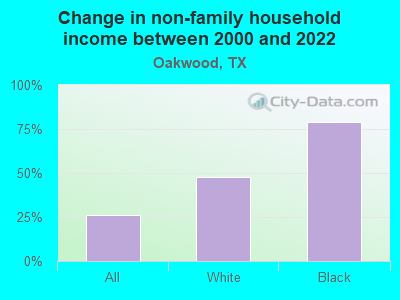
Change in median non-family income between 2000 and 2022:
Oakwood, Texas:
+25.9%
Texas:
+79.5%
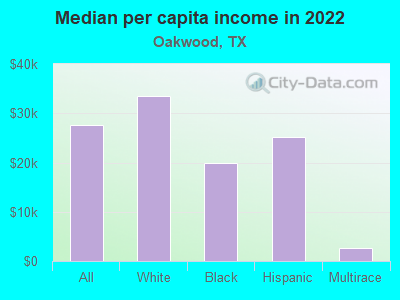
Median per capita income in Oakwood in 2022:
Oakwood:
$27,618
State:
$38,123
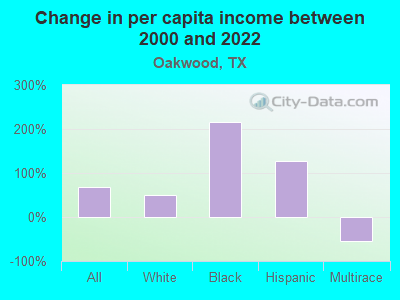
Change in median per capita income between 2000 and 2022:
Oakwood, Texas:
+68.7%
Texas:
+94.3%
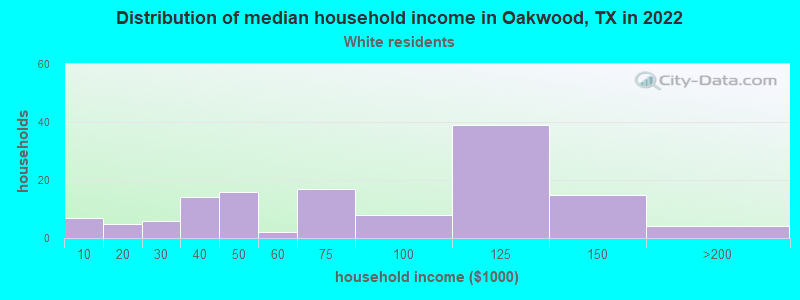
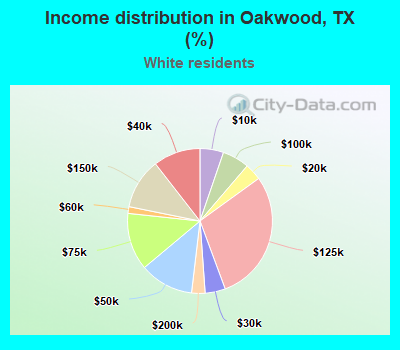
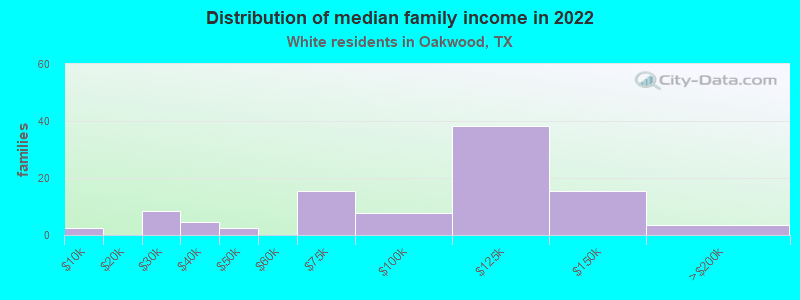
Income statistics for White residents
Median household income in Oakwood, TX in 2022:
Oakwood:
$76,137
State:
$82,032
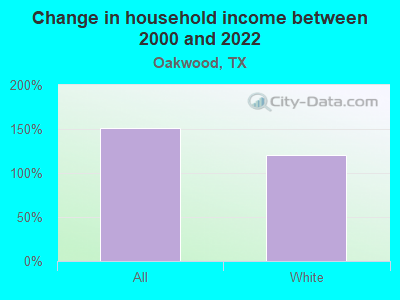
Change in median household income between 2000 and 2022:
Oakwood, Texas:
+120.2%
State:
+91.0%
Number of households with income < $10k:
Oakwood:
5.3% (7)
State:
4.7% (273,716)
Number of households with income $10k - 20k:
Oakwood:
3.8% (5)
State:
5.5% (322,702)
Number of households with income $20k - 30k:
Oakwood:
4.5% (6)
State:
6.2% (363,947)
Number of households with income $30k - 40k:
Oakwood:
10.5% (14)
State:
6.8% (399,275)
Number of households with income $40k - 50k:
Oakwood:
12.0% (16)
Texas:
6.5% (383,417)
Number of households with income $50k - 60k:
Oakwood:
1.5% (2)
State:
6.6% (388,535)
Number of households with income $60k - 75k:
Oakwood:
12.8% (17)
Texas:
9.7% (566,295)
Number of households with income $75k - 100k:
Oakwood:
6.0% (8)
State:
13.0% (760,276)
Number of households with income $100k - 125k:
Oakwood:
29.3% (39)
State:
10.2% (597,596)
Number of households with income $125k - 150k:
Oakwood:
11.3% (15)
Texas:
7.4% (436,830)
Number of households with income $150k - 200k:
Oakwood:
3.0% (4)
State:
9.9% (583,067)
Number of households with income > $200k:
Oakwood:
0.0% (0)
Texas:
13.5% (792,647)
Aggregate household income in Oakwood in 2022: $10,569,097
Median family income in Oakwood in 2022:
Oakwood:
$105,209
State:
$101,788
Number of families with income < $10k:
Oakwood:
2.6% (3)
State:
2.8% (108,142)
Number of families with income $20k - 30k:
Oakwood:
8.7% (9)
State:
4.1% (157,688)
Number of families with income $30k - 40k:
Oakwood:
4.7% (5)
State:
5.2% (198,847)
Number of families with income $40k - 50k:
Oakwood:
2.5% (2)
Texas:
5.6% (216,490)
Number of families with income $60k - 75k:
Oakwood:
15.7% (16)
State:
9.0% (346,106)
Number of families with income $75k - 100k:
Oakwood:
7.9% (8)
State:
13.7% (527,363)
Number of families with income $100k - 125k:
Oakwood:
38.7% (38)
State:
11.6% (448,411)
Number of families with income $125k - 150k:
Oakwood:
15.5% (15)
State:
9.2% (355,798)
Number of families with income $150k - 200k:
Oakwood:
3.6% (4)
State:
12.5% (480,185)
Median non-family income in Oakwood in 2022:
Oakwood:
$35,806
State:
$50,587
Change in median non-family income between 2000 and 2022:
Oakwood, Texas:
+47.8%
Texas:
+87.7%
Median per capita income in Oakwood in 2022:
Oakwood:
$33,593
State:
$47,740
Change in median per capita income between 2000 and 2022:
Oakwood, Texas:
+51.2%
Texas:
+114.3%
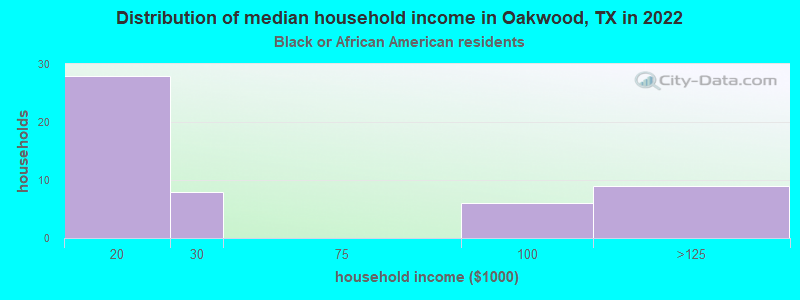
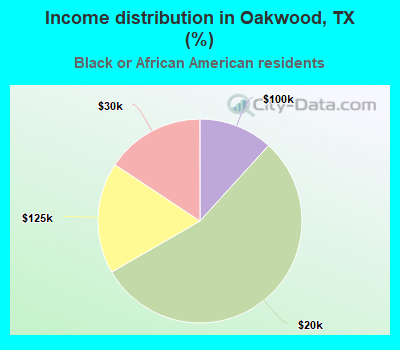
Income statistics for Black or African American residents
Number of households with income < $10k:
Oakwood:
0.0% (0)
State:
8.9% (126,378)
Number of households with income $10k - 20k:
Oakwood:
54.9% (28)
Texas:
9.9% (140,369)
Number of households with income $20k - 30k:
Oakwood:
15.7% (8)
State:
8.5% (120,639)
Number of households with income $30k - 40k:
Oakwood:
0.0% (0)
Texas:
9.7% (137,517)
Number of households with income $40k - 50k:
Oakwood:
0.0% (0)
Texas:
8.0% (112,973)
Number of households with income $50k - 60k:
Oakwood:
0.0% (0)
State:
8.3% (117,156)
Number of households with income $60k - 75k:
Oakwood:
0.0% (0)
Texas:
10.4% (147,462)
Number of households with income $75k - 100k:
Oakwood:
11.8% (6)
Texas:
11.5% (162,718)
Number of households with income $100k - 125k:
Oakwood:
17.6% (9)
Texas:
8.2% (115,829)
Number of households with income $125k - 150k:
Oakwood:
0.0% (0)
State:
4.9% (69,556)
Number of households with income $150k - 200k:
Oakwood:
0.0% (0)
State:
6.4% (90,701)
Number of households with income > $200k:
Oakwood:
0.0% (0)
State:
5.5% (77,988)
Aggregate household income in Oakwood in 2022: $2,141,854
Median non-family income in Oakwood in 2022:
Oakwood:
$16,771
Texas:
$40,133
Change in median non-family income between 2000 and 2022:
Oakwood, Texas:
+78.9%
State:
+102.2%
Median per capita income in Oakwood in 2022:
Oakwood:
$19,981
Texas:
$30,490
Income statistics for Hispanic or Latino residents
Median per capita income in Oakwood in 2022:
Oakwood:
$25,254
Texas:
$24,862
Change in median per capita income between 2000 and 2022:
Oakwood, Texas:
+128.5%
Texas:
+130.8%
Income statistics for Multirace residents
Aggregate household income in Oakwood in 2022: $1,983,323
Median per capita income in Oakwood in 2022:
Oakwood:
$2,704
Texas:
$26,785
Change in median per capita income between 2000 and 2022:: -54.3%
Oakwood, Texas:
-54.3%
State:
+110.9%
Discuss Oakwood, Texas (TX) on our hugely popular Texas forum.