Olequa, Washington (WA) income map, earnings map, and wages data
The median household income in Olequa, WA in 2022 was $70,156, which was 30.1% less than the median annual income of $91,306 across the entire state of Washington. Compared to the median income of $36,071 in 2000 this represents an increase of 48.6%. The per capita income in 2022 was $31,337, which means an increase of 50.6% compared to 2000 when it was $15,483.
Income statistics for all residents
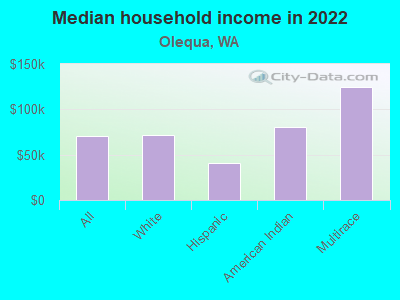
Median household income in Olequa, WA in 2022:| Olequa: | $70,156 |
| State: | $91,306 |
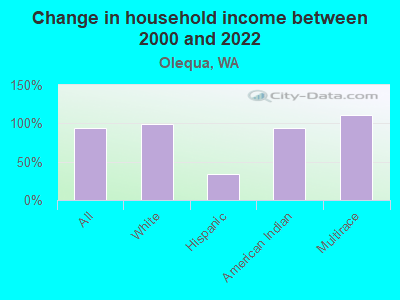
Change in median household income between 2000 and 2022:| Olequa, Washington: | +94.5% |
| State: | +99.5% |
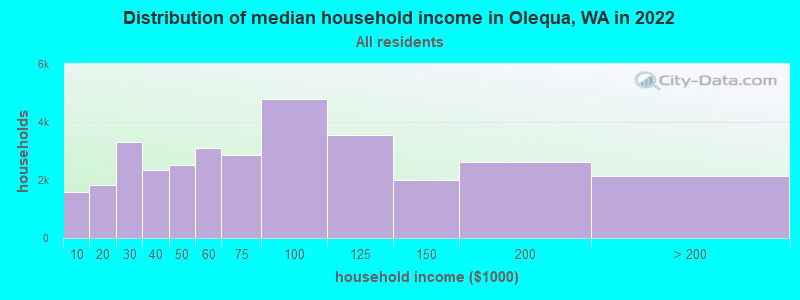
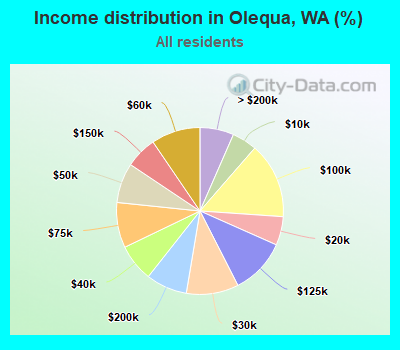
Number of households with income < $10k:| Olequa: | 4.8% (1,581) |
| State: | 4.5% (139,331) |
Number of households with income $10k - 20k:| Olequa: | 5.6% (1,816) |
| Washington: | 5.0% (154,508) |
Number of households with income $20k - 30k:| Olequa: | 10.1% (3,310) |
| State: | 5.4% (166,555) |
Number of households with income $30k - 40k:| Olequa: | 7.2% (2,360) |
| State: | 5.5% (170,324) |
Number of households with income $40k - 50k:| Olequa: | 7.7% (2,526) |
| Washington: | 6.0% (183,941) |
Number of households with income $50k - 60k:| Olequa: | 9.5% (3,103) |
| Washington: | 6.1% (187,395) |
Number of households with income $60k - 75k:| Olequa: | 8.8% (2,867) |
| State: | 8.7% (266,771) |
Number of households with income $75k - 100k:| Olequa: | 14.7% (4,798) |
| State: | 13.1% (404,672) |
Number of households with income $100k - 125k:| Olequa: | 10.8% (3,543) |
| State: | 11.0% (337,911) |
Number of households with income $125k - 150k:| Olequa: | 6.1% (1,999) |
| State: | 8.0% (244,934) |
Number of households with income $150k - 200k:| Olequa: | 8.0% (2,611) |
| State: | 10.5% (323,812) |
Number of households with income > $200k:| Olequa: | 6.6% (2,143) |
| Washington: | 16.2% (499,799) |
Aggregate household income in Olequa in 2022: $135,110,551
Median family income in Olequa in 2022:| Olequa: | $81,980 |
| State: | $109,192 |
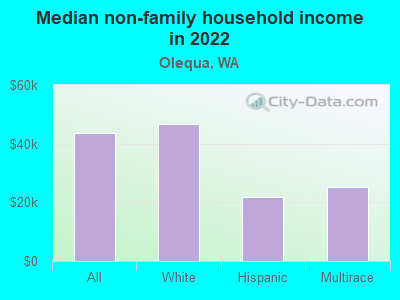
Median non-family income in Olequa in 2022:| Olequa: | $43,646 |
| Washington: | $57,299 |
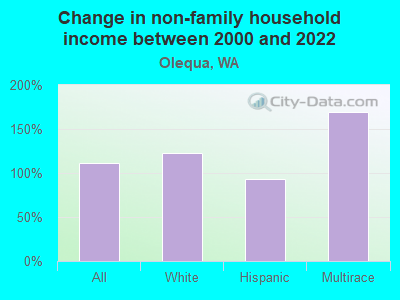
Change in median non-family income between 2000 and 2022:| Olequa, Washington: | +110.9% |
| State: | +94.9% |
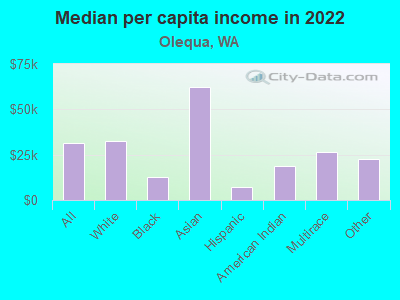
Median per capita income in Olequa in 2022:| Olequa: | $31,338 |
| Washington: | $50,764 |
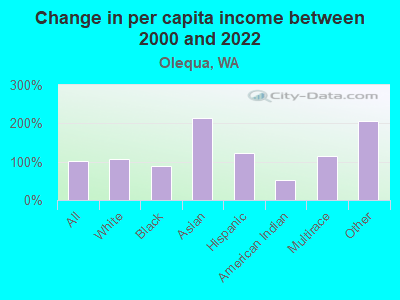
Change in median per capita income between 2000 and 2022:| Olequa, Washington: | +102.4% |
| State: | +121.0% |
Income statistics for White residents
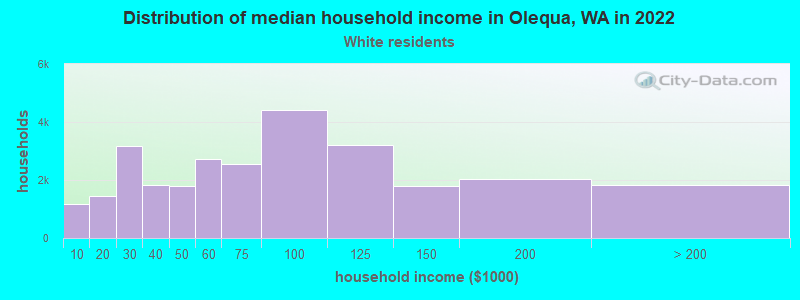
Median household income in Olequa, WA in 2022:| Olequa: | $71,654 |
| State: | $91,916 |
Change in median household income between 2000 and 2022:| Olequa, Washington: | +98.6% |
| State: | +95.4% |
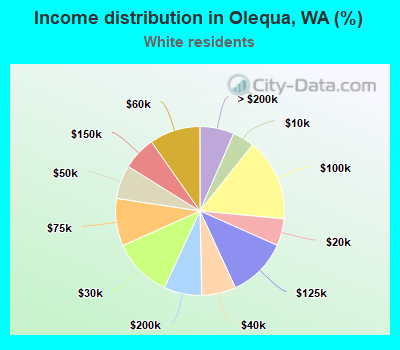
Number of households with income < $10k:| Olequa: | 4.2% (1,160) |
| State: | 4.3% (95,850) |
Number of households with income $10k - 20k:| Olequa: | 5.2% (1,444) |
| State: | 4.8% (106,421) |
Number of households with income $20k - 30k:| Olequa: | 11.4% (3,175) |
| State: | 5.5% (122,860) |
Number of households with income $30k - 40k:| Olequa: | 6.5% (1,830) |
| State: | 5.4% (119,627) |
Number of households with income $40k - 50k:| Olequa: | 6.4% (1,802) |
| State: | 5.9% (132,276) |
Number of households with income $50k - 60k:| Olequa: | 9.7% (2,718) |
| State: | 6.1% (136,212) |
Number of households with income $60k - 75k:| Olequa: | 9.1% (2,543) |
| State: | 8.8% (196,086) |
Number of households with income $75k - 100k:| Olequa: | 15.8% (4,413) |
| State: | 13.4% (299,192) |
Number of households with income $100k - 125k:| Olequa: | 11.5% (3,205) |
| State: | 11.3% (252,209) |
Number of households with income $125k - 150k:| Olequa: | 6.4% (1,795) |
| Washington: | 7.9% (175,962) |
Number of households with income $150k - 200k:| Olequa: | 7.3% (2,031) |
| State: | 10.7% (239,156) |
Number of households with income > $200k:| Olequa: | 6.6% (1,833) |
| Washington: | 16.1% (359,917) |
Aggregate household income in Olequa in 2022: $118,321,724
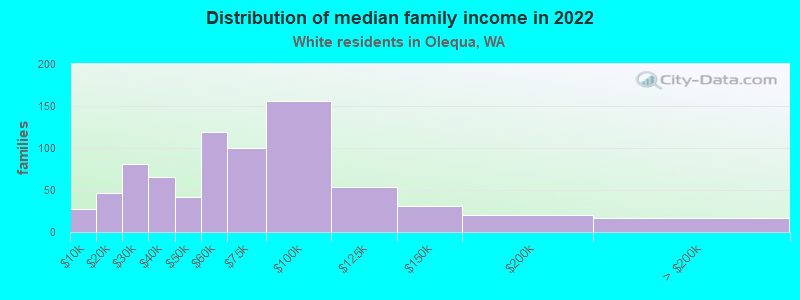
Median family income in Olequa in 2022:| Olequa: | $79,445 |
| State: | $112,511 |
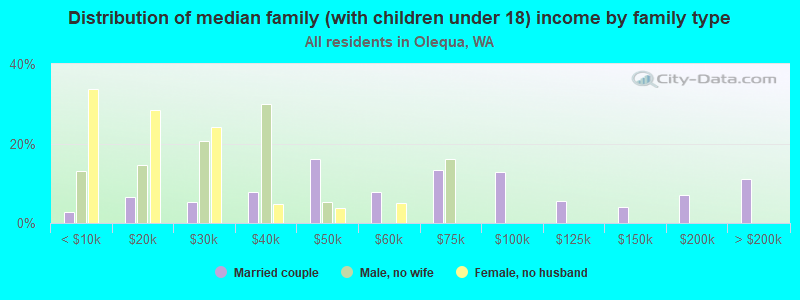
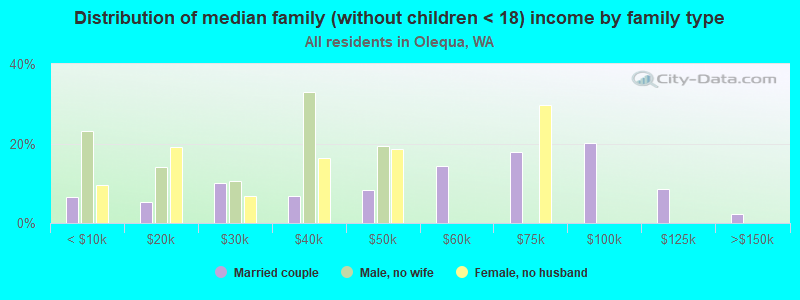
Number of families with income < $10k:| Olequa: | 3.5% (27) |
| Washington: | 2.4% (33,676) |
Number of families with income $10k - 20k:| Olequa: | 6.1% (46) |
| State: | 2.0% (28,228) |
Number of families with income $20k - 30k:| Olequa: | 10.6% (81) |
| State: | 2.9% (39,288) |
Number of families with income $30k - 40k:| Olequa: | 8.7% (66) |
| State: | 3.6% (50,190) |
Number of families with income $40k - 50k:| Olequa: | 5.6% (42) |
| Washington: | 4.6% (63,009) |
Number of families with income $50k - 60k:| Olequa: | 15.8% (119) |
| State: | 5.0% (69,270) |
Number of families with income $60k - 75k:| Olequa: | 13.2% (100) |
| State: | 8.2% (112,369) |
Number of families with income $75k - 100k:| Olequa: | 20.6% (156) |
| State: | 14.1% (194,214) |
Number of families with income $100k - 125k:| Olequa: | 7.1% (54) |
| Washington: | 13.2% (182,184) |
Number of families with income $125k - 150k:| Olequa: | 4.1% (31) |
| Washington: | 9.5% (130,928) |
Number of families with income $150k - 200k:| Olequa: | 2.6% (20) |
| State: | 13.7% (188,621) |
Number of families with income > $200k:| Olequa: | 2.2% (17) |
| State: | 20.8% (285,982) |
Median non-family income in Olequa in 2022:| Olequa: | $46,538 |
| State: | $56,103 |
Change in median non-family income between 2000 and 2022:| Olequa, Washington: | +123.4% |
| State: | +87.7% |
Median per capita income in Olequa in 2022:| Olequa: | $32,734 |
| State: | $55,212 |
Change in median per capita income between 2000 and 2022:| Olequa, Washington: | +108.3% |
| State: | +123.8% |
Income statistics for Black or African American residents
Aggregate household income in Olequa in 2022: $229,253
Median per capita income in Olequa in 2022:| Olequa: | $12,552 |
| State: | $38,209 |
Change in median per capita income between 2000 and 2022:| Olequa, Washington: | +88.3% |
| Washington: | +115.3% |
Income statistics for Asian residents
Aggregate household income in Olequa in 2022: $627,149
Median per capita income in Olequa in 2022:| Olequa: | $62,092 |
| State: | $67,666 |
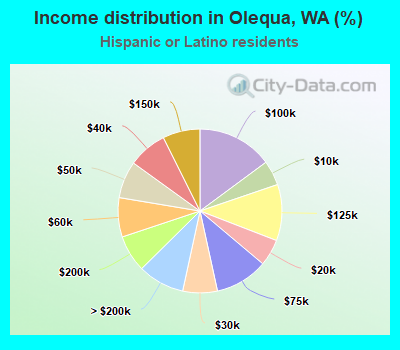
Income statistics for Hispanic or Latino residents
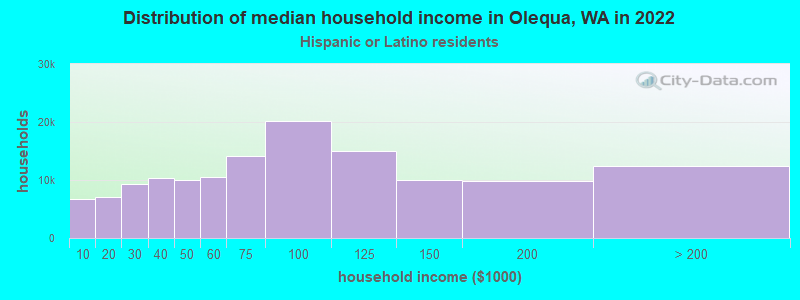
Median household income in Olequa, WA in 2022:| Olequa: | $40,593 |
| Washington: | $74,770 |
Change in median household income between 2000 and 2022:| Olequa, Washington: | +33.9% |
| State: | +128.3% |
Number of households with income < $10k:| Olequa: | 4.9% (6,642) |
| State: | 4.9% (14,456) |
Number of households with income $10k - 20k:| Olequa: | 5.3% (7,152) |
| State: | 5.3% (15,449) |
Number of households with income $20k - 30k:| Olequa: | 6.8% (9,252) |
| State: | 6.8% (20,016) |
Number of households with income $30k - 40k:| Olequa: | 7.7% (10,430) |
| Washington: | 7.7% (22,548) |
Number of households with income $40k - 50k:| Olequa: | 7.3% (9,946) |
| State: | 7.3% (21,450) |
Number of households with income $50k - 60k:| Olequa: | 7.7% (10,504) |
| State: | 7.7% (22,744) |
Number of households with income $60k - 75k:| Olequa: | 10.4% (14,162) |
| Washington: | 10.5% (30,737) |
Number of households with income $75k - 100k:| Olequa: | 14.9% (20,188) |
| State: | 14.9% (43,843) |
Number of households with income $100k - 125k:| Olequa: | 11.1% (15,058) |
| Washington: | 11.1% (32,554) |
Number of households with income $125k - 150k:| Olequa: | 7.4% (9,974) |
| Washington: | 7.4% (21,624) |
Number of households with income $150k - 200k:| Olequa: | 7.3% (9,865) |
| State: | 7.3% (21,360) |
Number of households with income > $200k:| Olequa: | 9.2% (12,489) |
| State: | 9.2% (27,055) |
Aggregate household income in Olequa in 2022: $1,892,198
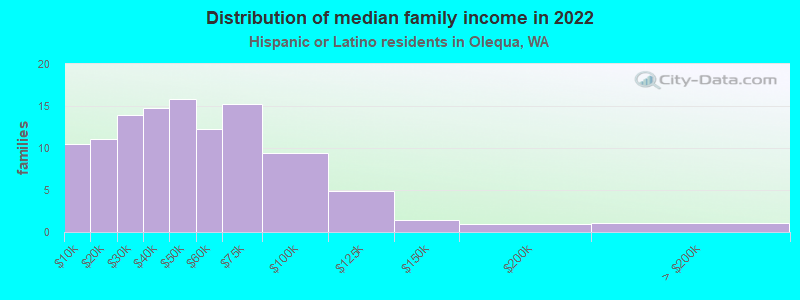
Median family income in Olequa in 2022:| Olequa: | $99,101 |
| State: | $76,866 |
Number of families with income < $10k:| Olequa: | 9.4% (11) |
| State: | 4.4% (9,443) |
Number of families with income $10k - 20k:| Olequa: | 10.0% (11) |
| State: | 3.5% (7,524) |
Number of families with income $20k - 30k:| Olequa: | 12.5% (14) |
| Washington: | 5.6% (12,052) |
Number of families with income $30k - 40k:| Olequa: | 13.2% (15) |
| State: | 8.3% (17,803) |
Number of families with income $40k - 50k:| Olequa: | 14.2% (16) |
| State: | 7.7% (16,361) |
Number of families with income $50k - 60k:| Olequa: | 11.0% (12) |
| Washington: | 7.9% (16,852) |
Number of families with income $60k - 75k:| Olequa: | 13.7% (15) |
| State: | 11.4% (24,342) |
Number of families with income $75k - 100k:| Olequa: | 8.5% (9) |
| Washington: | 14.4% (30,698) |
Number of families with income $100k - 125k:| Olequa: | 4.4% (5) |
| Washington: | 11.4% (24,331) |
Number of families with income $125k - 150k:| Olequa: | 1.3% (1) |
| Washington: | 7.5% (16,099) |
Number of families with income $150k - 200k:| Olequa: | 0.8% (1) |
| State: | 8.2% (17,551) |
Number of families with income > $200k:| Olequa: | 1.0% (1) |
| State: | 9.7% (20,653) |
Median non-family income in Olequa in 2022:| Olequa: | $21,743 |
| Washington: | $54,173 |
Change in median non-family income between 2000 and 2022:| Olequa, Washington: | +93.3% |
| State: | +105.8% |
Median per capita income in Olequa in 2022:| Olequa: | $7,353 |
| State: | $28,252 |
Change in median per capita income between 2000 and 2022:| Olequa, Washington: | +122.6% |
| Washington: | +150.2% |
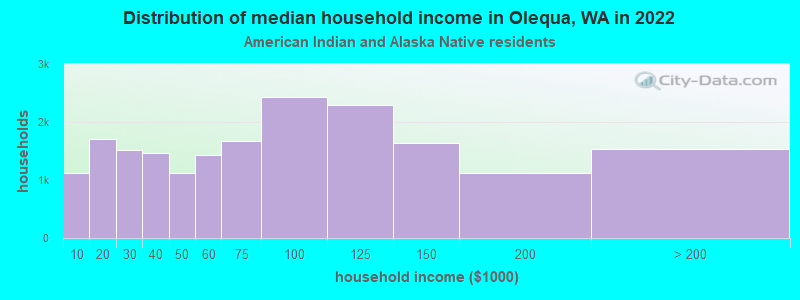
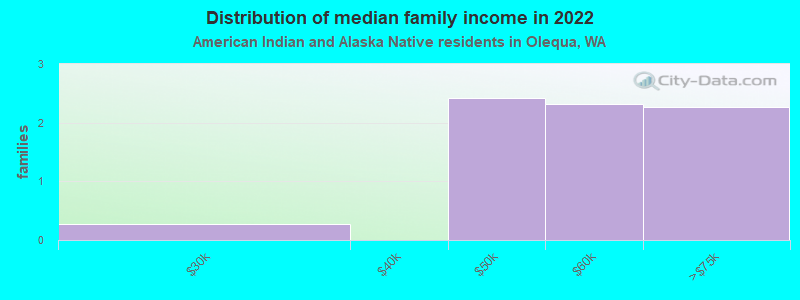
Income statistics for American Indian and Alaska Native residents
Median household income in Olequa, WA in 2022:| Olequa: | $79,964 |
| State: | $71,255 |
Change in median household income between 2000 and 2022:| Olequa, Washington: | +93.9% |
| State: | +118.1% |
Number of households with income < $10k:| Olequa: | 5.9% (1,121) |
| State: | 5.9% (1,768) |
Number of households with income $10k - 20k:| Olequa: | 9.0% (1,711) |
| State: | 8.9% (2,694) |
Number of households with income $20k - 30k:| Olequa: | 8.0% (1,514) |
| State: | 8.0% (2,412) |
Number of households with income $30k - 40k:| Olequa: | 7.7% (1,467) |
| State: | 7.7% (2,327) |
Number of households with income $40k - 50k:| Olequa: | 5.9% (1,121) |
| State: | 5.8% (1,755) |
Number of households with income $50k - 60k:| Olequa: | 7.5% (1,426) |
| State: | 7.5% (2,259) |
Number of households with income $60k - 75k:| Olequa: | 8.8% (1,681) |
| Washington: | 8.8% (2,669) |
Number of households with income $75k - 100k:| Olequa: | 12.7% (2,424) |
| Washington: | 12.8% (3,861) |
Number of households with income $100k - 125k:| Olequa: | 12.0% (2,287) |
| State: | 12.0% (3,618) |
Number of households with income $125k - 150k:| Olequa: | 8.6% (1,634) |
| State: | 8.6% (2,580) |
Number of households with income $150k - 200k:| Olequa: | 5.9% (1,117) |
| State: | 5.9% (1,774) |
Number of households with income > $200k:| Olequa: | 8.0% (1,530) |
| State: | 8.1% (2,447) |
Aggregate household income in Olequa in 2022: $1,274,617
Median family income in Olequa in 2022:| Olequa: | $96,199 |
| State: | $79,010 |
Median per capita income in Olequa in 2022:| Olequa: | $18,924 |
| State: | $27,053 |
Change in median per capita income between 2000 and 2022:| Olequa, Washington: | +51.5% |
| State: | +98.6% |
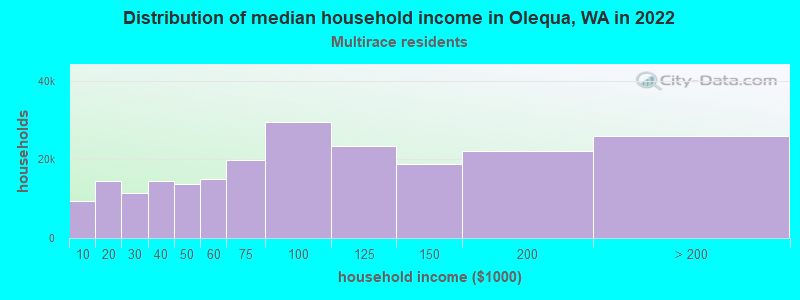
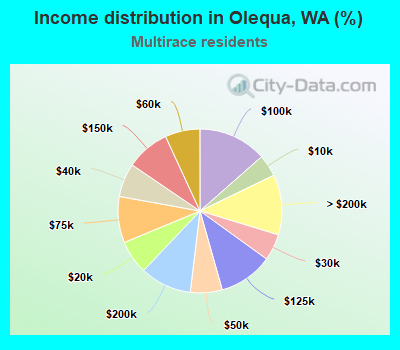
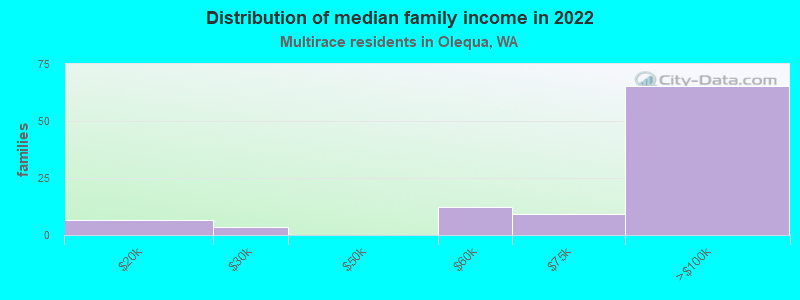
Income statistics for Multirace residents
Median household income in Olequa, WA in 2022:| Olequa: | $124,221 |
| State: | $84,303 |
Change in median household income between 2000 and 2022:| Olequa, Washington: | +111.4% |
| State: | +125.7% |
Number of households with income < $10k:| Olequa: | 4.3% (9,470) |
| State: | 4.3% (12,040) |
Number of households with income $10k - 20k:| Olequa: | 6.6% (14,503) |
| State: | 6.6% (18,437) |
Number of households with income $20k - 30k:| Olequa: | 5.2% (11,446) |
| State: | 5.2% (14,559) |
Number of households with income $30k - 40k:| Olequa: | 6.7% (14,542) |
| State: | 6.7% (18,491) |
Number of households with income $40k - 50k:| Olequa: | 6.3% (13,735) |
| State: | 6.3% (17,459) |
Number of households with income $50k - 60k:| Olequa: | 6.9% (15,005) |
| Washington: | 6.9% (19,086) |
Number of households with income $60k - 75k:| Olequa: | 9.1% (19,909) |
| State: | 9.1% (25,310) |
Number of households with income $75k - 100k:| Olequa: | 13.5% (29,482) |
| State: | 13.5% (37,493) |
Number of households with income $100k - 125k:| Olequa: | 10.7% (23,292) |
| State: | 10.7% (29,626) |
Number of households with income $125k - 150k:| Olequa: | 8.6% (18,794) |
| Washington: | 8.6% (23,899) |
Number of households with income $150k - 200k:| Olequa: | 10.2% (22,197) |
| Washington: | 10.2% (28,214) |
Number of households with income > $200k:| Olequa: | 11.9% (25,908) |
| State: | 11.9% (32,947) |
Aggregate household income in Olequa in 2022: $16,163,214
Median family income in Olequa in 2022:| Olequa: | $199,024 |
| Washington: | $95,629 |
Number of families with income $10k - 20k:| Olequa: | 6.7% (7) |
| State: | 4.3% (7,519) |
Number of families with income $20k - 30k:| Olequa: | 3.6% (4) |
| State: | 4.4% (7,775) |
Number of families with income $50k - 60k:| Olequa: | 12.5% (12) |
| Washington: | 5.6% (9,922) |
Number of families with income $60k - 75k:| Olequa: | 9.5% (9) |
| Washington: | 9.7% (17,113) |
Number of families with income $75k - 100k:| Olequa: | 67.6% (66) |
| State: | 13.6% (23,984) |
Median non-family income in Olequa in 2022:| Olequa: | $25,173 |
| Washington: | $56,573 |
Median per capita income in Olequa in 2022:| Olequa: | $26,290 |
| Washington: | $32,496 |
Change in median per capita income between 2000 and 2022:| Olequa, Washington: | +115.2% |
| State: | +156.8% |
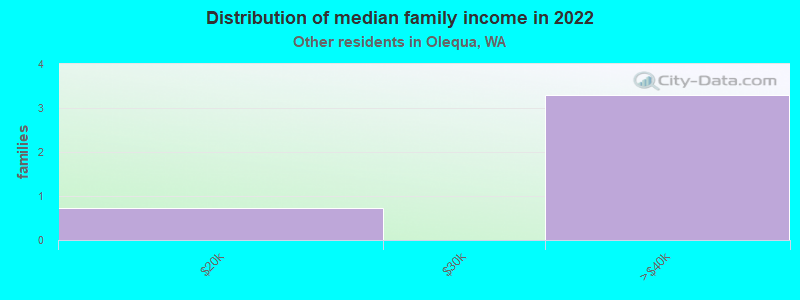
Income statistics for other residents
Aggregate household income in Olequa in 2022: $680,460
Median family income in Olequa in 2022:| Olequa: | $97,208 |
| Washington: | $72,588 |
Median per capita income in Olequa in 2022:| Olequa: | $22,587 |
| State: | $27,542 |