Orange, Wisconsin (WI) income map, earnings map, and wages data
The median household income in Orange, WI in 2022 was $58,796, which was 20.7% less than the median annual income of $70,996 across the entire state of Wisconsin. Compared to the median income of $35,909 in 2000 this represents an increase of 38.9%. The per capita income in 2022 was $34,107, which means an increase of 47.8% compared to 2000 when it was $17,788.
Income statistics for all residents
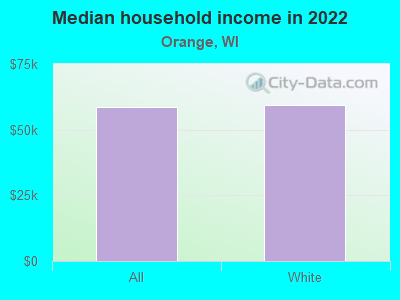
Median household income in Orange, WI in 2022:| Orange: | $58,797 |
| Wisconsin: | $70,996 |
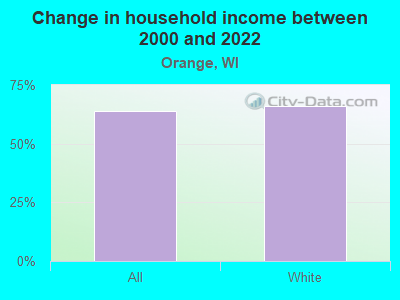
Change in median household income between 2000 and 2022:| Orange, Wisconsin: | +63.7% |
| Wisconsin: | +62.1% |
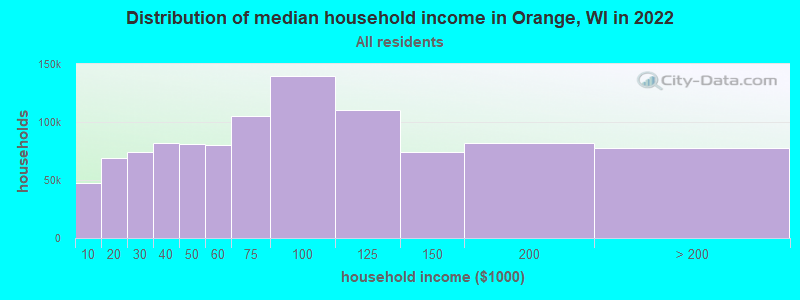
Number of households with income < $10k:| Orange: | 4.6% (47,406) |
| State: | 4.6% (115,058) |
Number of households with income $10k - 20k:| Orange: | 6.8% (69,096) |
| State: | 6.7% (167,685) |
Number of households with income $20k - 30k:| Orange: | 7.3% (74,254) |
| Wisconsin: | 7.2% (180,435) |
Number of households with income $30k - 40k:| Orange: | 8.0% (82,000) |
| State: | 8.0% (199,167) |
Number of households with income $40k - 50k:| Orange: | 7.9% (81,240) |
| Wisconsin: | 7.9% (197,648) |
Number of households with income $50k - 60k:| Orange: | 7.8% (80,228) |
| Wisconsin: | 7.8% (195,297) |
Number of households with income $60k - 75k:| Orange: | 10.3% (105,417) |
| Wisconsin: | 10.3% (256,633) |
Number of households with income $75k - 100k:| Orange: | 13.7% (139,660) |
| State: | 13.7% (340,492) |
Number of households with income $100k - 125k:| Orange: | 10.8% (110,064) |
| State: | 10.8% (268,847) |
Number of households with income $125k - 150k:| Orange: | 7.2% (74,088) |
| State: | 7.3% (180,911) |
Number of households with income $150k - 200k:| Orange: | 8.0% (81,655) |
| Wisconsin: | 8.0% (199,297) |
Number of households with income > $200k:| Orange: | 7.6% (77,851) |
| State: | 7.6% (189,651) |
Aggregate household income in Orange in 2022: $569,418,316
Median family income in Orange in 2022:| Orange: | $67,042 |
| State: | $91,700 |
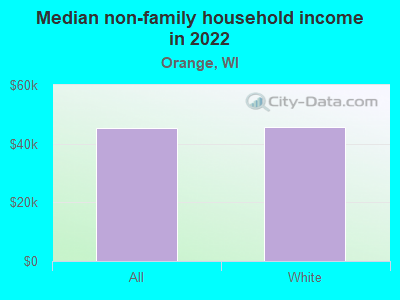
Median non-family income in Orange in 2022:| Orange: | $45,228 |
| State: | $42,812 |
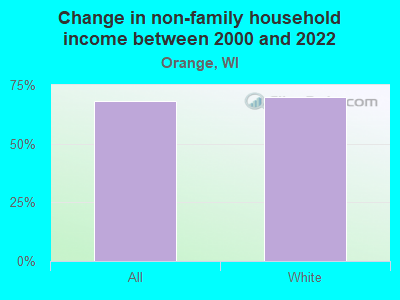
Change in median non-family income between 2000 and 2022:| Orange, Wisconsin: | +68.3% |
| State: | +65.7% |
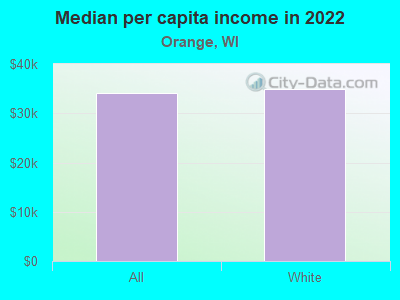
Median per capita income in Orange in 2022:| Orange: | $34,108 |
| Wisconsin: | $40,188 |
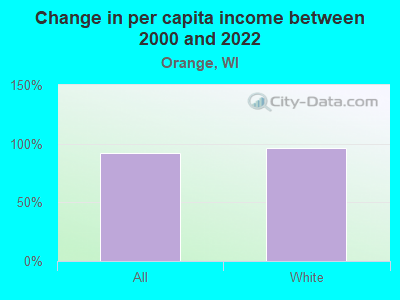
Change in median per capita income between 2000 and 2022:| Orange, Wisconsin: | +91.7% |
| State: | +88.9% |
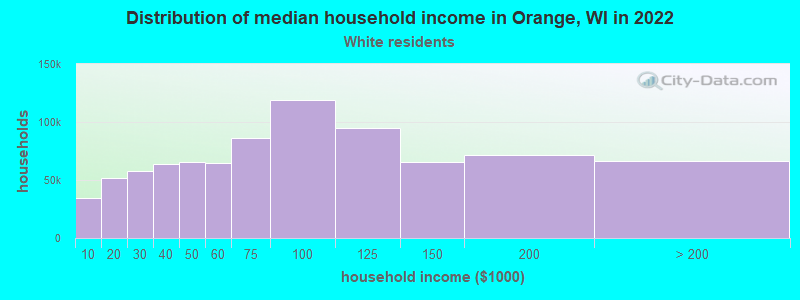
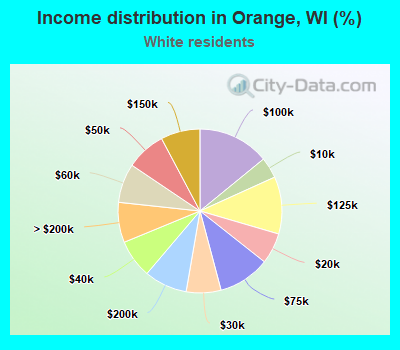
Income statistics for White residents
Median household income in Orange, WI in 2022:| Orange: | $59,578 |
| Wisconsin: | $74,405 |
Change in median household income between 2000 and 2022:| Orange, Wisconsin: | +65.9% |
| Wisconsin: | +64.5% |
Number of households with income < $10k:| Orange: | 4.1% (34,721) |
| Wisconsin: | 4.1% (87,410) |
Number of households with income $10k - 20k:| Orange: | 6.1% (51,457) |
| State: | 6.1% (129,511) |
Number of households with income $20k - 30k:| Orange: | 6.9% (57,683) |
| State: | 6.9% (145,235) |
Number of households with income $30k - 40k:| Orange: | 7.6% (63,644) |
| Wisconsin: | 7.6% (160,205) |
Number of households with income $40k - 50k:| Orange: | 7.8% (65,779) |
| Wisconsin: | 7.8% (165,627) |
Number of households with income $50k - 60k:| Orange: | 7.7% (64,911) |
| State: | 7.7% (163,506) |
Number of households with income $60k - 75k:| Orange: | 10.2% (85,957) |
| State: | 10.2% (216,479) |
Number of households with income $75k - 100k:| Orange: | 14.1% (118,662) |
| Wisconsin: | 14.1% (298,984) |
Number of households with income $100k - 125k:| Orange: | 11.3% (95,030) |
| State: | 11.3% (239,588) |
Number of households with income $125k - 150k:| Orange: | 7.8% (65,266) |
| Wisconsin: | 7.8% (164,502) |
Number of households with income $150k - 200k:| Orange: | 8.5% (71,446) |
| Wisconsin: | 8.5% (180,048) |
Number of households with income > $200k:| Orange: | 7.9% (66,707) |
| State: | 7.9% (167,999) |
Aggregate household income in Orange in 2022: $499,773,760
Median family income in Orange in 2022:| Orange: | $68,121 |
| State: | $96,327 |
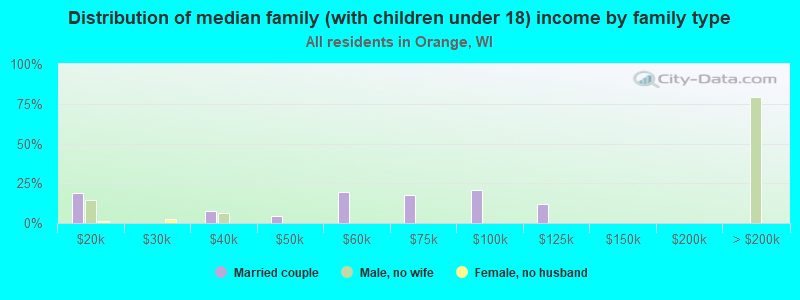
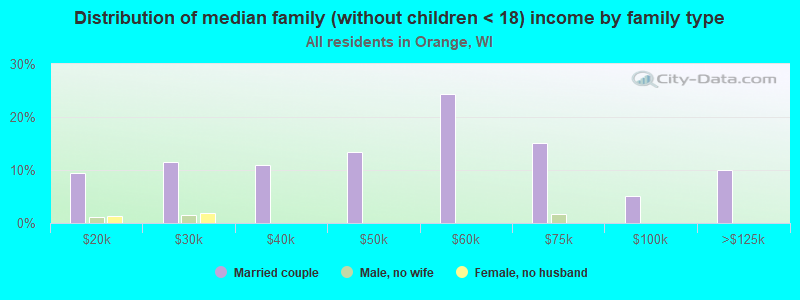
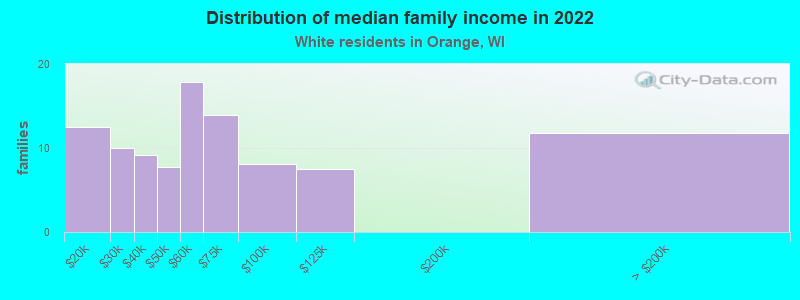
Number of families with income $10k - 20k:| Orange: | 12.7% (12) |
| State: | 2.4% (30,426) |
Number of families with income $20k - 30k:| Orange: | 10.1% (10) |
| State: | 3.5% (45,298) |
Number of families with income $30k - 40k:| Orange: | 9.3% (9) |
| State: | 4.9% (62,935) |
Number of families with income $40k - 50k:| Orange: | 7.8% (8) |
| Wisconsin: | 6.0% (76,575) |
Number of families with income $50k - 60k:| Orange: | 18.1% (18) |
| Wisconsin: | 6.9% (88,079) |
Number of families with income $60k - 75k:| Orange: | 14.1% (14) |
| State: | 10.6% (136,022) |
Number of families with income $75k - 100k:| Orange: | 8.2% (8) |
| Wisconsin: | 16.0% (204,807) |
Number of families with income $100k - 125k:| Orange: | 7.6% (8) |
| Wisconsin: | 14.3% (183,287) |
Number of families with income > $200k:| Orange: | 12.0% (12) |
| State: | 11.2% (143,836) |
Median non-family income in Orange in 2022:| Orange: | $45,696 |
| State: | $44,213 |
Change in median non-family income between 2000 and 2022:| Orange, Wisconsin: | +70.0% |
| State: | +68.5% |
Median per capita income in Orange in 2022:| Orange: | $34,973 |
| State: | $43,415 |
Change in median per capita income between 2000 and 2022:| Orange, Wisconsin: | +96.6% |
| State: | +94.0% |