The median household income in Palisades, TX in 2022 was $67,954, which was 6.4% less than the median annual income of $72,284 across the entire state of Texas. Compared to the median income of $32,188 in 2000 this represents an increase of 52.6%. The per capita income in 2022 was $40,187, which means an increase of 57.7% compared to 2000 when it was $17,011.
Whole page based on the data from 2000 / 2022 when the population of Palisades, Texas was 352 / 336
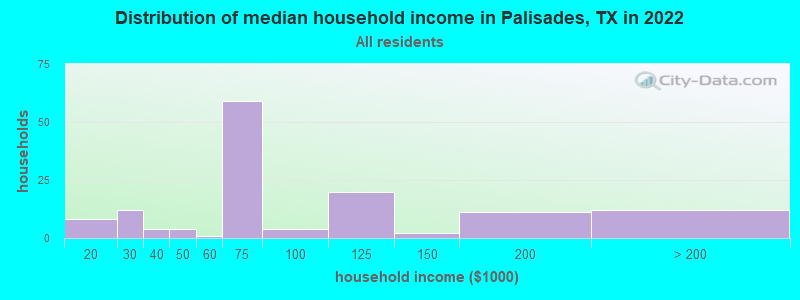
Income statistics for all residents
Median household income in Palisades, TX in 2022:
Palisades:
$67,954
State:
$72,284
Change in median household income between 2000 and 2022:
Palisades, Texas:
+111.1%
State:
+81.0%
Number of households with income < $10k:
Palisades:
0.0% (0)
State:
5.5% (611,011)
Number of households with income $10k - 20k:
Palisades:
5.8% (8)
State:
6.7% (743,157)
Number of households with income $20k - 30k:
Palisades:
8.8% (12)
Texas:
7.2% (803,381)
Number of households with income $30k - 40k:
Palisades:
2.9% (4)
State:
7.8% (866,080)
Number of households with income $40k - 50k:
Palisades:
2.9% (4)
State:
7.3% (810,440)
Number of households with income $50k - 60k:
Palisades:
0.7% (1)
State:
7.2% (799,783)
Number of households with income $60k - 75k:
Palisades:
43.1% (59)
State:
9.9% (1,095,384)
Number of households with income $75k - 100k:
Palisades:
2.9% (4)
State:
12.8% (1,419,057)
Number of households with income $100k - 125k:
Palisades:
14.6% (20)
State:
9.5% (1,054,577)
Number of households with income $125k - 150k:
Palisades:
1.5% (2)
State:
6.7% (741,518)
Number of households with income $150k - 200k:
Palisades:
8.0% (11)
State:
8.7% (961,776)
Number of households with income > $200k:
Palisades:
8.8% (12)
State:
10.7% (1,181,544)
Aggregate household income in Palisades in 2022: $12,852,587
Median family income in Palisades in 2022:
Palisades:
$104,545
State:
$86,267
Number of families with income $10k - 20k:
Palisades:
4.2% (3)
State:
4.3% (324,514)
Number of families with income $20k - 30k:
Palisades:
7.2% (6)
State:
5.8% (430,949)
Number of families with income $40k - 50k:
Palisades:
1.4% (1)
Texas:
6.7% (499,663)
Number of families with income $50k - 60k:
Palisades:
1.6% (1)
State:
6.6% (492,203)
Number of families with income $60k - 75k:
Palisades:
26.1% (20)
State:
9.5% (710,229)
Number of families with income $75k - 100k:
Palisades:
4.0% (3)
State:
13.6% (1,015,480)
Number of families with income $100k - 125k:
Palisades:
23.7% (18)
Texas:
10.7% (797,961)
Number of families with income $125k - 150k:
Palisades:
3.3% (3)
State:
8.1% (602,985)
Number of families with income $150k - 200k:
Palisades:
11.5% (9)
State:
10.7% (804,459)
Number of families with income > $200k:
Palisades:
17.0% (13)
State:
13.5% (1,013,514)
Median non-family income in Palisades in 2022:
Palisades:
$72,783
State:
$45,999
Median per capita income in Palisades in 2022:
Palisades:
$40,188
Texas:
$38,123
Change in median per capita income between 2000 and 2022:
Palisades, Texas:
+136.2%
State:
+94.3%
Income statistics for White residents
Median household income in Palisades, TX in 2022:
Palisades:
$65,311
State:
$82,032
Change in median household income between 2000 and 2022:
Palisades, Texas:
+93.5%
State:
+91.0%
Number of households with income < $10k:
Palisades:
0.0% (0)
State:
4.7% (273,716)
Number of households with income $10k - 20k:
Palisades:
5.3% (6)
Texas:
5.5% (322,702)
Number of households with income $20k - 30k:
Palisades:
12.4% (14)
State:
6.2% (363,947)
Number of households with income $30k - 40k:
Palisades:
3.5% (4)
State:
6.8% (399,275)
Number of households with income $40k - 50k:
Palisades:
3.5% (4)
State:
6.5% (383,417)
Number of households with income $50k - 60k:
Palisades:
0.9% (1)
State:
6.6% (388,535)
Number of households with income $60k - 75k:
Palisades:
42.5% (48)
Texas:
9.7% (566,295)
Number of households with income $75k - 100k:
Palisades:
1.8% (2)
State:
13.0% (760,276)
Number of households with income $100k - 125k:
Palisades:
9.7% (11)
State:
10.2% (597,596)
Number of households with income $125k - 150k:
Palisades:
1.8% (2)
Texas:
7.4% (436,830)
Number of households with income $150k - 200k:
Palisades:
8.0% (9)
State:
9.9% (583,067)
Number of households with income > $200k:
Palisades:
10.6% (12)
Texas:
13.5% (792,647)
Aggregate household income in Palisades in 2022: $10,700,380
Median family income in Palisades in 2022:
Palisades:
$99,168
State:
$101,788
Number of families with income $10k - 20k:
Palisades:
6.9% (4)
State:
2.9% (113,421)
Number of families with income $20k - 30k:
Palisades:
8.8% (5)
Texas:
4.1% (157,688)
Number of families with income $50k - 60k:
Palisades:
1.9% (1)
State:
5.7% (220,689)
Number of families with income $60k - 75k:
Palisades:
27.8% (17)
Texas:
9.0% (346,106)
Number of families with income $75k - 100k:
Palisades:
2.8% (2)
State:
13.7% (527,363)
Number of families with income $100k - 125k:
Palisades:
16.4% (10)
State:
11.6% (448,411)
Number of families with income $125k - 150k:
Palisades:
3.2% (2)
State:
9.2% (355,798)
Number of families with income $150k - 200k:
Palisades:
12.4% (8)
State:
12.5% (480,185)
Number of families with income > $200k:
Palisades:
19.7% (12)
State:
17.6% (677,490)
Median non-family income in Palisades in 2022:
Palisades:
$74,006
State:
$50,587
Median per capita income in Palisades in 2022:
Palisades:
$43,660
Texas:
$47,740
Income statistics for Hispanic or Latino residents
Aggregate household income in Palisades in 2022: $1,827,557
Median per capita income in Palisades in 2022:
Palisades:
$32,779
Texas:
$24,862
Change in median per capita income between 2000 and 2022:
Palisades, Texas:
+104.9%
State:
+130.8%
Income statistics for Multirace residents
Aggregate household income in Palisades in 2022: $726,790
Median per capita income in Palisades in 2022:
Palisades:
$55,401
State:
$26,785
Income statistics for other residents
Median per capita income in Palisades in 2022:
Palisades:
$21,498
Texas:
$23,899
Discuss Palisades, Texas (TX) on our hugely popular Texas forum.