Pastoria, Virginia (VA) income map, earnings map, and wages data
Data:
The per capita income in 2022 was $27,667, which means an increase of 41.1% compared to 2000 when it was $16,309.
Whole page based on the data from 2000 / 2022 when the population of Pastoria, Virginia was 649 / 766
Income statistics for all residents
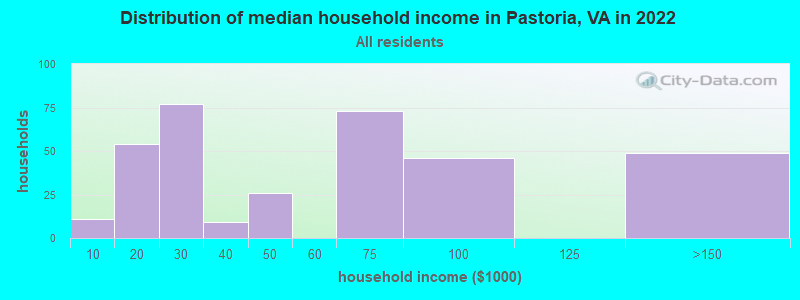
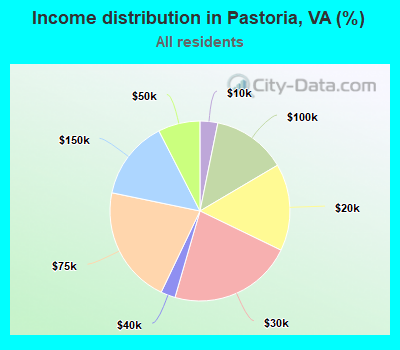
Number of households with income < $10k:| Pastoria: | 3.2% (11) |
| Virginia: | 4.9% (165,315) |
Number of households with income $10k - 20k:| Pastoria: | 15.7% (54) |
| Virginia: | 5.9% (199,380) |
Number of households with income $20k - 30k:| Pastoria: | 22.3% (77) |
| Virginia: | 6.0% (202,243) |
Number of households with income $30k - 40k:| Pastoria: | 2.6% (9) |
| State: | 6.1% (205,967) |
Number of households with income $40k - 50k:| Pastoria: | 7.5% (26) |
| State: | 6.4% (215,648) |
Number of households with income $50k - 60k:| Pastoria: | 0.0% (0) |
| State: | 6.2% (210,516) |
Number of households with income $60k - 75k:| Pastoria: | 21.2% (73) |
| Virginia: | 8.6% (292,112) |
Number of households with income $75k - 100k:| Pastoria: | 13.3% (46) |
| State: | 12.2% (412,198) |
Number of households with income $100k - 125k:| Pastoria: | 0.0% (0) |
| Virginia: | 10.3% (348,998) |
Number of households with income $125k - 150k:| Pastoria: | 14.2% (49) |
| State: | 7.7% (261,236) |
Number of households with income $150k - 200k:| Pastoria: | 0.0% (0) |
| State: | 10.3% (347,282) |
Number of households with income > $200k:| Pastoria: | 0.0% (0) |
| State: | 15.4% (519,712) |
Aggregate household income in Pastoria in 2022: $19,843,563
Median family income in Pastoria in 2022:| Pastoria: | $71,606 |
| State: | $107,101 |
Number of families with income $20k - 30k:| Pastoria: | 27.2% (66) |
| Virginia: | 4.0% (87,860) |
Number of families with income $30k - 40k:| Pastoria: | 3.6% (9) |
| State: | 4.7% (103,002) |
Number of families with income $40k - 50k:| Pastoria: | 10.7% (26) |
| State: | 5.4% (118,579) |
Number of families with income $60k - 75k:| Pastoria: | 26.4% (64) |
| State: | 8.2% (180,564) |
Number of families with income $75k - 100k:| Pastoria: | 12.1% (29) |
| State: | 12.6% (277,221) |
Number of families with income $125k - 150k:| Pastoria: | 19.9% (48) |
| State: | 9.0% (197,999) |
Median income for families with 0 earners:
Median income for families with 1 earner:
Median income for families with 2 earners:| Pastoria: | $136,725 |
| Virginia: | $135,708 |
Median income for families with 3+ earners:| Pastoria: | $0 |
| Virginia: | $161,746 |
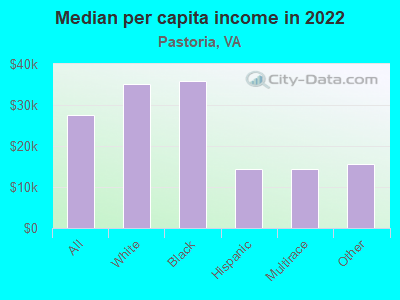
Median per capita income in Pastoria in 2022:| Pastoria: | $27,668 |
| State: | $47,199 |
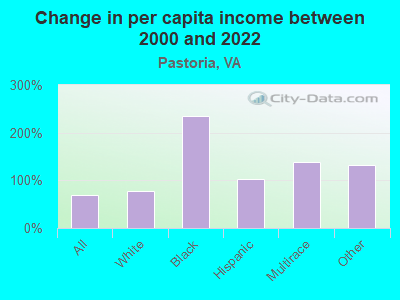
Change in median per capita income between 2000 and 2022:| Pastoria, Virginia: | +69.6% |
| Virginia: | +96.9% |
Income statistics for White residents
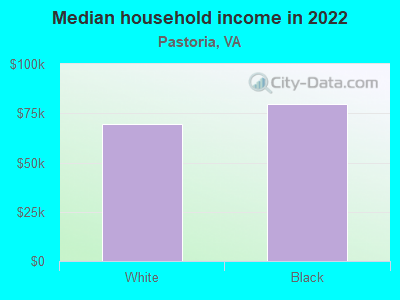
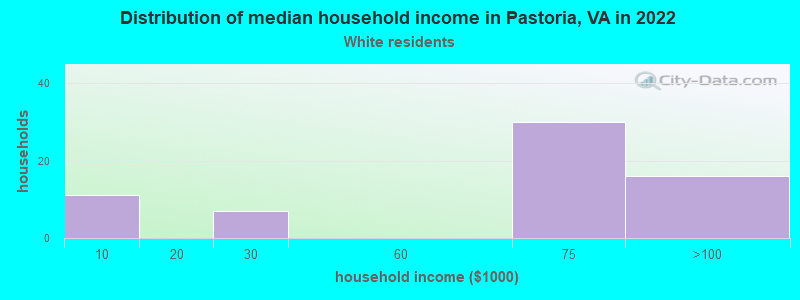
Median household income in Pastoria, VA in 2022:| Pastoria: | $69,405 |
| State: | $91,924 |
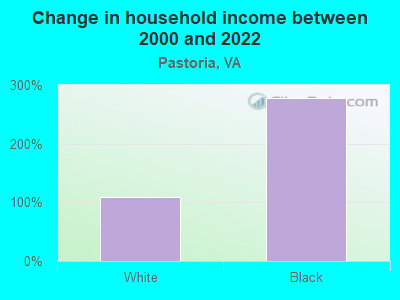
Change in median household income between 2000 and 2022:| Pastoria, Virginia: | +109.1% |
| State: | +81.9% |
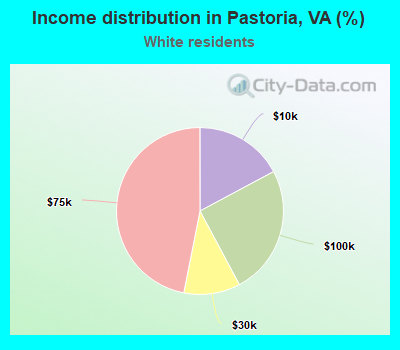
Number of households with income < $10k:| Pastoria: | 17.2% (11) |
| State: | 4.1% (90,549) |
Number of households with income $10k - 20k:| Pastoria: | 0.0% (0) |
| State: | 5.2% (114,324) |
Number of households with income $20k - 30k:| Pastoria: | 10.9% (7) |
| State: | 5.7% (125,676) |
Number of households with income $30k - 40k:| Pastoria: | 0.0% (0) |
| State: | 5.5% (121,220) |
Number of households with income $40k - 50k:| Pastoria: | 0.0% (0) |
| State: | 6.0% (133,011) |
Number of households with income $50k - 60k:| Pastoria: | 0.0% (0) |
| Virginia: | 6.2% (136,856) |
Number of households with income $60k - 75k:| Pastoria: | 46.9% (30) |
| State: | 8.4% (186,094) |
Number of households with income $75k - 100k:| Pastoria: | 25.0% (16) |
| Virginia: | 12.5% (277,077) |
Number of households with income $100k - 125k:| Pastoria: | 0.0% (0) |
| State: | 10.8% (237,562) |
Number of households with income $125k - 150k:| Pastoria: | 0.0% (0) |
| State: | 8.0% (177,532) |
Number of households with income $150k - 200k:| Pastoria: | 0.0% (0) |
| Virginia: | 11.0% (242,106) |
Number of households with income > $200k:| Pastoria: | 0.0% (0) |
| State: | 16.6% (366,064) |
Aggregate household income in Pastoria in 2022: $3,557,306
Median non-family income in Pastoria in 2022:| Pastoria: | $58,997 |
| Virginia: | $53,785 |
Median per capita income in Pastoria in 2022:| Pastoria: | $35,214 |
| Virginia: | $53,456 |
Change in median per capita income between 2000 and 2022:| Pastoria, Virginia: | +77.9% |
| State: | +99.2% |
Income statistics for Black or African American residents
Median household income in Pastoria, VA in 2022:| Pastoria: | $79,522 |
| State: | $60,526 |
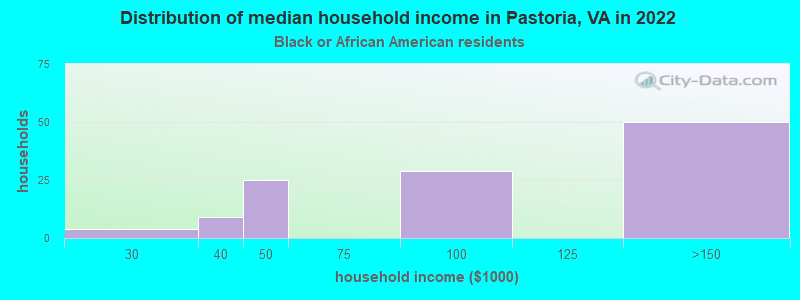
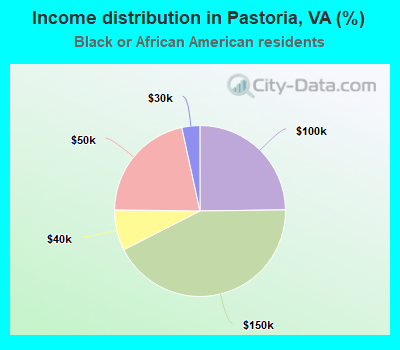
Number of households with income < $10k:| Pastoria: | 0.0% (0) |
| State: | 8.3% (52,649) |
Number of households with income $10k - 20k:| Pastoria: | 0.0% (0) |
| State: | 9.6% (60,583) |
Number of households with income $20k - 30k:| Pastoria: | 3.4% (4) |
| Virginia: | 8.1% (51,220) |
Number of households with income $30k - 40k:| Pastoria: | 7.7% (9) |
| Virginia: | 8.6% (54,185) |
Number of households with income $40k - 50k:| Pastoria: | 21.4% (25) |
| State: | 8.1% (51,156) |
Number of households with income $50k - 60k:| Pastoria: | 0.0% (0) |
| State: | 7.0% (44,637) |
Number of households with income $60k - 75k:| Pastoria: | 0.0% (0) |
| State: | 9.8% (62,332) |
Number of households with income $75k - 100k:| Pastoria: | 24.8% (29) |
| State: | 11.4% (72,479) |
Number of households with income $100k - 125k:| Pastoria: | 0.0% (0) |
| State: | 8.5% (53,997) |
Number of households with income $125k - 150k:| Pastoria: | 42.7% (50) |
| State: | 6.3% (40,032) |
Number of households with income $150k - 200k:| Pastoria: | 0.0% (0) |
| State: | 6.9% (43,513) |
Number of households with income > $200k:| Pastoria: | 0.0% (0) |
| State: | 7.4% (46,851) |
Aggregate household income in Pastoria in 2022: $10,821,873
Median per capita income in Pastoria in 2022:| Pastoria: | $35,768 |
| State: | $34,599 |
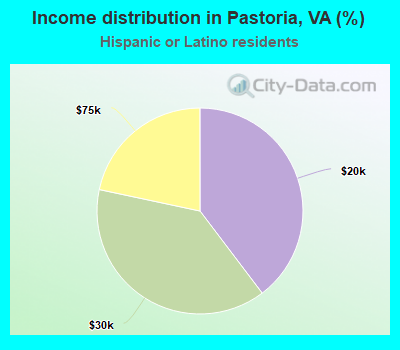
Income statistics for Hispanic or Latino residents
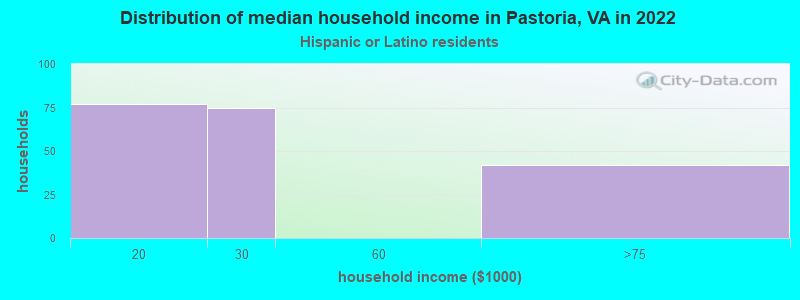
Number of households with income < $10k:| Pastoria: | 0.0% (0) |
| State: | 4.6% (11,664) |
Number of households with income $10k - 20k:| Pastoria: | 39.7% (77) |
| State: | 4.9% (12,443) |
Number of households with income $20k - 30k:| Pastoria: | 38.7% (75) |
| Virginia: | 5.9% (14,859) |
Number of households with income $30k - 40k:| Pastoria: | 0.0% (0) |
| Virginia: | 6.8% (17,059) |
Number of households with income $40k - 50k:| Pastoria: | 0.0% (0) |
| Virginia: | 6.4% (16,261) |
Number of households with income $50k - 60k:| Pastoria: | 0.0% (0) |
| State: | 6.9% (17,468) |
Number of households with income $60k - 75k:| Pastoria: | 21.6% (42) |
| Virginia: | 9.6% (24,193) |
Number of households with income $75k - 100k:| Pastoria: | 0.0% (0) |
| State: | 13.2% (33,405) |
Number of households with income $100k - 125k:| Pastoria: | 0.0% (0) |
| State: | 10.5% (26,356) |
Number of households with income $125k - 150k:| Pastoria: | 0.0% (0) |
| State: | 8.1% (20,494) |
Number of households with income $150k - 200k:| Pastoria: | 0.0% (0) |
| State: | 9.5% (23,943) |
Number of households with income > $200k:| Pastoria: | 0.0% (0) |
| Virginia: | 13.5% (33,987) |
Aggregate household income in Pastoria in 2022: $5,583,975
Median per capita income in Pastoria in 2022:| Pastoria: | $14,509 |
| State: | $32,277 |
Change in median per capita income between 2000 and 2022:| Pastoria, Virginia: | +103.1% |
| State: | +104.6% |
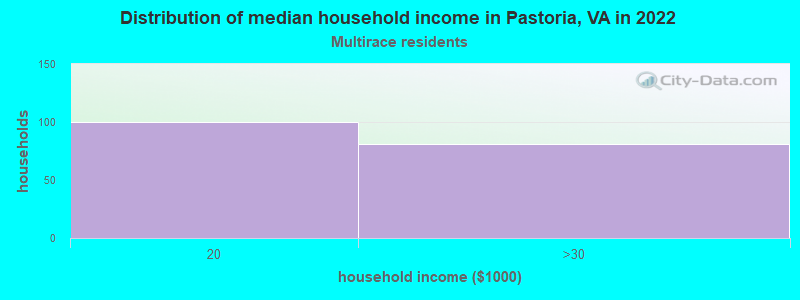
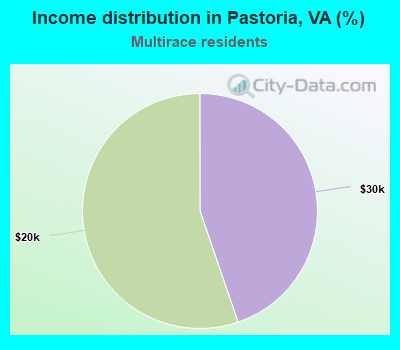
Income statistics for Multirace residents
Number of households with income < $10k:| Pastoria: | 0.0% (0) |
| State: | 4.1% (9,125) |
Number of households with income $10k - 20k:| Pastoria: | 55.2% (100) |
| State: | 5.9% (12,969) |
Number of households with income $20k - 30k:| Pastoria: | 44.8% (81) |
| State: | 4.8% (10,563) |
Number of households with income $30k - 40k:| Pastoria: | 0.0% (0) |
| Virginia: | 6.6% (14,553) |
Number of households with income $40k - 50k:| Pastoria: | 0.0% (0) |
| Virginia: | 5.2% (11,391) |
Number of households with income $50k - 60k:| Pastoria: | 0.0% (0) |
| State: | 6.8% (14,994) |
Number of households with income $60k - 75k:| Pastoria: | 0.0% (0) |
| Virginia: | 8.8% (19,323) |
Number of households with income $75k - 100k:| Pastoria: | 0.0% (0) |
| State: | 12.1% (26,729) |
Number of households with income $100k - 125k:| Pastoria: | 0.0% (0) |
| State: | 10.4% (22,807) |
Number of households with income $125k - 150k:| Pastoria: | 0.0% (0) |
| Virginia: | 8.1% (17,881) |
Number of households with income $150k - 200k:| Pastoria: | 0.0% (0) |
| State: | 10.4% (22,979) |
Number of households with income > $200k:| Pastoria: | 0.0% (0) |
| State: | 16.7% (36,748) |
Aggregate household income in Pastoria in 2022: $56,180,849
Median per capita income in Pastoria in 2022:| Pastoria: | $14,335 |
| State: | $34,385 |
Change in median per capita income between 2000 and 2022:| Pastoria, Virginia: | +137.8% |
| State: | +130.2% |
Income statistics for other residents
Number of households with income < $10k:| Pastoria: | 0.0% (0) |
| State: | 5.1% (5,333) |
Number of households with income $10k - 20k:| Pastoria: | 0.0% (0) |
| State: | 4.3% (4,478) |
Number of households with income $20k - 30k:| Pastoria: | 0.0% (0) |
| State: | 7.3% (7,629) |
Number of households with income $30k - 40k:| Pastoria: | 0.0% (0) |
| State: | 7.8% (8,201) |
Number of households with income $40k - 50k:| Pastoria: | 0.0% (0) |
| State: | 10.1% (10,533) |
Number of households with income $50k - 60k:| Pastoria: | 0.0% (0) |
| State: | 5.4% (5,653) |
Number of households with income $60k - 75k:| Pastoria: | 100.0% (51) |
| State: | 10.2% (10,650) |
Number of households with income $75k - 100k:| Pastoria: | 0.0% (0) |
| Virginia: | 12.9% (13,493) |
Number of households with income $100k - 125k:| Pastoria: | 0.0% (0) |
| State: | 9.7% (10,131) |
Number of households with income $125k - 150k:| Pastoria: | 0.0% (0) |
| State: | 8.2% (8,624) |
Number of households with income $150k - 200k:| Pastoria: | 0.0% (0) |
| State: | 8.2% (8,609) |
Number of households with income > $200k:| Pastoria: | 0.0% (0) |
| State: | 10.8% (11,336) |
Aggregate household income in Pastoria in 2022: $57,568,849
Median per capita income in Pastoria in 2022:| Pastoria: | $15,557 |
| State: | $29,023 |
Change in median per capita income between 2000 and 2022:| Pastoria, Virginia: | +131.7% |
| Virginia: | +110.3% |