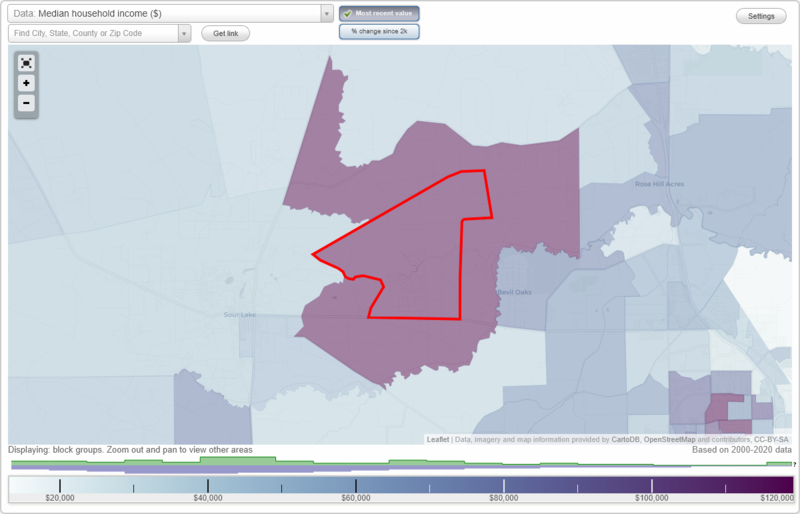
The median household income in Pinewood Estates, TX in 2022 was $133,754, which was 46.0% greater than the median annual income of $72,284 across the entire state of Texas. Compared to the median income of $72,917 in 2000 this represents an increase of 45.5%. The per capita income in 2022 was $43,946, which means an increase of 35.5% compared to 2000 when it was $28,350.
Whole page based on the data from 2000 / 2022 when the population of Pinewood Estates, Texas was 1,633 / 1,574
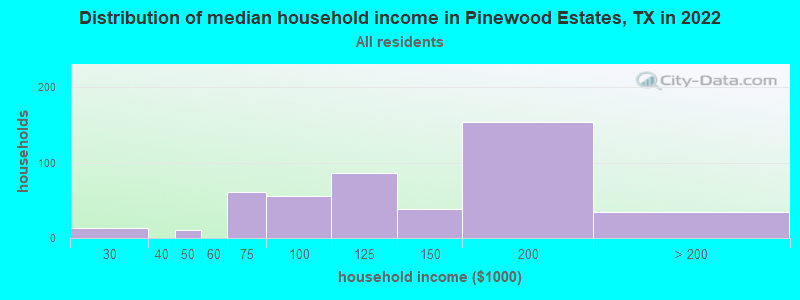
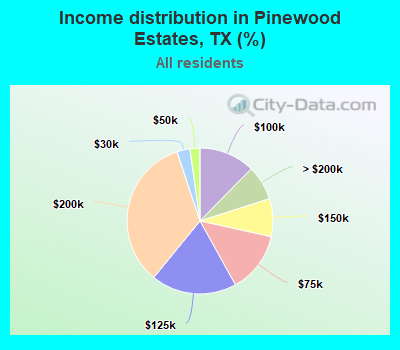
Income statistics for all residents
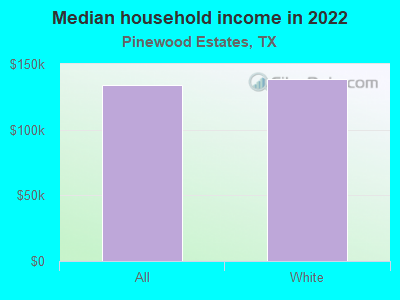
Median household income in Pinewood Estates, TX in 2022:
Pinewood Estates:
$133,754
State:
$72,284
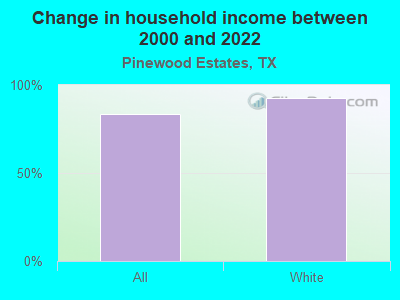
Change in median household income between 2000 and 2022:
Pinewood Estates, Texas:
+83.4%
Texas:
+81.0%
Number of households with income < $10k:
Pinewood Estates:
0.0% (0)
State:
5.5% (611,011)
Number of households with income $10k - 20k:
Pinewood Estates:
0.0% (0)
State:
6.7% (743,157)
Number of households with income $20k - 30k:
Pinewood Estates:
2.9% (13)
Texas:
7.2% (803,381)
Number of households with income $30k - 40k:
Pinewood Estates:
0.0% (0)
Texas:
7.8% (866,080)
Number of households with income $40k - 50k:
Pinewood Estates:
2.2% (10)
State:
7.3% (810,440)
Number of households with income $50k - 60k:
Pinewood Estates:
0.0% (0)
Texas:
7.2% (799,783)
Number of households with income $60k - 75k:
Pinewood Estates:
13.5% (61)
Texas:
9.9% (1,095,384)
Number of households with income $75k - 100k:
Pinewood Estates:
12.4% (56)
State:
12.8% (1,419,057)
Number of households with income $100k - 125k:
Pinewood Estates:
19.0% (86)
State:
9.5% (1,054,577)
Number of households with income $125k - 150k:
Pinewood Estates:
8.4% (38)
Texas:
6.7% (741,518)
Number of households with income $150k - 200k:
Pinewood Estates:
34.0% (154)
Texas:
8.7% (961,776)
Number of households with income > $200k:
Pinewood Estates:
7.7% (35)
State:
10.7% (1,181,544)
Aggregate household income in Pinewood Estates in 2022: $68,072,080
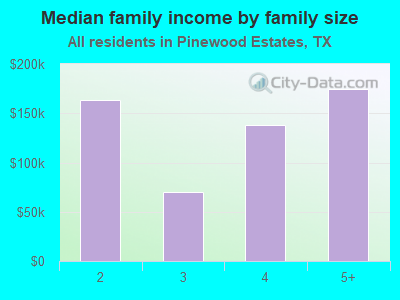
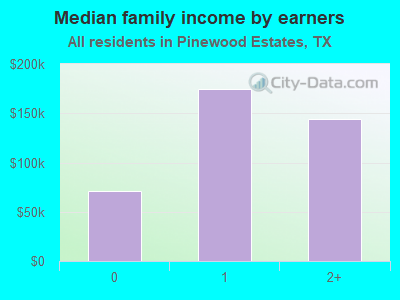
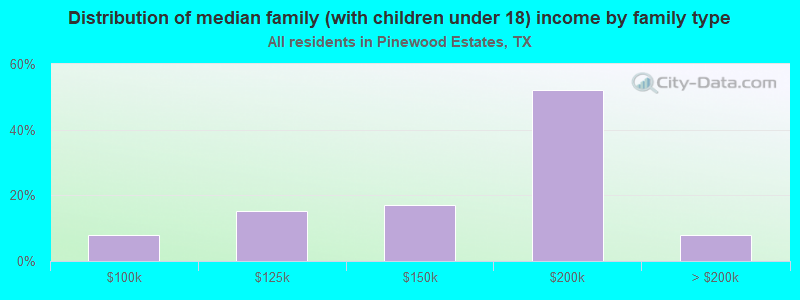
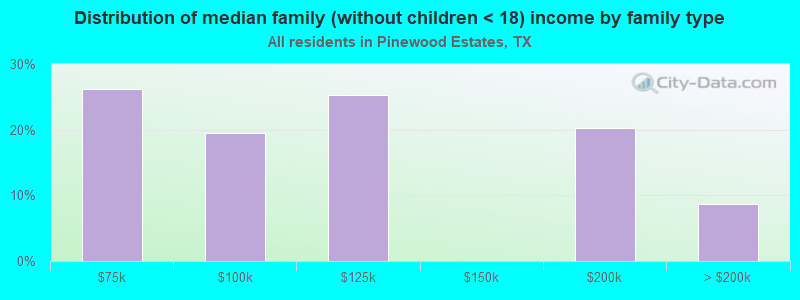
Median family income in Pinewood Estates in 2022:
Pinewood Estates:
$134,470
Texas:
$86,267
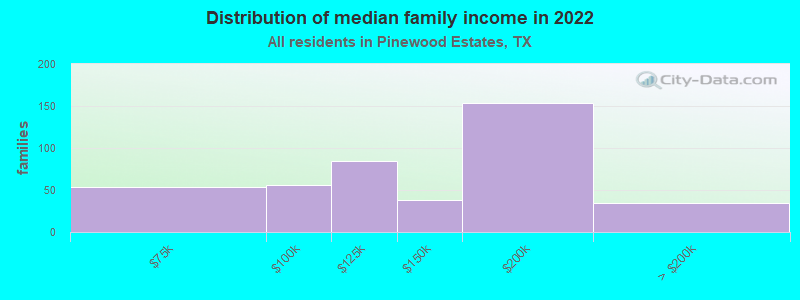
Number of families with income $60k - 75k:
Pinewood Estates:
12.7% (53)
State:
9.5% (710,229)
Number of families with income $75k - 100k:
Pinewood Estates:
13.3% (56)
State:
13.6% (1,015,480)
Number of families with income $100k - 125k:
Pinewood Estates:
20.1% (84)
State:
10.7% (797,961)
Number of families with income $125k - 150k:
Pinewood Estates:
9.1% (38)
Texas:
8.1% (602,985)
Number of families with income $150k - 200k:
Pinewood Estates:
36.5% (153)
State:
10.7% (804,459)
Number of families with income > $200k:
Pinewood Estates:
8.3% (35)
Texas:
13.5% (1,013,514)
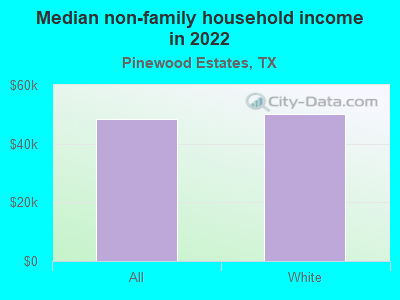
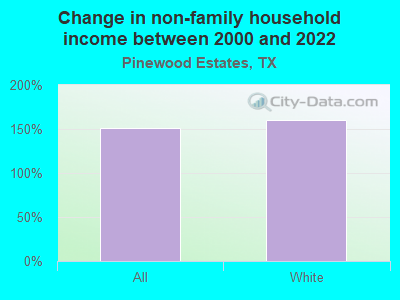
Median non-family income in Pinewood Estates in 2022:
Pinewood Estates:
$48,314
State:
$45,999
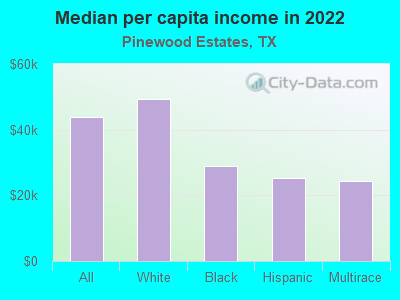
Median per capita income in Pinewood Estates in 2022:
Pinewood Estates:
$43,946
State:
$38,123
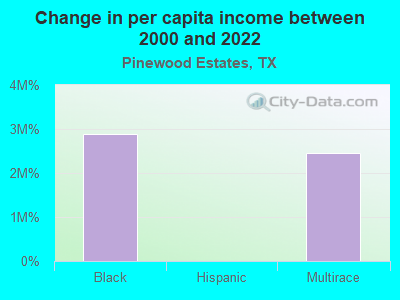
Change in median per capita income between 2000 and 2022:
Pinewood Estates, Texas:
+55.0%
State:
+94.3%
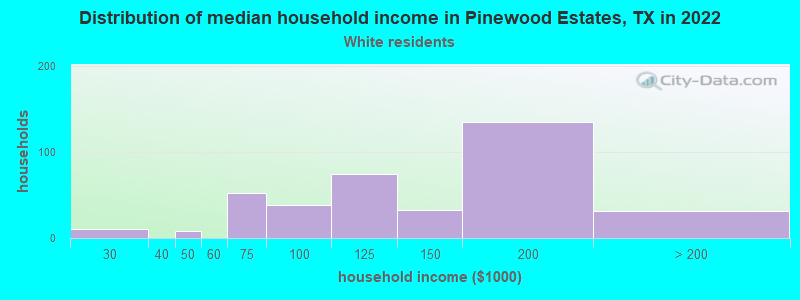
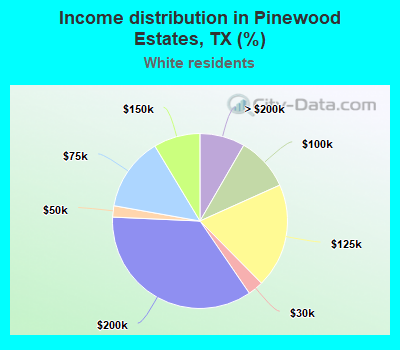
Income statistics for White residents
Median household income in Pinewood Estates, TX in 2022:
Pinewood Estates:
$138,886
State:
$82,032
Change in median household income between 2000 and 2022:
Pinewood Estates, Texas:
+92.8%
Texas:
+91.0%
Number of households with income < $10k:
Pinewood Estates:
0.0% (0)
State:
4.7% (273,716)
Number of households with income $10k - 20k:
Pinewood Estates:
0.0% (0)
State:
5.5% (322,702)
Number of households with income $20k - 30k:
Pinewood Estates:
2.9% (11)
State:
6.2% (363,947)
Number of households with income $30k - 40k:
Pinewood Estates:
0.0% (0)
Texas:
6.8% (399,275)
Number of households with income $40k - 50k:
Pinewood Estates:
2.1% (8)
State:
6.5% (383,417)
Number of households with income $50k - 60k:
Pinewood Estates:
0.0% (0)
State:
6.6% (388,535)
Number of households with income $60k - 75k:
Pinewood Estates:
13.6% (52)
Texas:
9.7% (566,295)
Number of households with income $75k - 100k:
Pinewood Estates:
9.9% (38)
State:
13.0% (760,276)
Number of households with income $100k - 125k:
Pinewood Estates:
19.3% (74)
State:
10.2% (597,596)
Number of households with income $125k - 150k:
Pinewood Estates:
8.6% (33)
State:
7.4% (436,830)
Number of households with income $150k - 200k:
Pinewood Estates:
35.2% (135)
State:
9.9% (583,067)
Number of households with income > $200k:
Pinewood Estates:
8.4% (32)
Texas:
13.5% (792,647)
Aggregate household income in Pinewood Estates in 2022: $58,956,753
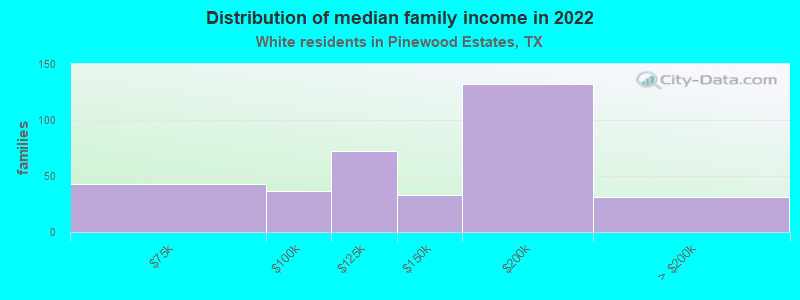
Median family income in Pinewood Estates in 2022:
Pinewood Estates:
$143,608
State:
$101,788
Number of families with income $60k - 75k:
Pinewood Estates:
12.4% (43)
State:
9.0% (346,106)
Number of families with income $75k - 100k:
Pinewood Estates:
10.5% (37)
State:
13.7% (527,363)
Number of families with income $100k - 125k:
Pinewood Estates:
20.7% (72)
State:
11.6% (448,411)
Number of families with income $125k - 150k:
Pinewood Estates:
9.5% (33)
State:
9.2% (355,798)
Number of families with income $150k - 200k:
Pinewood Estates:
37.9% (132)
State:
12.5% (480,185)
Number of families with income > $200k:
Pinewood Estates:
8.9% (31)
State:
17.6% (677,490)
Median non-family income in Pinewood Estates in 2022:
Pinewood Estates:
$50,172
Texas:
$50,587
Median per capita income in Pinewood Estates in 2022:
Pinewood Estates:
$49,460
State:
$47,740
Change in median per capita income between 2000 and 2022:
Pinewood Estates, Texas:
+70.8%
State:
+114.3%
Income statistics for Black or African American residents
Median per capita income in Pinewood Estates in 2022:
Pinewood Estates:
$28,825
State:
$30,490
Income statistics for Hispanic or Latino residents
Median per capita income in Pinewood Estates in 2022:
Pinewood Estates:
$25,325
State:
$24,862
Change in median per capita income between 2000 and 2022:
Pinewood Estates, Texas:
+27.8%
Texas:
+130.8%
Income statistics for Multirace residents
Median per capita income in Pinewood Estates in 2022:
Pinewood Estates:
$24,514
State:
$26,785
Discuss Pinewood Estates, Texas (TX) on our hugely popular Texas forum.