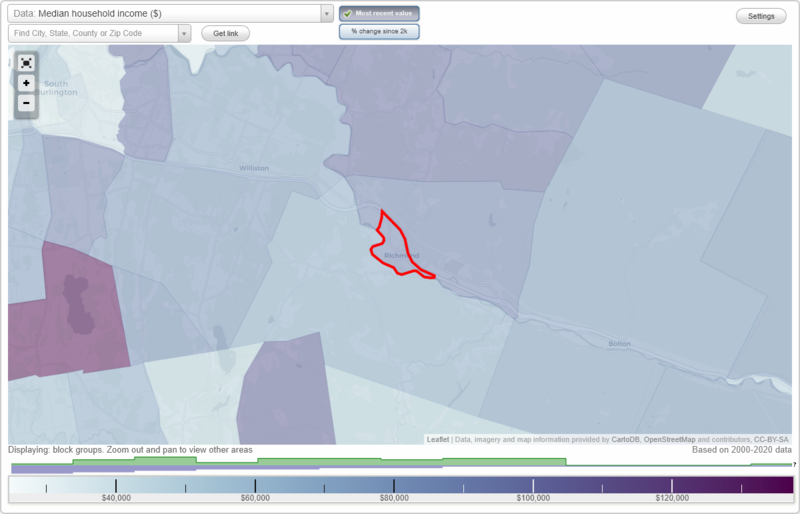
The median household income in Richmond, VT in 2022 was $106,133, which was 30.3% greater than the median annual income of $73,991 across the entire state of Vermont. Compared to the median income of $57,750 in 2000 this represents an increase of 45.6%. The per capita income in 2022 was $50,295, which means an increase of 48.9% compared to 2000 when it was $25,692.
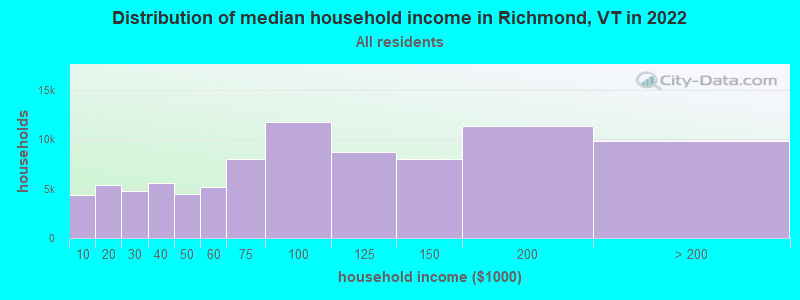
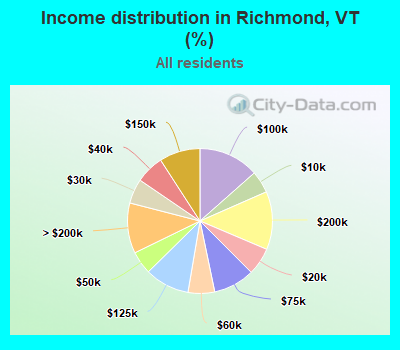
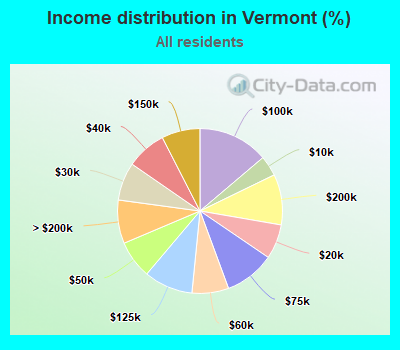
Income statistics for all residents
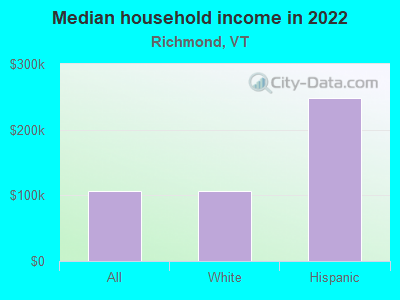
Median household income in Richmond, VT in 2022:
Richmond:
$106,134
State:
$73,991
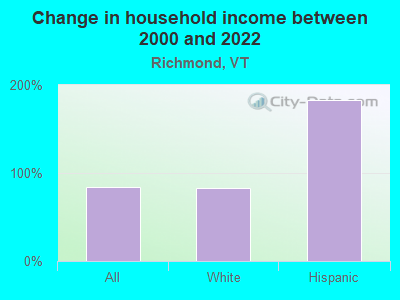
Change in median household income between 2000 and 2022:
Richmond, Vermont:
+83.8%
State:
+81.1%
Number of households with income < $10k:
Richmond:
5.0% (4,328)
State:
4.0% (11,050)
Number of households with income $10k - 20k:
Richmond:
6.1% (5,358)
Vermont:
6.8% (18,853)
Number of households with income $20k - 30k:
Richmond:
5.5% (4,807)
Vermont:
7.5% (20,673)
Number of households with income $30k - 40k:
Richmond:
6.4% (5,548)
State:
7.8% (21,750)
Number of households with income $40k - 50k:
Richmond:
5.1% (4,492)
State:
7.4% (20,642)
Number of households with income $50k - 60k:
Richmond:
5.9% (5,197)
State:
7.2% (19,901)
Number of households with income $60k - 75k:
Richmond:
9.2% (8,044)
State:
9.9% (27,351)
Number of households with income $75k - 100k:
Richmond:
13.5% (11,772)
State:
13.8% (38,275)
Number of households with income $100k - 125k:
Richmond:
10.0% (8,694)
Vermont:
9.6% (26,632)
Number of households with income $125k - 150k:
Richmond:
9.1% (7,972)
State:
7.5% (20,857)
Number of households with income $150k - 200k:
Richmond:
13.0% (11,319)
State:
9.9% (27,469)
Number of households with income > $200k:
Richmond:
11.2% (9,817)
State:
8.5% (23,637)
Aggregate household income in Richmond in 2022: $378,085,421
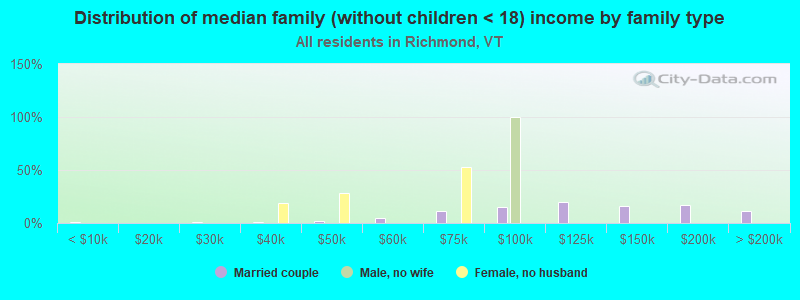
Median family income in Richmond in 2022:
Richmond:
$136,570
State:
$96,345
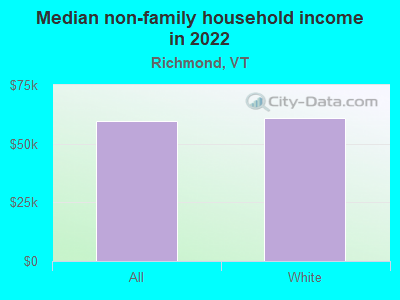
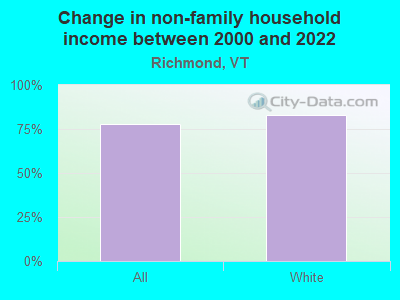
Median non-family income in Richmond in 2022:
Richmond:
$59,482
State:
$46,022
Change in median non-family income between 2000 and 2022:
Richmond, Vermont:
+77.9%
Vermont:
+87.4%
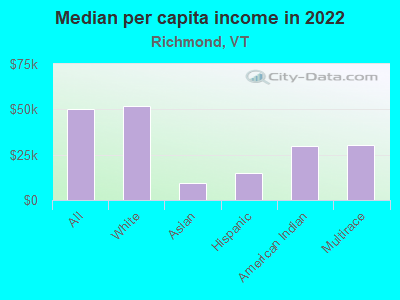
Median per capita income in Richmond in 2022:
Richmond:
$50,295
Vermont:
$42,251
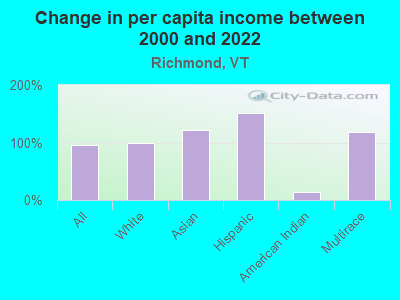
Change in median per capita income between 2000 and 2022:
Richmond, Vermont:
+95.8%
Vermont:
+104.9%
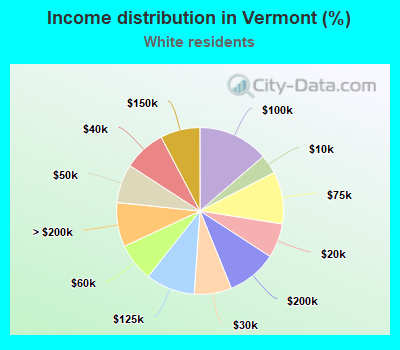
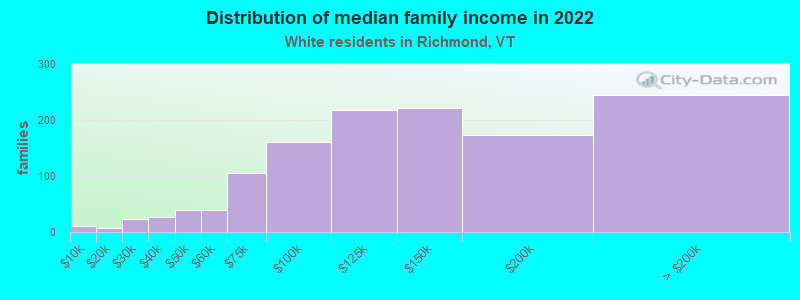
Income statistics for White residents
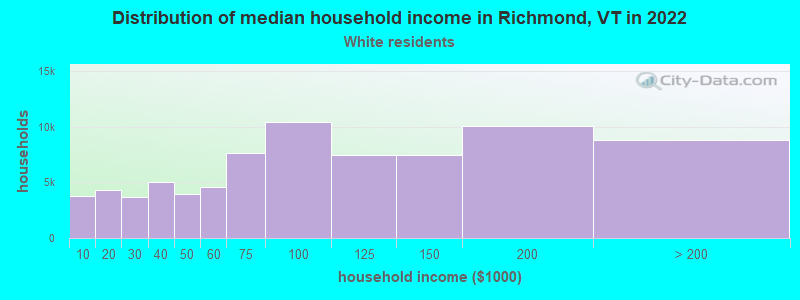
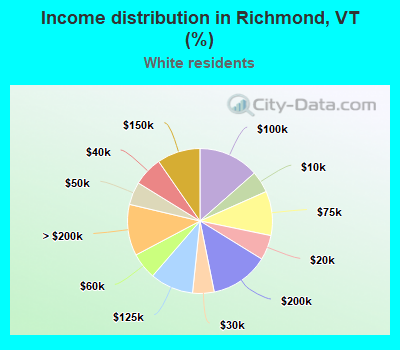
Median household income in Richmond, VT in 2022:
Richmond:
$106,258
Vermont:
$73,591
Change in median household income between 2000 and 2022:
Richmond, Vermont:
+82.8%
State:
+79.2%
Number of households with income < $10k:
Richmond:
4.8% (3,734)
Vermont:
3.7% (9,508)
Number of households with income $10k - 20k:
Richmond:
5.6% (4,297)
State:
6.7% (17,064)
Number of households with income $20k - 30k:
Richmond:
4.8% (3,711)
Vermont:
7.2% (18,552)
Number of households with income $30k - 40k:
Richmond:
6.5% (5,052)
State:
8.2% (20,886)
Number of households with income $40k - 50k:
Richmond:
5.1% (3,942)
State:
7.5% (19,216)
Number of households with income $50k - 60k:
Richmond:
5.9% (4,562)
Vermont:
7.4% (18,898)
Number of households with income $60k - 75k:
Richmond:
9.9% (7,645)
State:
10.1% (25,944)
Number of households with income $75k - 100k:
Richmond:
13.5% (10,436)
State:
13.7% (34,991)
Number of households with income $100k - 125k:
Richmond:
9.7% (7,473)
State:
9.5% (24,409)
Number of households with income $125k - 150k:
Richmond:
9.7% (7,455)
Vermont:
7.7% (19,710)
Number of households with income $150k - 200k:
Richmond:
13.1% (10,082)
State:
9.7% (24,802)
Number of households with income > $200k:
Richmond:
11.5% (8,850)
Vermont:
8.6% (21,983)
Aggregate household income in Richmond in 2022: $338,584,497
Median family income in Richmond in 2022:
Richmond:
$136,263
Vermont:
$96,147
Number of families with income < $10k:
Richmond:
0.8% (10)
Vermont:
1.8% (2,669)
Number of families with income $10k - 20k:
Richmond:
0.5% (7)
State:
3.1% (4,686)
Number of families with income $20k - 30k:
Richmond:
1.9% (23)
Vermont:
4.1% (6,266)
Number of families with income $30k - 40k:
Richmond:
2.0% (26)
Vermont:
6.1% (9,273)
Number of families with income $40k - 50k:
Richmond:
3.1% (39)
State:
6.4% (9,714)
Number of families with income $50k - 60k:
Richmond:
3.1% (39)
Vermont:
6.1% (9,310)
Number of families with income $60k - 75k:
Richmond:
8.3% (105)
State:
9.3% (14,175)
Number of families with income $75k - 100k:
Richmond:
12.7% (160)
State:
15.5% (23,673)
Number of families with income $100k - 125k:
Richmond:
17.2% (218)
State:
12.7% (19,323)
Number of families with income $125k - 150k:
Richmond:
17.5% (221)
State:
9.7% (14,805)
Number of families with income $150k - 200k:
Richmond:
13.7% (173)
Vermont:
13.1% (20,018)
Number of families with income > $200k:
Richmond:
19.2% (244)
Vermont:
12.1% (18,463)
Median non-family income in Richmond in 2022:
Richmond:
$61,094
State:
$45,952
Change in median non-family income between 2000 and 2022:
Richmond, Vermont:
+82.7%
State:
+86.1%
Median per capita income in Richmond in 2022:
Richmond:
$51,742
Vermont:
$43,031
Change in median per capita income between 2000 and 2022:
Richmond, Vermont:
+99.8%
Vermont:
+106.0%
Income statistics for Asian residents
Number of households with income < $10k:
Richmond:
5.3% (68,357)
State:
8.9% (278)
Number of households with income $10k - 20k:
Richmond:
4.8% (61,708)
State:
5.9% (184)
Number of households with income $20k - 30k:
Richmond:
4.7% (60,397)
State:
8.3% (258)
Number of households with income $30k - 40k:
Richmond:
4.7% (59,951)
State:
8.8% (273)
Number of households with income $40k - 50k:
Richmond:
4.6% (59,035)
Vermont:
9.7% (302)
Number of households with income $50k - 60k:
Richmond:
4.8% (61,273)
State:
3.4% (106)
Number of households with income $60k - 75k:
Richmond:
6.9% (87,873)
State:
6.5% (202)
Number of households with income $75k - 100k:
Richmond:
10.9% (139,205)
Vermont:
14.6% (455)
Number of households with income $100k - 125k:
Richmond:
10.0% (127,616)
State:
9.8% (305)
Number of households with income $125k - 150k:
Richmond:
7.8% (100,420)
State:
2.7% (85)
Number of households with income $150k - 200k:
Richmond:
11.8% (151,559)
Vermont:
11.8% (369)
Number of households with income > $200k:
Richmond:
23.7% (304,265)
State:
9.6% (299)
Median per capita income in Richmond in 2022:
Richmond:
$9,112
State:
$32,037
Change in median per capita income between 2000 and 2022:
Richmond, Vermont:
+121.3%
State:
+133.5%
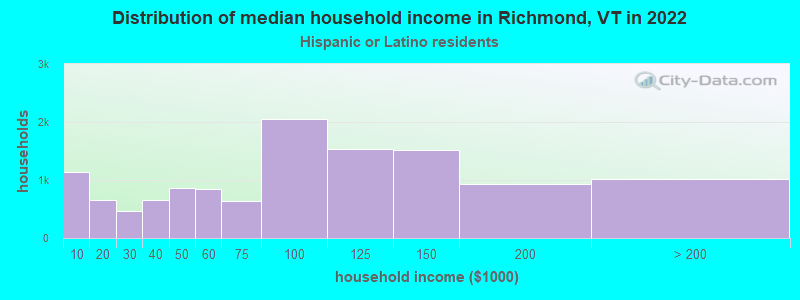
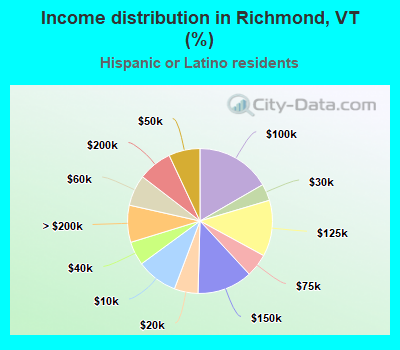
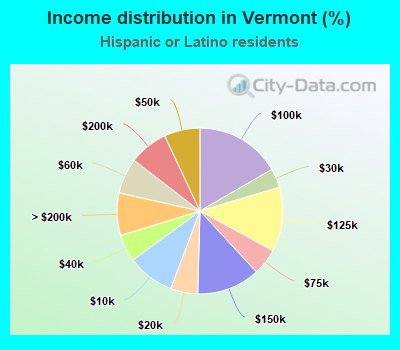
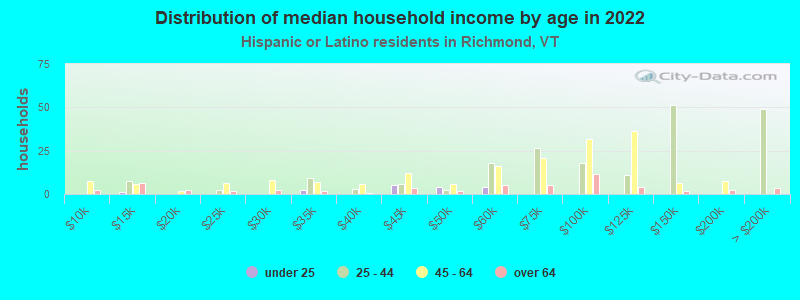
Income statistics for Hispanic or Latino residents
Median household income in Richmond, VT in 2022:
Richmond:
$247,795
State:
$90,490
Number of households with income < $10k:
Richmond:
9.2% (1,130)
State:
9.2% (500)
Number of households with income $10k - 20k:
Richmond:
5.3% (651)
Vermont:
5.3% (288)
Number of households with income $20k - 30k:
Richmond:
3.7% (459)
State:
3.7% (203)
Number of households with income $30k - 40k:
Richmond:
5.3% (650)
State:
5.3% (288)
Number of households with income $40k - 50k:
Richmond:
7.0% (856)
State:
7.0% (379)
Number of households with income $50k - 60k:
Richmond:
6.9% (850)
State:
6.9% (376)
Number of households with income $60k - 75k:
Richmond:
5.2% (637)
Vermont:
5.2% (282)
Number of households with income $75k - 100k:
Richmond:
16.7% (2,045)
State:
16.7% (905)
Number of households with income $100k - 125k:
Richmond:
12.5% (1,541)
State:
12.6% (682)
Number of households with income $125k - 150k:
Richmond:
12.3% (1,512)
Vermont:
12.3% (669)
Number of households with income $150k - 200k:
Richmond:
7.6% (931)
State:
7.6% (412)
Number of households with income > $200k:
Richmond:
8.3% (1,017)
Vermont:
8.3% (450)
Aggregate household income in Richmond in 2022: $7,963,611
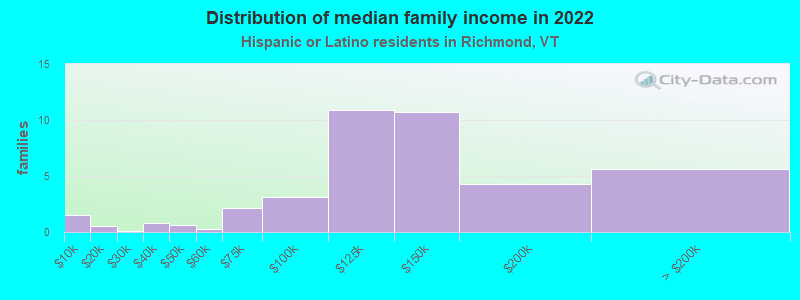
Median family income in Richmond in 2022:
Richmond:
$204,177
State:
$116,955
Number of families with income < $10k:
Richmond:
3.7% (2)
State:
12.9% (469)
Number of families with income $10k - 20k:
Richmond:
1.4% (1)
Vermont:
6.0% (219)
Number of families with income $20k - 30k:
Richmond:
0.2% (0)
Vermont:
0.7% (26)
Number of families with income $30k - 40k:
Richmond:
2.1% (1)
State:
4.8% (176)
Number of families with income $40k - 50k:
Richmond:
1.6% (1)
State:
3.3% (119)
Number of families with income $50k - 60k:
Richmond:
0.6% (0)
State:
0.8% (29)
Number of families with income $60k - 75k:
Richmond:
5.2% (2)
Vermont:
6.5% (236)
Number of families with income $75k - 100k:
Richmond:
7.7% (3)
State:
9.0% (326)
Number of families with income $100k - 125k:
Richmond:
26.8% (11)
State:
16.6% (604)
Number of families with income $125k - 150k:
Richmond:
26.3% (11)
State:
15.7% (572)
Number of families with income $150k - 200k:
Richmond:
10.6% (4)
Vermont:
11.3% (412)
Number of families with income > $200k:
Richmond:
13.9% (6)
State:
12.4% (450)
Median per capita income in Richmond in 2022:
Richmond:
$15,090
State:
$36,311
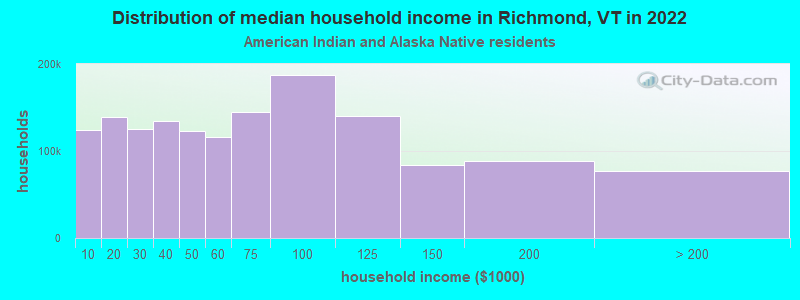
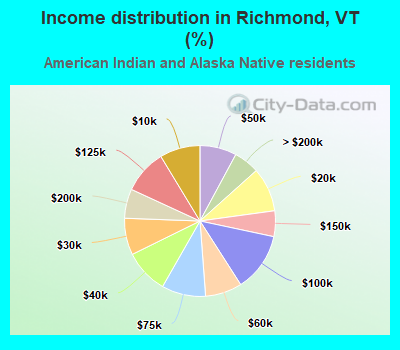
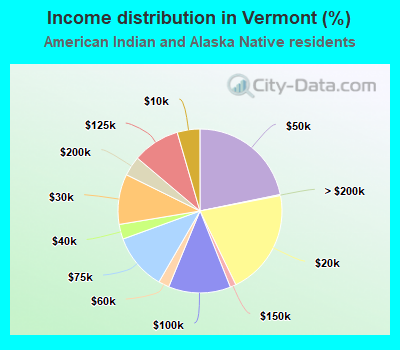
Income statistics for American Indian and Alaska Native residents
Number of households with income < $10k:
Richmond:
8.7% (11)
Vermont:
4.5% (23)
Number of households with income $10k - 20k:
Richmond:
9.4% (12)
State:
20.8% (107)
Number of households with income $20k - 30k:
Richmond:
7.9% (10)
State:
9.9% (51)
Number of households with income $30k - 40k:
Richmond:
9.4% (12)
State:
2.9% (15)
Number of households with income $40k - 50k:
Richmond:
7.9% (10)
State:
21.8% (112)
Number of households with income $50k - 60k:
Richmond:
7.9% (10)
Vermont:
2.1% (11)
Number of households with income $60k - 75k:
Richmond:
9.4% (12)
State:
11.1% (57)
Number of households with income $75k - 100k:
Richmond:
12.6% (16)
Vermont:
12.3% (63)
Number of households with income $100k - 125k:
Richmond:
9.4% (12)
State:
9.3% (48)
Number of households with income $125k - 150k:
Richmond:
5.5% (7)
State:
1.2% (6)
Number of households with income $150k - 200k:
Richmond:
6.3% (8)
Vermont:
3.9% (20)
Number of households with income > $200k:
Richmond:
5.5% (7)
State:
0.2% (1)
Aggregate household income in Richmond in 2022: $165,413
Median per capita income in Richmond in 2022:
Richmond:
$29,590
Vermont:
$19,747
Change in median per capita income between 2000 and 2022:
Richmond, Vermont:
+13.8%
State:
+41.4%
Income statistics for Multirace residents
Number of households with income < $10k:
Richmond:
4.5% (682)
Vermont:
4.5% (613)
Number of households with income $10k - 20k:
Richmond:
7.3% (1,099)
State:
7.3% (988)
Number of households with income $20k - 30k:
Richmond:
13.0% (1,970)
Vermont:
13.0% (1,770)
Number of households with income $30k - 40k:
Richmond:
2.8% (429)
State:
2.8% (386)
Number of households with income $40k - 50k:
Richmond:
6.7% (1,006)
State:
6.7% (904)
Number of households with income $50k - 60k:
Richmond:
5.9% (887)
State:
5.9% (797)
Number of households with income $60k - 75k:
Richmond:
5.9% (895)
State:
5.9% (804)
Number of households with income $75k - 100k:
Richmond:
17.5% (2,644)
Vermont:
17.5% (2,376)
Number of households with income $100k - 125k:
Richmond:
10.5% (1,588)
State:
10.5% (1,427)
Number of households with income $125k - 150k:
Richmond:
6.5% (976)
Vermont:
6.5% (877)
Number of households with income $150k - 200k:
Richmond:
10.8% (1,633)
State:
10.8% (1,467)
Number of households with income > $200k:
Richmond:
8.7% (1,313)
Vermont:
8.7% (1,180)
Median per capita income in Richmond in 2022:
Richmond:
$30,205
State:
$34,567
Change in median per capita income between 2000 and 2022:
Richmond, Vermont:
+118.1%
State:
+177.8%
Discuss Richmond, Vermont (VT) on our hugely popular Vermont forum.