Rose Valley, Washington (WA) income map, earnings map, and wages data
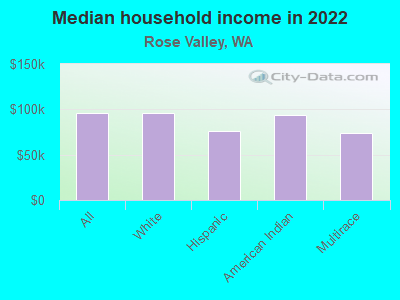
The median household income in Rose Valley, WA in 2022 was $95,605, which was 4.5% greater than the median annual income of $91,306 across the entire state of Washington. Compared to the median income of $52,804 in 2000 this represents an increase of 44.8%. The per capita income in 2022 was $39,973, which means an increase of 46.8% compared to 2000 when it was $21,264.
Income statistics for all residents
Median household income in Rose Valley, WA in 2022:| Rose Valley: | $95,605 |
| State: | $91,306 |
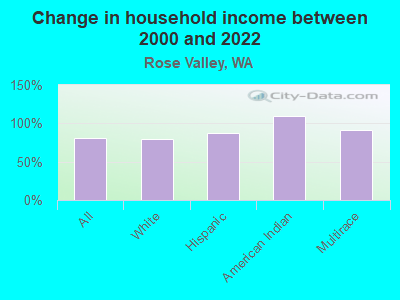
Change in median household income between 2000 and 2022:| Rose Valley, Washington: | +81.1% |
| Washington: | +99.5% |
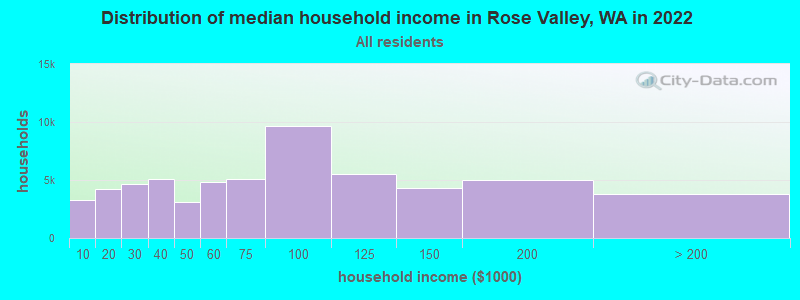
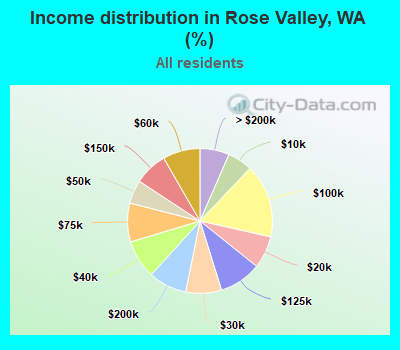
Number of households with income < $10k:| Rose Valley: | 5.5% (3,240) |
| State: | 4.5% (139,331) |
Number of households with income $10k - 20k:| Rose Valley: | 7.2% (4,207) |
| Washington: | 5.0% (154,508) |
Number of households with income $20k - 30k:| Rose Valley: | 8.0% (4,668) |
| Washington: | 5.4% (166,555) |
Number of households with income $30k - 40k:| Rose Valley: | 8.6% (5,044) |
| Washington: | 5.5% (170,324) |
Number of households with income $40k - 50k:| Rose Valley: | 5.3% (3,074) |
| State: | 6.0% (183,941) |
Number of households with income $50k - 60k:| Rose Valley: | 8.3% (4,860) |
| Washington: | 6.1% (187,395) |
Number of households with income $60k - 75k:| Rose Valley: | 8.7% (5,058) |
| Washington: | 8.7% (266,771) |
Number of households with income $75k - 100k:| Rose Valley: | 16.5% (9,620) |
| Washington: | 13.1% (404,672) |
Number of households with income $100k - 125k:| Rose Valley: | 9.5% (5,524) |
| Washington: | 11.0% (337,911) |
Number of households with income $125k - 150k:| Rose Valley: | 7.4% (4,340) |
| State: | 8.0% (244,934) |
Number of households with income $150k - 200k:| Rose Valley: | 8.5% (4,982) |
| State: | 10.5% (323,812) |
Number of households with income > $200k:| Rose Valley: | 6.6% (3,829) |
| Washington: | 16.2% (499,799) |
Aggregate household income in Rose Valley in 2022: $225,168,521
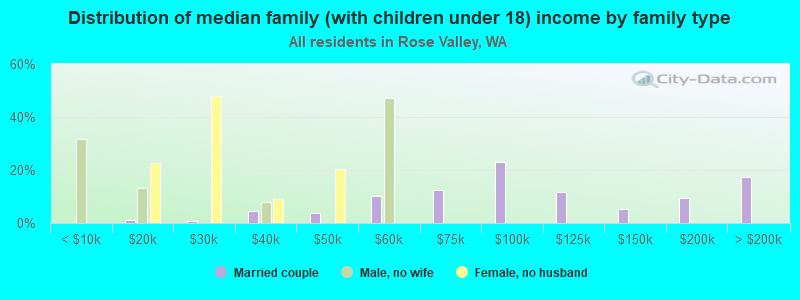
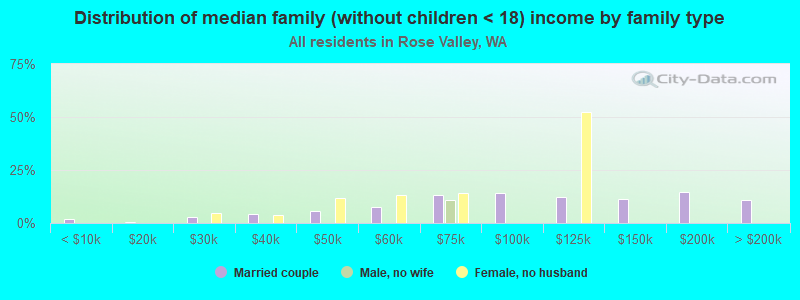
Median family income in Rose Valley in 2022:| Rose Valley: | $98,763 |
| State: | $109,192 |
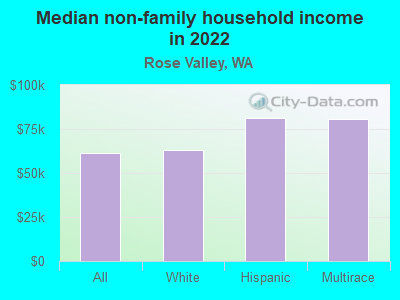
Median non-family income in Rose Valley in 2022:| Rose Valley: | $61,423 |
| State: | $57,299 |
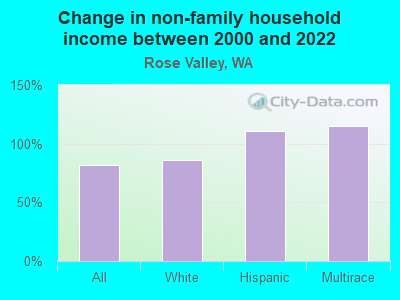
Change in median non-family income between 2000 and 2022:| Rose Valley, Washington: | +82.0% |
| State: | +94.9% |
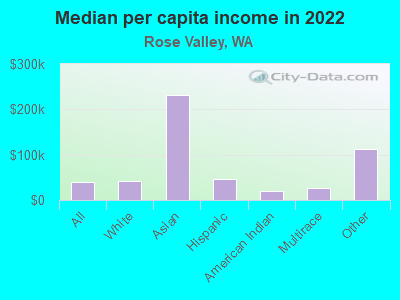
Median per capita income in Rose Valley in 2022:| Rose Valley: | $39,974 |
| Washington: | $50,764 |
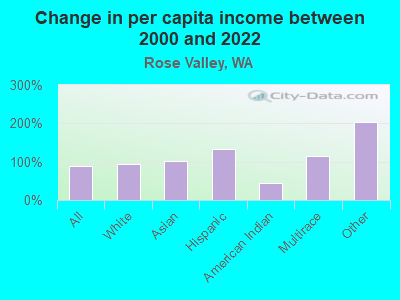
Change in median per capita income between 2000 and 2022:| Rose Valley, Washington: | +88.0% |
| State: | +121.0% |
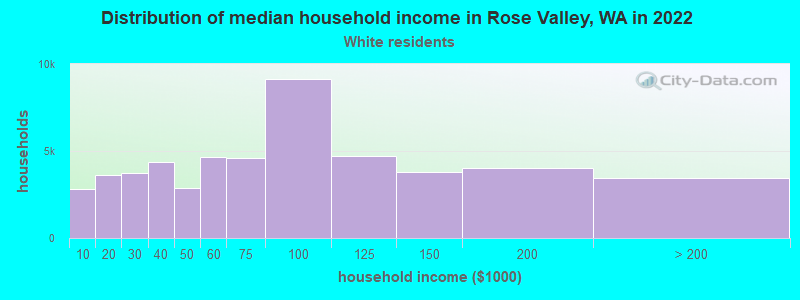
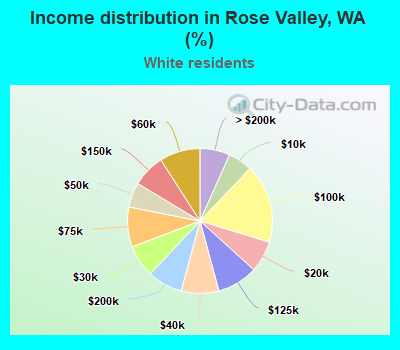
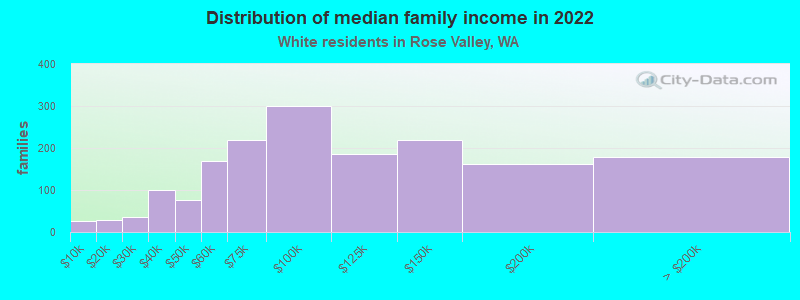
Income statistics for White residents
Median household income in Rose Valley, WA in 2022:| Rose Valley: | $95,774 |
| Washington: | $91,916 |
Change in median household income between 2000 and 2022:| Rose Valley, Washington: | +78.9% |
| State: | +95.4% |
Number of households with income < $10k:| Rose Valley: | 5.4% (2,794) |
| State: | 4.3% (95,850) |
Number of households with income $10k - 20k:| Rose Valley: | 7.0% (3,612) |
| Washington: | 4.8% (106,421) |
Number of households with income $20k - 30k:| Rose Valley: | 7.2% (3,731) |
| State: | 5.5% (122,860) |
Number of households with income $30k - 40k:| Rose Valley: | 8.4% (4,341) |
| State: | 5.4% (119,627) |
Number of households with income $40k - 50k:| Rose Valley: | 5.5% (2,851) |
| State: | 5.9% (132,276) |
Number of households with income $50k - 60k:| Rose Valley: | 9.0% (4,680) |
| Washington: | 6.1% (136,212) |
Number of households with income $60k - 75k:| Rose Valley: | 8.9% (4,609) |
| State: | 8.8% (196,086) |
Number of households with income $75k - 100k:| Rose Valley: | 17.6% (9,127) |
| State: | 13.4% (299,192) |
Number of households with income $100k - 125k:| Rose Valley: | 9.1% (4,696) |
| Washington: | 11.3% (252,209) |
Number of households with income $125k - 150k:| Rose Valley: | 7.3% (3,786) |
| State: | 7.9% (175,962) |
Number of households with income $150k - 200k:| Rose Valley: | 7.8% (4,038) |
| State: | 10.7% (239,156) |
Number of households with income > $200k:| Rose Valley: | 6.7% (3,468) |
| State: | 16.1% (359,917) |
Aggregate household income in Rose Valley in 2022: $200,403,624
Median family income in Rose Valley in 2022:| Rose Valley: | $98,928 |
| State: | $112,511 |
Number of families with income < $10k:| Rose Valley: | 1.6% (27) |
| State: | 2.4% (33,676) |
Number of families with income $10k - 20k:| Rose Valley: | 1.7% (28) |
| State: | 2.0% (28,228) |
Number of families with income $20k - 30k:| Rose Valley: | 2.1% (35) |
| State: | 2.9% (39,288) |
Number of families with income $30k - 40k:| Rose Valley: | 6.0% (101) |
| Washington: | 3.6% (50,190) |
Number of families with income $40k - 50k:| Rose Valley: | 4.5% (77) |
| State: | 4.6% (63,009) |
Number of families with income $50k - 60k:| Rose Valley: | 9.9% (169) |
| State: | 5.0% (69,270) |
Number of families with income $60k - 75k:| Rose Valley: | 12.9% (219) |
| State: | 8.2% (112,369) |
Number of families with income $75k - 100k:| Rose Valley: | 17.6% (299) |
| Washington: | 14.1% (194,214) |
Number of families with income $100k - 125k:| Rose Valley: | 10.9% (185) |
| State: | 13.2% (182,184) |
Number of families with income $125k - 150k:| Rose Valley: | 12.9% (219) |
| State: | 9.5% (130,928) |
Number of families with income $150k - 200k:| Rose Valley: | 9.5% (161) |
| Washington: | 13.7% (188,621) |
Number of families with income > $200k:| Rose Valley: | 10.5% (179) |
| State: | 20.8% (285,982) |
Median non-family income in Rose Valley in 2022:| Rose Valley: | $62,792 |
| State: | $56,103 |
Change in median non-family income between 2000 and 2022:| Rose Valley, Washington: | +86.1% |
| Washington: | +87.7% |
Median per capita income in Rose Valley in 2022:| Rose Valley: | $41,541 |
| State: | $55,212 |
Change in median per capita income between 2000 and 2022:| Rose Valley, Washington: | +93.1% |
| State: | +123.8% |
Income statistics for Asian residents
Number of households with income < $10k:| Rose Valley: | 4.9% (40,060) |
| Washington: | 4.9% (14,099) |
Number of households with income $10k - 20k:| Rose Valley: | 3.5% (28,055) |
| State: | 3.5% (9,873) |
Number of households with income $20k - 30k:| Rose Valley: | 2.9% (23,731) |
| State: | 2.9% (8,352) |
Number of households with income $30k - 40k:| Rose Valley: | 4.0% (32,435) |
| State: | 4.0% (11,415) |
Number of households with income $40k - 50k:| Rose Valley: | 4.0% (32,452) |
| Washington: | 4.0% (11,421) |
Number of households with income $50k - 60k:| Rose Valley: | 4.2% (34,382) |
| State: | 4.2% (12,100) |
Number of households with income $60k - 75k:| Rose Valley: | 6.3% (50,870) |
| State: | 6.3% (17,903) |
Number of households with income $75k - 100k:| Rose Valley: | 10.4% (84,286) |
| State: | 10.4% (29,663) |
Number of households with income $100k - 125k:| Rose Valley: | 9.4% (76,262) |
| State: | 9.4% (26,839) |
Number of households with income $125k - 150k:| Rose Valley: | 8.5% (68,763) |
| Washington: | 8.5% (24,200) |
Number of households with income $150k - 200k:| Rose Valley: | 12.6% (102,229) |
| Washington: | 12.6% (35,976) |
Number of households with income > $200k:| Rose Valley: | 29.2% (236,155) |
| Washington: | 29.2% (83,109) |
Median per capita income in Rose Valley in 2022:| Rose Valley: | $232,583 |
| Washington: | $67,666 |
Change in median per capita income between 2000 and 2022:| Rose Valley, Washington: | +103.2% |
| State: | +236.0% |
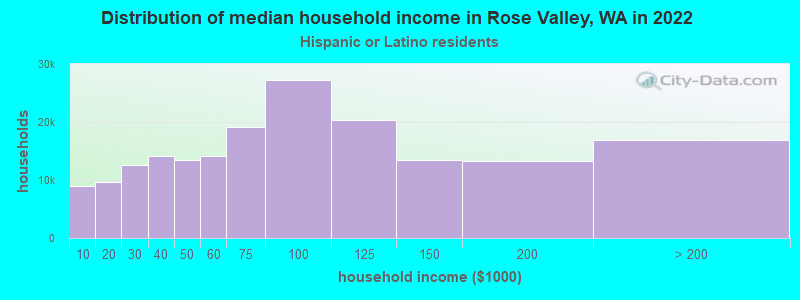
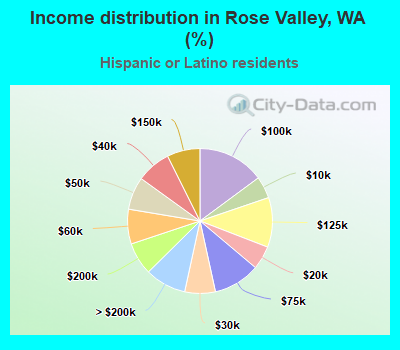
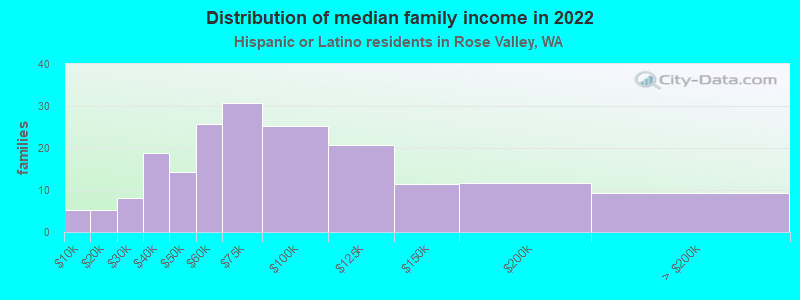
Income statistics for Hispanic or Latino residents
Median household income in Rose Valley, WA in 2022:| Rose Valley: | $76,615 |
| State: | $74,770 |
Change in median household income between 2000 and 2022:| Rose Valley, Washington: | +86.9% |
| State: | +128.3% |
Number of households with income < $10k:| Rose Valley: | 4.9% (8,984) |
| Washington: | 4.9% (14,456) |
Number of households with income $10k - 20k:| Rose Valley: | 5.3% (9,672) |
| State: | 5.3% (15,449) |
Number of households with income $20k - 30k:| Rose Valley: | 6.8% (12,514) |
| Washington: | 6.8% (20,016) |
Number of households with income $30k - 40k:| Rose Valley: | 7.7% (14,108) |
| State: | 7.7% (22,548) |
Number of households with income $40k - 50k:| Rose Valley: | 7.3% (13,452) |
| State: | 7.3% (21,450) |
Number of households with income $50k - 60k:| Rose Valley: | 7.7% (14,207) |
| State: | 7.7% (22,744) |
Number of households with income $60k - 75k:| Rose Valley: | 10.4% (19,155) |
| State: | 10.5% (30,737) |
Number of households with income $75k - 100k:| Rose Valley: | 14.9% (27,306) |
| State: | 14.9% (43,843) |
Number of households with income $100k - 125k:| Rose Valley: | 11.1% (20,367) |
| State: | 11.1% (32,554) |
Number of households with income $125k - 150k:| Rose Valley: | 7.4% (13,491) |
| Washington: | 7.4% (21,624) |
Number of households with income $150k - 200k:| Rose Valley: | 7.3% (13,343) |
| State: | 7.3% (21,360) |
Number of households with income > $200k:| Rose Valley: | 9.2% (16,892) |
| State: | 9.2% (27,055) |
Aggregate household income in Rose Valley in 2022: $6,232,569
Median family income in Rose Valley in 2022:| Rose Valley: | $113,081 |
| State: | $76,866 |
Number of families with income < $10k:| Rose Valley: | 2.9% (5) |
| Washington: | 4.4% (9,443) |
Number of families with income $10k - 20k:| Rose Valley: | 2.8% (5) |
| State: | 3.5% (7,524) |
Number of families with income $20k - 30k:| Rose Valley: | 4.4% (8) |
| State: | 5.6% (12,052) |
Number of families with income $30k - 40k:| Rose Valley: | 10.0% (19) |
| State: | 8.3% (17,803) |
Number of families with income $40k - 50k:| Rose Valley: | 7.7% (14) |
| State: | 7.7% (16,361) |
Number of families with income $50k - 60k:| Rose Valley: | 13.8% (26) |
| Washington: | 7.9% (16,852) |
Number of families with income $60k - 75k:| Rose Valley: | 16.5% (31) |
| State: | 11.4% (24,342) |
Number of families with income $75k - 100k:| Rose Valley: | 13.6% (25) |
| State: | 14.4% (30,698) |
Number of families with income $100k - 125k:| Rose Valley: | 11.0% (21) |
| Washington: | 11.4% (24,331) |
Number of families with income $125k - 150k:| Rose Valley: | 6.2% (12) |
| State: | 7.5% (16,099) |
Number of families with income $150k - 200k:| Rose Valley: | 6.2% (12) |
| Washington: | 8.2% (17,551) |
Number of families with income > $200k:| Rose Valley: | 4.9% (9) |
| State: | 9.7% (20,653) |
Median non-family income in Rose Valley in 2022:| Rose Valley: | $81,393 |
| State: | $54,173 |
Change in median non-family income between 2000 and 2022:| Rose Valley, Washington: | +111.2% |
| State: | +105.8% |
Median per capita income in Rose Valley in 2022:| Rose Valley: | $46,467 |
| State: | $28,252 |
Change in median per capita income between 2000 and 2022:| Rose Valley, Washington: | +133.3% |
| Washington: | +150.2% |
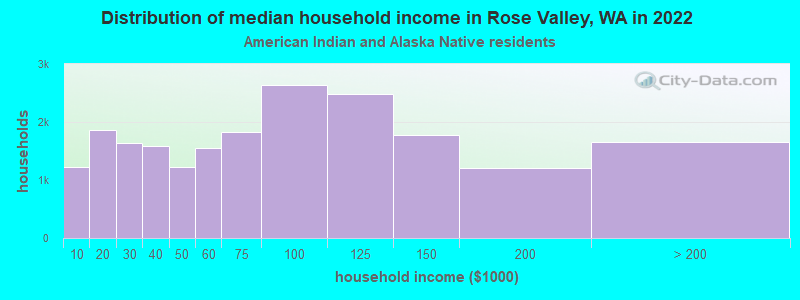
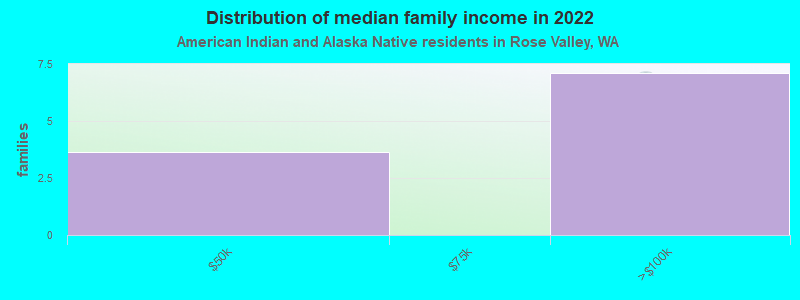
Income statistics for American Indian and Alaska Native residents
Median household income in Rose Valley, WA in 2022:| Rose Valley: | $93,401 |
| State: | $71,255 |
Change in median household income between 2000 and 2022:| Rose Valley, Washington: | +108.5% |
| State: | +118.1% |
Number of households with income < $10k:| Rose Valley: | 5.9% (1,217) |
| Washington: | 5.9% (1,768) |
Number of households with income $10k - 20k:| Rose Valley: | 9.0% (1,858) |
| State: | 8.9% (2,694) |
Number of households with income $20k - 30k:| Rose Valley: | 8.0% (1,644) |
| Washington: | 8.0% (2,412) |
Number of households with income $30k - 40k:| Rose Valley: | 7.7% (1,593) |
| Washington: | 7.7% (2,327) |
Number of households with income $40k - 50k:| Rose Valley: | 5.9% (1,217) |
| Washington: | 5.8% (1,755) |
Number of households with income $50k - 60k:| Rose Valley: | 7.5% (1,548) |
| Washington: | 7.5% (2,259) |
Number of households with income $60k - 75k:| Rose Valley: | 8.8% (1,826) |
| State: | 8.8% (2,669) |
Number of households with income $75k - 100k:| Rose Valley: | 12.7% (2,632) |
| Washington: | 12.8% (3,861) |
Number of households with income $100k - 125k:| Rose Valley: | 12.0% (2,484) |
| State: | 12.0% (3,618) |
Number of households with income $125k - 150k:| Rose Valley: | 8.6% (1,774) |
| State: | 8.6% (2,580) |
Number of households with income $150k - 200k:| Rose Valley: | 5.9% (1,213) |
| State: | 5.9% (1,774) |
Number of households with income > $200k:| Rose Valley: | 8.0% (1,661) |
| Washington: | 8.1% (2,447) |
Aggregate household income in Rose Valley in 2022: $1,440,260
Median family income in Rose Valley in 2022:| Rose Valley: | $145,857 |
| Washington: | $79,010 |
Median per capita income in Rose Valley in 2022:| Rose Valley: | $20,790 |
| Washington: | $27,053 |
Change in median per capita income between 2000 and 2022:| Rose Valley, Washington: | +44.6% |
| State: | +98.6% |
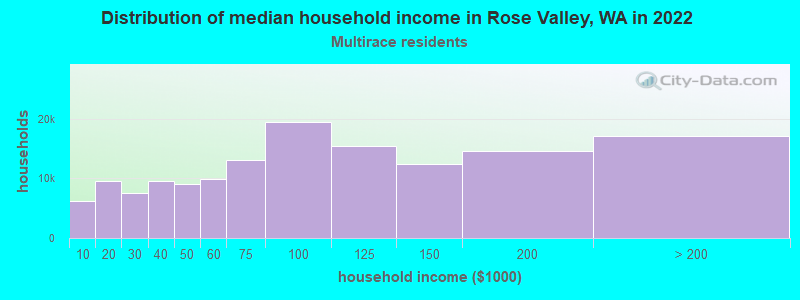
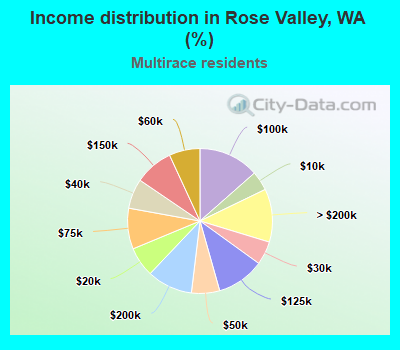
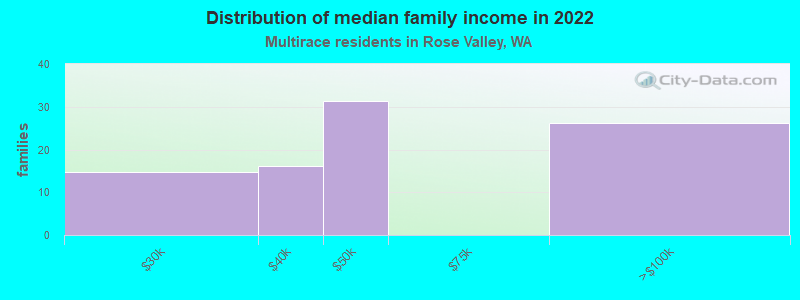
Income statistics for Multirace residents
Median household income in Rose Valley, WA in 2022:| Rose Valley: | $73,880 |
| State: | $84,303 |
Change in median household income between 2000 and 2022:| Rose Valley, Washington: | +90.7% |
| State: | +125.7% |
Number of households with income < $10k:| Rose Valley: | 4.3% (6,246) |
| Washington: | 4.3% (12,040) |
Number of households with income $10k - 20k:| Rose Valley: | 6.6% (9,565) |
| State: | 6.6% (18,437) |
Number of households with income $20k - 30k:| Rose Valley: | 5.2% (7,549) |
| Washington: | 5.2% (14,559) |
Number of households with income $30k - 40k:| Rose Valley: | 6.7% (9,592) |
| State: | 6.7% (18,491) |
Number of households with income $40k - 50k:| Rose Valley: | 6.3% (9,059) |
| Washington: | 6.3% (17,459) |
Number of households with income $50k - 60k:| Rose Valley: | 6.9% (9,897) |
| State: | 6.9% (19,086) |
Number of households with income $60k - 75k:| Rose Valley: | 9.1% (13,131) |
| State: | 9.1% (25,310) |
Number of households with income $75k - 100k:| Rose Valley: | 13.5% (19,446) |
| State: | 13.5% (37,493) |
Number of households with income $100k - 125k:| Rose Valley: | 10.7% (15,363) |
| State: | 10.7% (29,626) |
Number of households with income $125k - 150k:| Rose Valley: | 8.6% (12,396) |
| State: | 8.6% (23,899) |
Number of households with income $150k - 200k:| Rose Valley: | 10.2% (14,641) |
| State: | 10.2% (28,214) |
Number of households with income > $200k:| Rose Valley: | 11.9% (17,088) |
| Washington: | 11.9% (32,947) |
Aggregate household income in Rose Valley in 2022: $26,613,671
Median family income in Rose Valley in 2022:| Rose Valley: | $71,571 |
| Washington: | $95,629 |
Number of families with income $20k - 30k:| Rose Valley: | 16.7% (15) |
| State: | 4.4% (7,775) |
Number of families with income $30k - 40k:| Rose Valley: | 18.3% (16) |
| State: | 5.8% (10,186) |
Number of families with income $40k - 50k:| Rose Valley: | 35.4% (31) |
| State: | 5.9% (10,412) |
Number of families with income $75k - 100k:| Rose Valley: | 29.6% (26) |
| State: | 13.6% (23,984) |
Median non-family income in Rose Valley in 2022:| Rose Valley: | $80,553 |
| State: | $56,573 |
Change in median non-family income between 2000 and 2022:| Rose Valley, Washington: | +114.8% |
| State: | +115.0% |
Median per capita income in Rose Valley in 2022:| Rose Valley: | $25,675 |
| State: | $32,496 |
Change in median per capita income between 2000 and 2022:| Rose Valley, Washington: | +116.3% |
| Washington: | +156.8% |
Income statistics for other residents
Number of households with income < $10k:| Rose Valley: | 4.8% (1) |
| State: | 5.3% (6,540) |
Number of households with income $10k - 20k:| Rose Valley: | 9.5% (2) |
| Washington: | 6.0% (7,385) |
Number of households with income $20k - 30k:| Rose Valley: | 9.5% (2) |
| State: | 7.5% (9,289) |
Number of households with income $30k - 40k:| Rose Valley: | 9.5% (2) |
| Washington: | 8.9% (11,015) |
Number of households with income $40k - 50k:| Rose Valley: | 9.5% (2) |
| State: | 7.6% (9,399) |
Number of households with income $50k - 60k:| Rose Valley: | 9.5% (2) |
| State: | 7.2% (8,867) |
Number of households with income $60k - 75k:| Rose Valley: | 9.5% (2) |
| Washington: | 10.5% (13,032) |
Number of households with income $75k - 100k:| Rose Valley: | 14.3% (3) |
| State: | 14.6% (18,007) |
Number of households with income $100k - 125k:| Rose Valley: | 9.5% (2) |
| Washington: | 12.2% (15,128) |
Number of households with income $125k - 150k:| Rose Valley: | 4.8% (1) |
| Washington: | 5.6% (6,950) |
Number of households with income $150k - 200k:| Rose Valley: | 4.8% (1) |
| Washington: | 7.1% (8,749) |
Number of households with income > $200k:| Rose Valley: | 4.8% (1) |
| State: | 7.5% (9,208) |
Aggregate household income in Rose Valley in 2022: $2,071,150
Median family income in Rose Valley in 2022:| Rose Valley: | $136,476 |
| State: | $72,588 |
Number of families with income $60k - 75k:| Rose Valley: | 100.0% (16) |
| State: | 10.3% (9,864) |
Median per capita income in Rose Valley in 2022:| Rose Valley: | $113,075 |
| State: | $27,542 |