The median household income in Rosenberg, TX in 2022 was $63,174, which was 14.4% less than the median annual income of $72,284 across the entire state of Texas. Compared to the median income of $35,510 in 2000 this represents an increase of 43.8%. The per capita income in 2022 was $26,036, which means an increase of 43.1% compared to 2000 when it was $14,814.
Whole page based on the data from 2000 / 2022 when the population of Rosenberg, Texas was 24,043 / 41,351
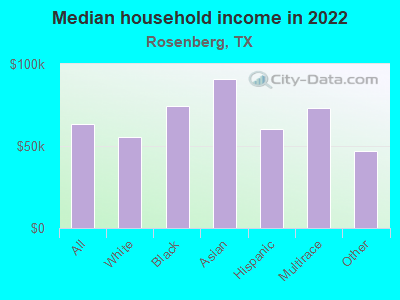
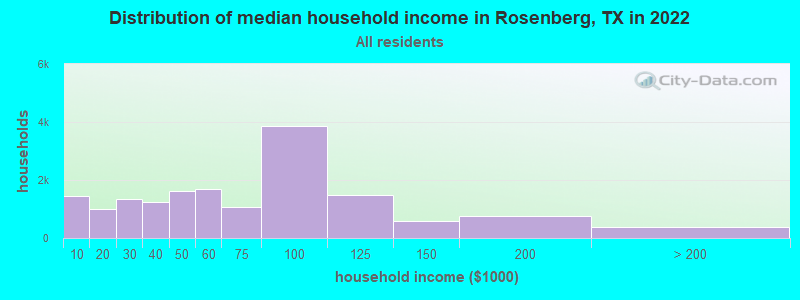
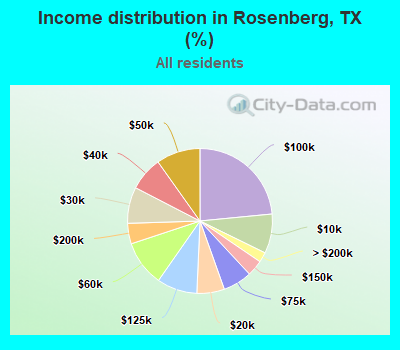
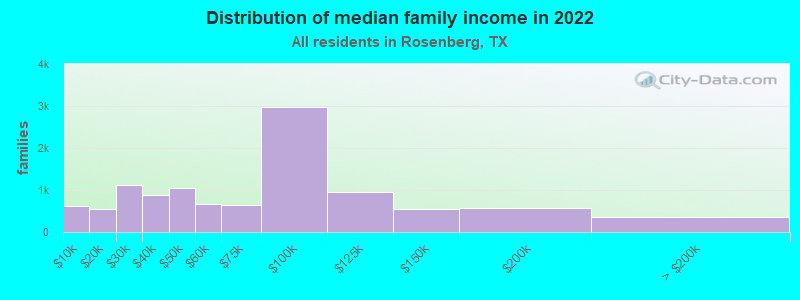
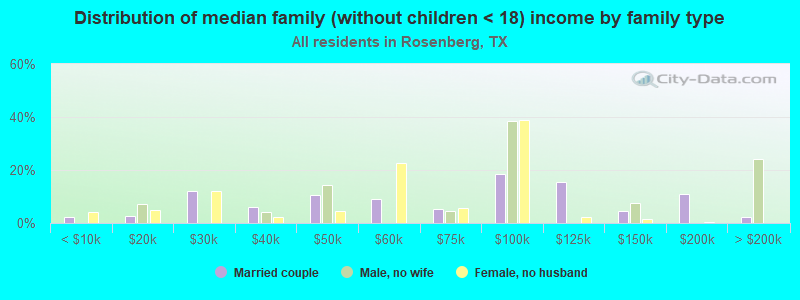
Income statistics for all residents
Median household income in Rosenberg, TX in 2022:
Rosenberg:
$63,174
State:
$72,284
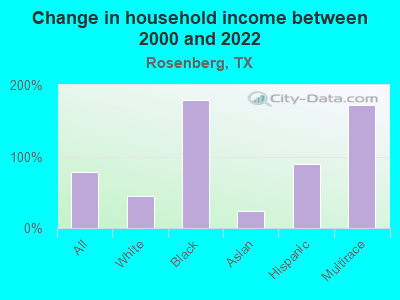
Change in median household income between 2000 and 2022:
Rosenberg, Texas:
+77.9%
State:
+81.0%
Number of households with income < $10k:
Rosenberg:
8.8% (1,450)
Texas:
5.5% (611,011)
Number of households with income $10k - 20k:
Rosenberg:
6.2% (1,016)
State:
6.7% (743,157)
Number of households with income $20k - 30k:
Rosenberg:
8.1% (1,339)
State:
7.2% (803,381)
Number of households with income $30k - 40k:
Rosenberg:
7.6% (1,249)
Texas:
7.8% (866,080)
Number of households with income $40k - 50k:
Rosenberg:
9.8% (1,624)
State:
7.3% (810,440)
Number of households with income $50k - 60k:
Rosenberg:
10.2% (1,684)
Texas:
7.2% (799,783)
Number of households with income $60k - 75k:
Rosenberg:
6.5% (1,069)
State:
9.9% (1,095,384)
Number of households with income $75k - 100k:
Rosenberg:
23.5% (3,877)
Texas:
12.8% (1,419,057)
Number of households with income $100k - 125k:
Rosenberg:
9.0% (1,487)
Texas:
9.5% (1,054,577)
Number of households with income $125k - 150k:
Rosenberg:
3.6% (592)
State:
6.7% (741,518)
Number of households with income $150k - 200k:
Rosenberg:
4.6% (758)
Texas:
8.7% (961,776)
Number of households with income > $200k:
Rosenberg:
2.2% (371)
State:
10.7% (1,181,544)
Aggregate household income in Rosenberg in 2022: $1,068,265,246
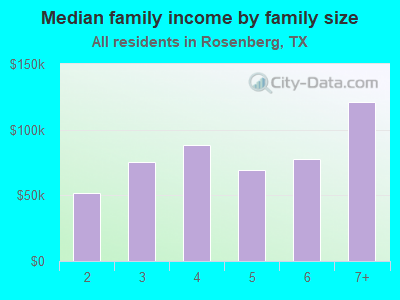
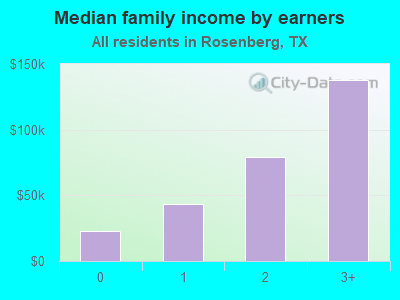
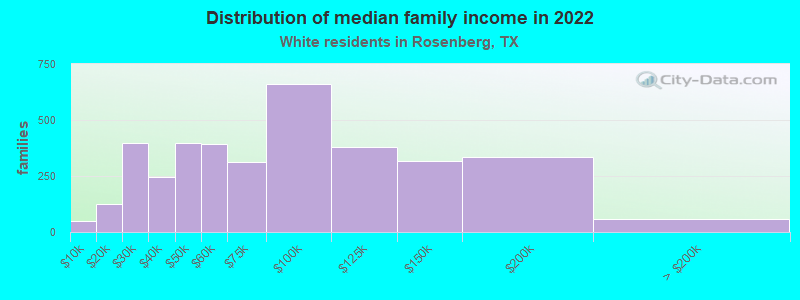
Median family income in Rosenberg in 2022:
Rosenberg:
$73,649
State:
$86,267
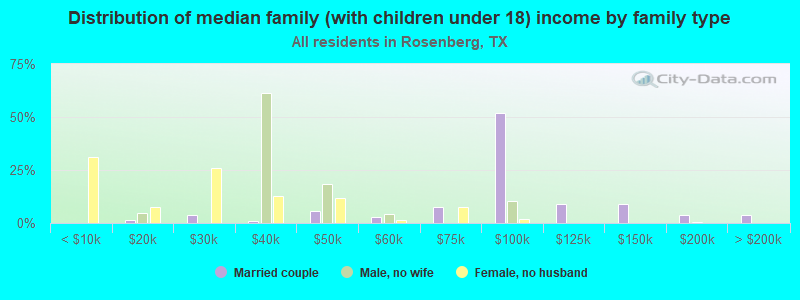
Number of families with income < $10k:
Rosenberg:
5.6% (615)
State:
4.0% (297,884)
Number of families with income $10k - 20k:
Rosenberg:
5.0% (549)
State:
4.3% (324,514)
Number of families with income $20k - 30k:
Rosenberg:
10.3% (1,118)
State:
5.8% (430,949)
Number of families with income $30k - 40k:
Rosenberg:
8.0% (873)
Texas:
6.6% (493,535)
Number of families with income $40k - 50k:
Rosenberg:
9.6% (1,046)
Texas:
6.7% (499,663)
Number of families with income $50k - 60k:
Rosenberg:
6.0% (657)
State:
6.6% (492,203)
Number of families with income $60k - 75k:
Rosenberg:
6.0% (649)
State:
9.5% (710,229)
Number of families with income $75k - 100k:
Rosenberg:
27.4% (2,984)
Texas:
13.6% (1,015,480)
Number of families with income $100k - 125k:
Rosenberg:
8.7% (943)
State:
10.7% (797,961)
Number of families with income $125k - 150k:
Rosenberg:
4.9% (536)
Texas:
8.1% (602,985)
Number of families with income $150k - 200k:
Rosenberg:
5.2% (570)
Texas:
10.7% (804,459)
Number of families with income > $200k:
Rosenberg:
3.2% (351)
Texas:
13.5% (1,013,514)
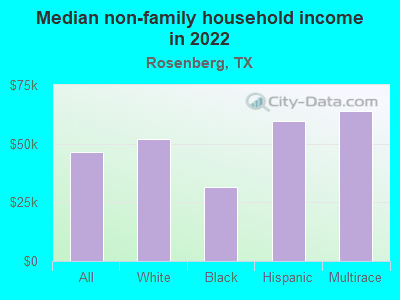
Median non-family income in Rosenberg in 2022:
Rosenberg:
$46,451
State:
$45,999
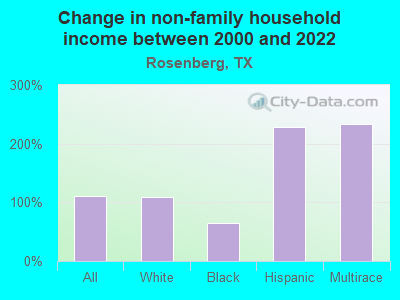
Change in median non-family income between 2000 and 2022:
Rosenberg, Texas:
+109.8%
State:
+79.5%
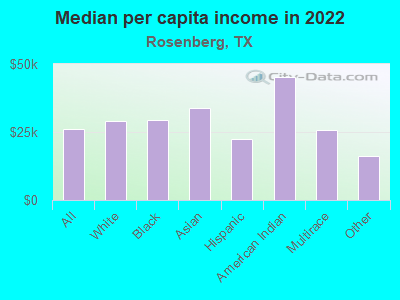
Median per capita income in Rosenberg in 2022:
Rosenberg:
$26,037
Texas:
$38,123
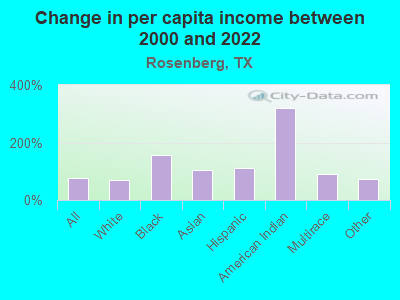
Change in median per capita income between 2000 and 2022:
Rosenberg, Texas:
+75.8%
Texas:
+94.3%
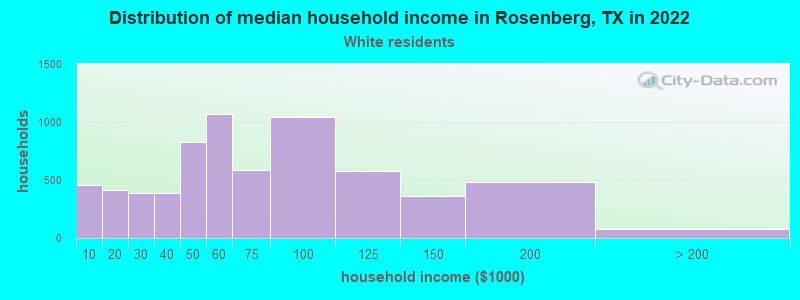
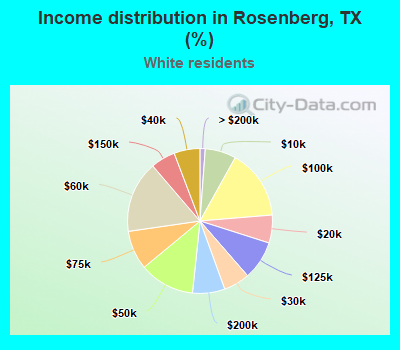
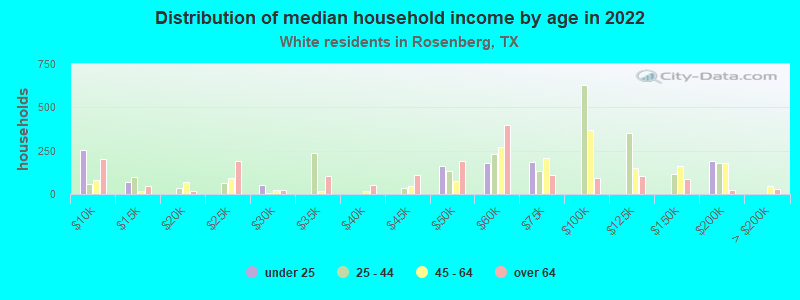
Income statistics for White residents
Median household income in Rosenberg, TX in 2022:
Rosenberg:
$55,614
Texas:
$82,032
Change in median household income between 2000 and 2022:
Rosenberg, Texas:
+44.8%
State:
+91.0%
Number of households with income < $10k:
Rosenberg:
6.9% (461)
Texas:
4.7% (273,716)
Number of households with income $10k - 20k:
Rosenberg:
6.2% (415)
State:
5.5% (322,702)
Number of households with income $20k - 30k:
Rosenberg:
5.9% (392)
State:
6.2% (363,947)
Number of households with income $30k - 40k:
Rosenberg:
5.8% (387)
State:
6.8% (399,275)
Number of households with income $40k - 50k:
Rosenberg:
12.3% (824)
Texas:
6.5% (383,417)
Number of households with income $50k - 60k:
Rosenberg:
16.0% (1,070)
State:
6.6% (388,535)
Number of households with income $60k - 75k:
Rosenberg:
8.7% (583)
State:
9.7% (566,295)
Number of households with income $75k - 100k:
Rosenberg:
15.6% (1,044)
State:
13.0% (760,276)
Number of households with income $100k - 125k:
Rosenberg:
8.7% (581)
State:
10.2% (597,596)
Number of households with income $125k - 150k:
Rosenberg:
5.5% (366)
State:
7.4% (436,830)
Number of households with income $150k - 200k:
Rosenberg:
7.2% (481)
State:
9.9% (583,067)
Number of households with income > $200k:
Rosenberg:
1.2% (79)
State:
13.5% (792,647)
Aggregate household income in Rosenberg in 2022: $449,369,500
Median family income in Rosenberg in 2022:
Rosenberg:
$65,540
Texas:
$101,788
Number of families with income < $10k:
Rosenberg:
1.3% (48)
State:
2.8% (108,142)
Number of families with income $10k - 20k:
Rosenberg:
3.4% (124)
State:
2.9% (113,421)
Number of families with income $20k - 30k:
Rosenberg:
10.8% (397)
Texas:
4.1% (157,688)
Number of families with income $30k - 40k:
Rosenberg:
6.7% (244)
State:
5.2% (198,847)
Number of families with income $40k - 50k:
Rosenberg:
10.8% (396)
Texas:
5.6% (216,490)
Number of families with income $50k - 60k:
Rosenberg:
10.7% (392)
Texas:
5.7% (220,689)
Number of families with income $60k - 75k:
Rosenberg:
8.6% (314)
State:
9.0% (346,106)
Number of families with income $75k - 100k:
Rosenberg:
18.0% (659)
State:
13.7% (527,363)
Number of families with income $100k - 125k:
Rosenberg:
10.3% (378)
Texas:
11.6% (448,411)
Number of families with income $125k - 150k:
Rosenberg:
8.7% (319)
State:
9.2% (355,798)
Number of families with income $150k - 200k:
Rosenberg:
9.2% (337)
Texas:
12.5% (480,185)
Number of families with income > $200k:
Rosenberg:
1.6% (59)
Texas:
17.6% (677,490)
Median non-family income in Rosenberg in 2022:
Rosenberg:
$52,147
Texas:
$50,587
Change in median non-family income between 2000 and 2022:
Rosenberg, Texas:
+109.0%
Texas:
+87.7%
Median per capita income in Rosenberg in 2022:
Rosenberg:
$28,865
Texas:
$47,740
Change in median per capita income between 2000 and 2022:
Rosenberg, Texas:
+68.5%
Texas:
+114.3%
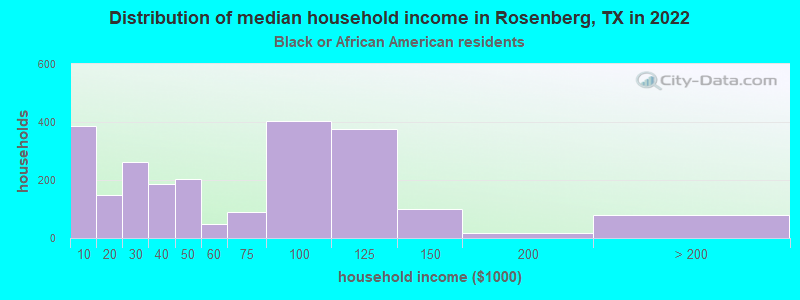
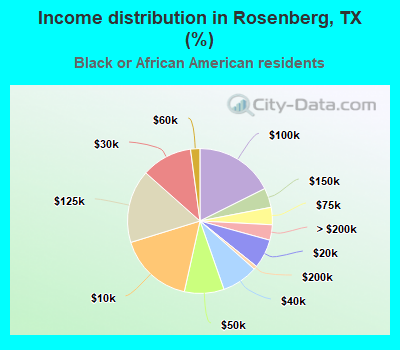
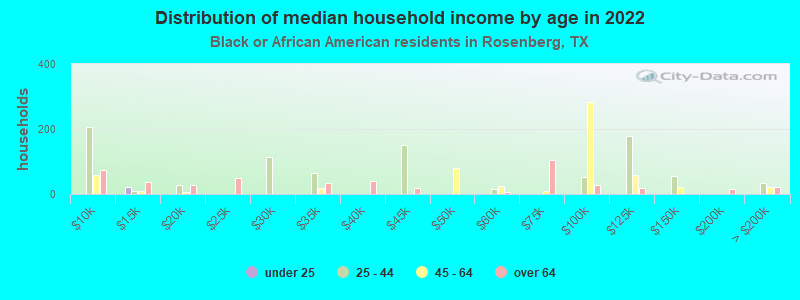
Income statistics for Black or African American residents
Median household income in Rosenberg, TX in 2022:
Rosenberg:
$74,250
Texas:
$55,759
Number of households with income < $10k:
Rosenberg:
16.8% (385)
Texas:
8.9% (126,378)
Number of households with income $10k - 20k:
Rosenberg:
6.5% (149)
Texas:
9.9% (140,369)
Number of households with income $20k - 30k:
Rosenberg:
11.4% (261)
State:
8.5% (120,639)
Number of households with income $30k - 40k:
Rosenberg:
8.1% (186)
State:
9.7% (137,517)
Number of households with income $40k - 50k:
Rosenberg:
8.8% (203)
State:
8.0% (112,973)
Number of households with income $50k - 60k:
Rosenberg:
2.1% (48)
State:
8.3% (117,156)
Number of households with income $60k - 75k:
Rosenberg:
3.9% (89)
State:
10.4% (147,462)
Number of households with income $75k - 100k:
Rosenberg:
17.6% (405)
Texas:
11.5% (162,718)
Number of households with income $100k - 125k:
Rosenberg:
16.3% (375)
State:
8.2% (115,829)
Number of households with income $125k - 150k:
Rosenberg:
4.4% (100)
Texas:
4.9% (69,556)
Number of households with income $150k - 200k:
Rosenberg:
0.8% (18)
State:
6.4% (90,701)
Number of households with income > $200k:
Rosenberg:
3.4% (79)
State:
5.5% (77,988)
Aggregate household income in Rosenberg in 2022: $149,944,994
Median family income in Rosenberg in 2022:
Rosenberg:
$88,392
State:
$69,134
Number of families with income < $10k:
Rosenberg:
15.9% (222)
State:
6.8% (55,625)
Number of families with income $10k - 20k:
Rosenberg:
7.6% (107)
State:
6.8% (55,300)
Number of families with income $20k - 30k:
Rosenberg:
5.7% (80)
State:
7.1% (57,877)
Number of families with income $30k - 40k:
Rosenberg:
4.1% (57)
State:
8.5% (68,776)
Number of families with income $40k - 50k:
Rosenberg:
3.6% (50)
Texas:
7.1% (57,907)
Number of families with income $50k - 60k:
Rosenberg:
1.2% (17)
State:
7.3% (59,511)
Number of families with income $60k - 75k:
Rosenberg:
2.1% (29)
State:
10.1% (81,994)
Number of families with income $75k - 100k:
Rosenberg:
35.2% (493)
State:
12.7% (103,723)
Number of families with income $100k - 125k:
Rosenberg:
10.2% (142)
State:
9.4% (76,609)
Number of families with income $125k - 150k:
Rosenberg:
7.6% (106)
State:
6.8% (55,615)
Number of families with income $150k - 200k:
Rosenberg:
1.3% (18)
State:
9.4% (76,146)
Number of families with income > $200k:
Rosenberg:
5.6% (78)
State:
7.9% (64,439)
Median non-family income in Rosenberg in 2022:
Rosenberg:
$31,445
State:
$40,133
Change in median non-family income between 2000 and 2022:
Rosenberg, Texas:
+63.7%
Texas:
+102.2%
Median per capita income in Rosenberg in 2022:
Rosenberg:
$29,452
State:
$30,490
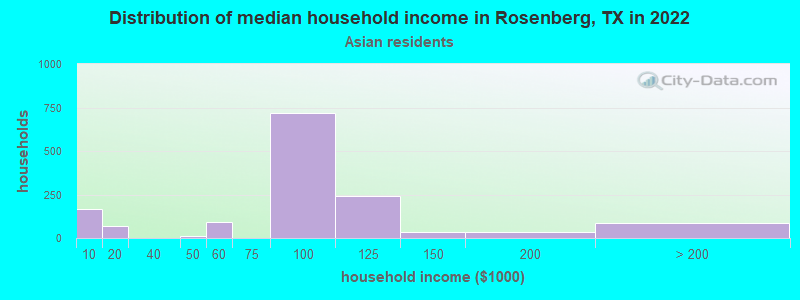
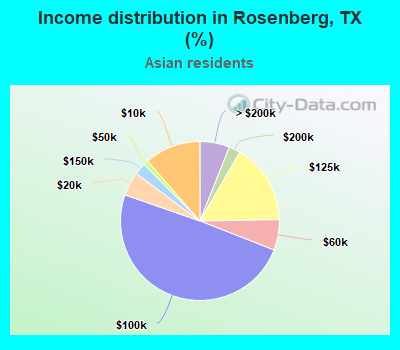
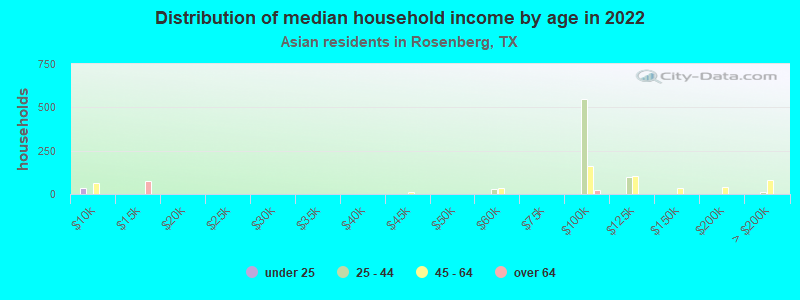
Income statistics for Asian residents
Median household income in Rosenberg, TX in 2022:
Rosenberg:
$90,864
Texas:
$107,673
Change in median household income between 2000 and 2022:
Rosenberg, Texas:
+23.5%
State:
+115.1%
Number of households with income < $10k:
Rosenberg:
11.4% (167)
State:
5.2% (29,885)
Number of households with income $10k - 20k:
Rosenberg:
4.9% (71)
Texas:
4.7% (27,044)
Number of households with income $20k - 30k:
Rosenberg:
0.0% (0)
State:
4.1% (23,363)
Number of households with income $30k - 40k:
Rosenberg:
0.0% (0)
State:
4.1% (23,309)
Number of households with income $40k - 50k:
Rosenberg:
1.0% (14)
Texas:
5.2% (29,826)
Number of households with income $50k - 60k:
Rosenberg:
6.2% (91)
State:
4.7% (26,512)
Number of households with income $60k - 75k:
Rosenberg:
0.0% (0)
Texas:
6.5% (36,905)
Number of households with income $75k - 100k:
Rosenberg:
49.4% (721)
State:
11.3% (64,350)
Number of households with income $100k - 125k:
Rosenberg:
16.4% (239)
State:
11.4% (64,714)
Number of households with income $125k - 150k:
Rosenberg:
2.4% (35)
State:
9.3% (52,719)
Number of households with income $150k - 200k:
Rosenberg:
2.3% (34)
State:
12.5% (70,953)
Number of households with income > $200k:
Rosenberg:
6.0% (88)
State:
21.1% (120,260)
Aggregate household income in Rosenberg in 2022: $126,517,710
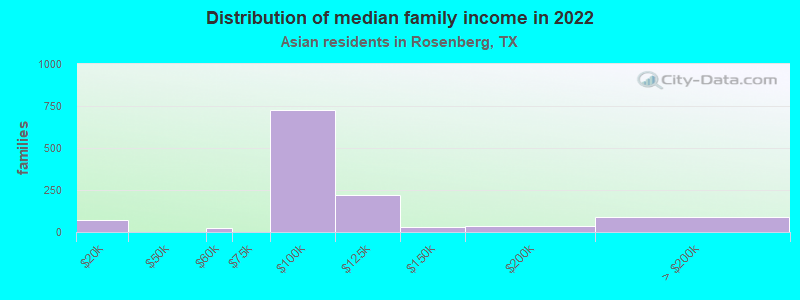
Median family income in Rosenberg in 2022:
Rosenberg:
$94,173
State:
$123,328
Number of families with income $10k - 20k:
Rosenberg:
6.1% (73)
State:
3.0% (13,043)
Number of families with income $50k - 60k:
Rosenberg:
2.0% (24)
State:
4.7% (20,568)
Number of families with income $75k - 100k:
Rosenberg:
60.7% (726)
State:
10.7% (46,626)
Number of families with income $100k - 125k:
Rosenberg:
18.2% (218)
Texas:
11.3% (49,585)
Number of families with income $125k - 150k:
Rosenberg:
2.6% (30)
State:
9.8% (43,043)
Number of families with income $150k - 200k:
Rosenberg:
2.9% (35)
State:
14.7% (64,203)
Number of families with income > $200k:
Rosenberg:
7.5% (89)
State:
24.8% (108,511)
Median per capita income in Rosenberg in 2022:
Rosenberg:
$33,914
State:
$48,626
Change in median per capita income between 2000 and 2022:
Rosenberg, Texas:
+105.6%
State:
+132.0%
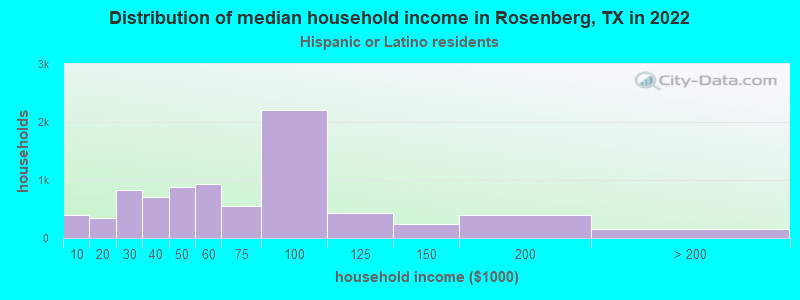
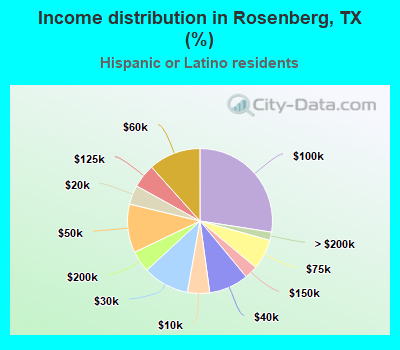
Income statistics for Hispanic or Latino residents
Median household income in Rosenberg, TX in 2022:
Rosenberg:
$60,175
State:
$60,504
Change in median household income between 2000 and 2022:
Rosenberg, Texas:
+89.7%
Texas:
+102.5%
Number of households with income < $10k:
Rosenberg:
5.0% (399)
State:
5.8% (213,953)
Number of households with income $10k - 20k:
Rosenberg:
4.3% (346)
State:
8.0% (297,456)
Number of households with income $20k - 30k:
Rosenberg:
10.3% (830)
State:
9.2% (340,166)
Number of households with income $30k - 40k:
Rosenberg:
8.8% (712)
State:
9.5% (354,336)
Number of households with income $40k - 50k:
Rosenberg:
10.8% (873)
Texas:
8.8% (327,013)
Number of households with income $50k - 60k:
Rosenberg:
11.6% (937)
State:
8.3% (308,818)
Number of households with income $60k - 75k:
Rosenberg:
6.8% (544)
State:
10.9% (405,109)
Number of households with income $75k - 100k:
Rosenberg:
27.5% (2,213)
State:
13.8% (511,639)
Number of households with income $100k - 125k:
Rosenberg:
5.3% (427)
State:
8.6% (319,728)
Number of households with income $125k - 150k:
Rosenberg:
2.9% (237)
State:
5.7% (210,932)
Number of households with income $150k - 200k:
Rosenberg:
4.8% (388)
State:
6.4% (236,055)
Number of households with income > $200k:
Rosenberg:
1.8% (148)
State:
5.1% (189,259)
Aggregate household income in Rosenberg in 2022: $528,804,667
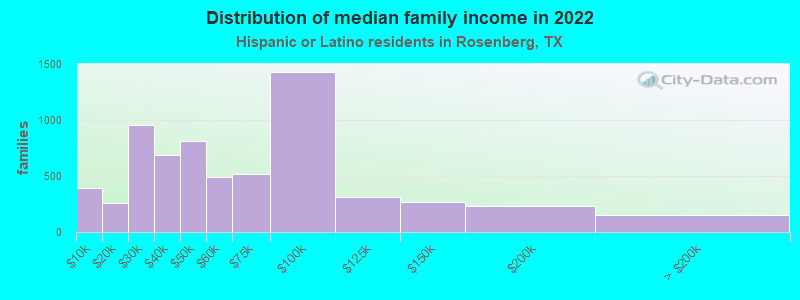
Median family income in Rosenberg in 2022:
Rosenberg:
$55,374
Texas:
$65,080
Number of families with income < $10k:
Rosenberg:
6.0% (392)
State:
5.3% (147,493)
Number of families with income $10k - 20k:
Rosenberg:
4.0% (257)
Texas:
6.3% (174,531)
Number of families with income $20k - 30k:
Rosenberg:
14.7% (955)
State:
8.6% (238,528)
Number of families with income $30k - 40k:
Rosenberg:
10.5% (684)
State:
9.1% (251,999)
Number of families with income $40k - 50k:
Rosenberg:
12.5% (811)
State:
8.6% (240,188)
Number of families with income $50k - 60k:
Rosenberg:
7.6% (490)
State:
8.0% (223,566)
Number of families with income $60k - 75k:
Rosenberg:
7.9% (516)
Texas:
10.9% (302,688)
Number of families with income $75k - 100k:
Rosenberg:
22.0% (1,427)
State:
14.3% (398,554)
Number of families with income $100k - 125k:
Rosenberg:
4.8% (315)
Texas:
9.5% (264,007)
Number of families with income $125k - 150k:
Rosenberg:
4.1% (266)
Texas:
6.2% (171,274)
Number of families with income $150k - 200k:
Rosenberg:
3.5% (228)
State:
7.3% (202,259)
Number of families with income > $200k:
Rosenberg:
2.3% (152)
State:
5.9% (165,129)
Median non-family income in Rosenberg in 2022:
Rosenberg:
$59,644
State:
$39,934
Median per capita income in Rosenberg in 2022:
Rosenberg:
$22,457
State:
$24,862
Change in median per capita income between 2000 and 2022:
Rosenberg, Texas:
+110.9%
State:
+130.8%
Income statistics for American Indian and Alaska Native residents
Number of households with income < $10k:
Rosenberg:
0.0% (0)
State:
4.1% (3,398)
Number of households with income $10k - 20k:
Rosenberg:
0.0% (0)
State:
8.3% (6,949)
Number of households with income $20k - 30k:
Rosenberg:
0.0% (0)
State:
9.3% (7,742)
Number of households with income $30k - 40k:
Rosenberg:
0.0% (0)
State:
9.1% (7,627)
Number of households with income $40k - 50k:
Rosenberg:
0.0% (0)
State:
7.1% (5,922)
Number of households with income $50k - 60k:
Rosenberg:
0.0% (0)
Texas:
8.1% (6,761)
Number of households with income $60k - 75k:
Rosenberg:
0.0% (0)
Texas:
12.7% (10,588)
Number of households with income $75k - 100k:
Rosenberg:
100.0% (37)
State:
13.0% (10,903)
Number of households with income $100k - 125k:
Rosenberg:
0.0% (0)
State:
9.9% (8,256)
Number of households with income $125k - 150k:
Rosenberg:
0.0% (0)
State:
5.2% (4,355)
Number of households with income $150k - 200k:
Rosenberg:
0.0% (0)
State:
6.7% (5,623)
Number of households with income > $200k:
Rosenberg:
0.0% (0)
State:
6.6% (5,522)
Aggregate household income in Rosenberg in 2022: $5,172,950
Median per capita income in Rosenberg in 2022:
Rosenberg:
$45,348
Texas:
$28,166
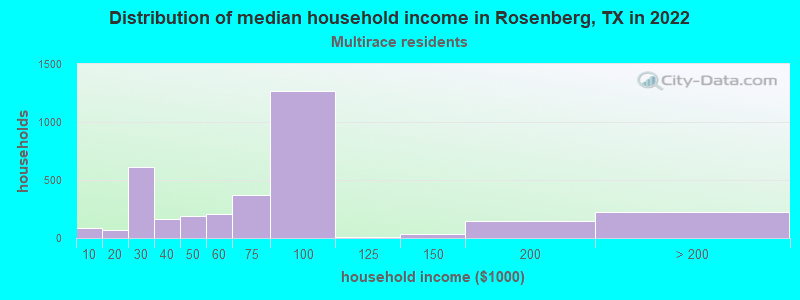
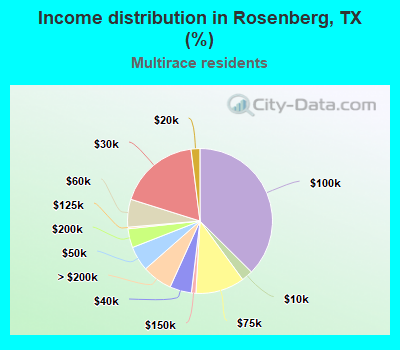
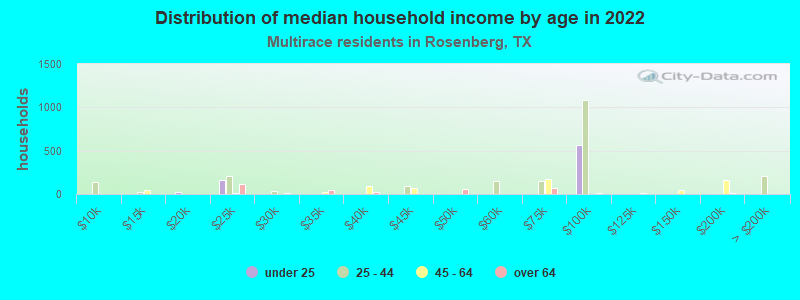
Income statistics for Multirace residents
Median household income in Rosenberg, TX in 2022:
Rosenberg:
$73,356
State:
$62,748
Number of households with income < $10k:
Rosenberg:
2.5% (86)
State:
5.5% (122,324)
Number of households with income $10k - 20k:
Rosenberg:
2.0% (67)
Texas:
8.2% (182,232)
Number of households with income $20k - 30k:
Rosenberg:
18.2% (613)
State:
8.5% (189,456)
Number of households with income $30k - 40k:
Rosenberg:
4.9% (164)
Texas:
8.9% (197,499)
Number of households with income $40k - 50k:
Rosenberg:
5.5% (186)
Texas:
8.7% (191,735)
Number of households with income $50k - 60k:
Rosenberg:
6.2% (209)
Texas:
8.0% (177,535)
Number of households with income $60k - 75k:
Rosenberg:
10.9% (368)
State:
10.5% (232,479)
Number of households with income $75k - 100k:
Rosenberg:
37.4% (1,263)
Texas:
13.1% (290,448)
Number of households with income $100k - 125k:
Rosenberg:
0.4% (12)
Texas:
8.6% (191,595)
Number of households with income $125k - 150k:
Rosenberg:
1.0% (34)
State:
6.0% (133,361)
Number of households with income $150k - 200k:
Rosenberg:
4.2% (143)
State:
7.2% (159,195)
Number of households with income > $200k:
Rosenberg:
6.8% (228)
State:
6.7% (148,064)
Aggregate household income in Rosenberg in 2022: $269,576,498
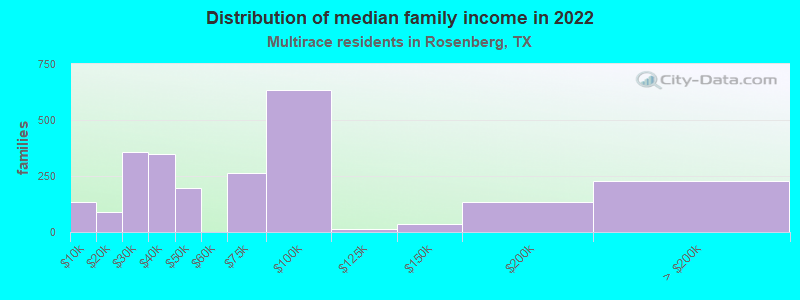
Median family income in Rosenberg in 2022:
Rosenberg:
$59,535
State:
$69,780
Number of families with income < $10k:
Rosenberg:
5.4% (132)
State:
4.4% (70,825)
Number of families with income $10k - 20k:
Rosenberg:
3.7% (90)
State:
5.9% (95,279)
Number of families with income $20k - 30k:
Rosenberg:
14.6% (356)
Texas:
7.8% (126,627)
Number of families with income $30k - 40k:
Rosenberg:
14.3% (348)
State:
8.5% (137,626)
Number of families with income $40k - 50k:
Rosenberg:
8.1% (198)
Texas:
8.4% (135,809)
Number of families with income $60k - 75k:
Rosenberg:
10.8% (263)
Texas:
10.5% (169,549)
Number of families with income $75k - 100k:
Rosenberg:
26.1% (635)
State:
14.0% (226,284)
Number of families with income $100k - 125k:
Rosenberg:
0.5% (13)
Texas:
9.5% (153,597)
Number of families with income $125k - 150k:
Rosenberg:
1.5% (35)
Texas:
6.7% (107,900)
Number of families with income $150k - 200k:
Rosenberg:
5.5% (134)
State:
8.5% (137,607)
Number of families with income > $200k:
Rosenberg:
9.4% (228)
State:
7.9% (127,299)
Median non-family income in Rosenberg in 2022:
Rosenberg:
$64,056
State:
$40,634
Median per capita income in Rosenberg in 2022:
Rosenberg:
$25,882
Texas:
$26,785
Change in median per capita income between 2000 and 2022:
Rosenberg, Texas:
+92.1%
State:
+110.9%
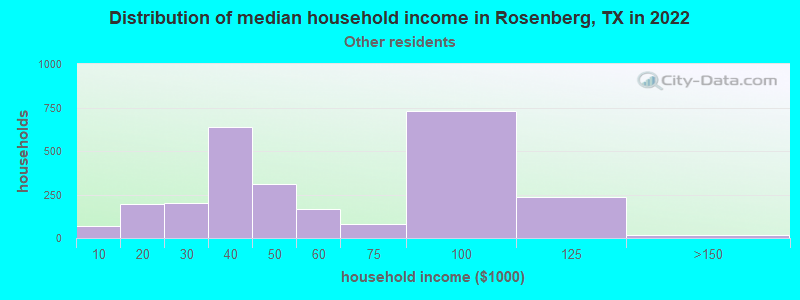
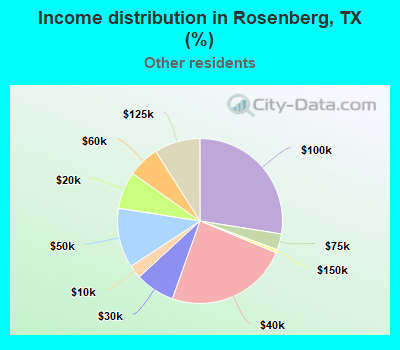
Income statistics for other residents
Median household income in Rosenberg, TX in 2022:
Rosenberg:
$46,952
Texas:
$57,114
Number of households with income < $10k:
Rosenberg:
2.6% (69)
State:
5.9% (54,162)
Number of households with income $10k - 20k:
Rosenberg:
7.3% (193)
Texas:
6.8% (62,891)
Number of households with income $20k - 30k:
Rosenberg:
7.7% (204)
Texas:
10.6% (97,294)
Number of households with income $30k - 40k:
Rosenberg:
24.1% (638)
Texas:
10.8% (99,670)
Number of households with income $40k - 50k:
Rosenberg:
11.7% (310)
State:
9.3% (85,548)
Number of households with income $50k - 60k:
Rosenberg:
6.2% (164)
State:
9.0% (82,757)
Number of households with income $60k - 75k:
Rosenberg:
3.1% (83)
State:
10.9% (100,326)
Number of households with income $75k - 100k:
Rosenberg:
27.5% (728)
State:
14.0% (128,767)
Number of households with income $100k - 125k:
Rosenberg:
9.0% (238)
State:
8.2% (75,218)
Number of households with income $125k - 150k:
Rosenberg:
0.6% (17)
State:
4.8% (44,223)
Number of households with income $150k - 200k:
Rosenberg:
0.0% (0)
Texas:
5.6% (51,376)
Number of households with income > $200k:
Rosenberg:
0.0% (0)
State:
4.0% (36,393)
Aggregate household income in Rosenberg in 2022: $134,332,443
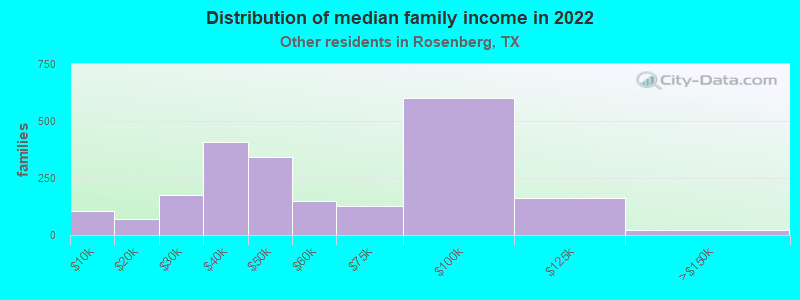
Median family income in Rosenberg in 2022:
Rosenberg:
$52,142
State:
$60,064
Number of families with income < $10k:
Rosenberg:
4.9% (106)
State:
6.8% (47,502)
Number of families with income $10k - 20k:
Rosenberg:
3.2% (68)
Texas:
6.0% (41,763)
Number of families with income $20k - 30k:
Rosenberg:
8.2% (177)
State:
9.9% (68,761)
Number of families with income $30k - 40k:
Rosenberg:
18.8% (406)
State:
9.7% (67,685)
Number of families with income $40k - 50k:
Rosenberg:
15.8% (341)
State:
9.0% (62,441)
Number of families with income $50k - 60k:
Rosenberg:
7.0% (150)
State:
8.5% (59,321)
Number of families with income $60k - 75k:
Rosenberg:
5.8% (126)
State:
11.2% (77,588)
Number of families with income $75k - 100k:
Rosenberg:
27.8% (599)
State:
14.5% (101,032)
Number of families with income $100k - 125k:
Rosenberg:
7.6% (164)
State:
8.8% (61,439)
Number of families with income $125k - 150k:
Rosenberg:
1.0% (21)
Texas:
5.1% (35,727)
Median per capita income in Rosenberg in 2022:
Rosenberg:
$16,282
Texas:
$23,899
Change in median per capita income between 2000 and 2022:
Rosenberg, Texas:
+71.7%
Texas:
+135.2%
Discuss Rosenberg, Texas (TX) on our hugely popular Texas forum.