The median household income in San Perlita, TX in 2022 was $29,845, which was 142.2% less than the median annual income of $72,284 across the entire state of Texas. Compared to the median income of $22,500 in 2000 this represents an increase of 24.6%. The per capita income in 2022 was $13,917, which means an increase of 51.4% compared to 2000 when it was $6,761.
Whole page based on the data from 2000 / 2022 when the population of San Perlita, Texas was 680 / 805
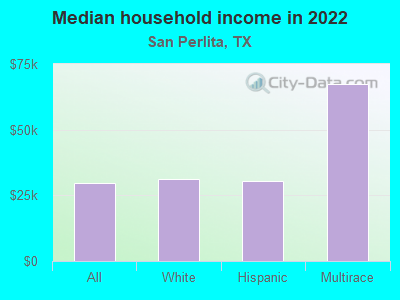
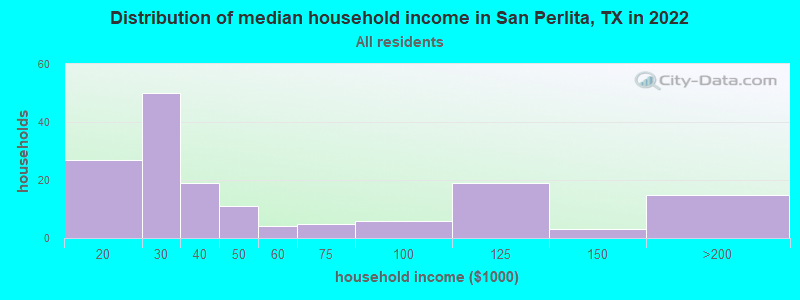
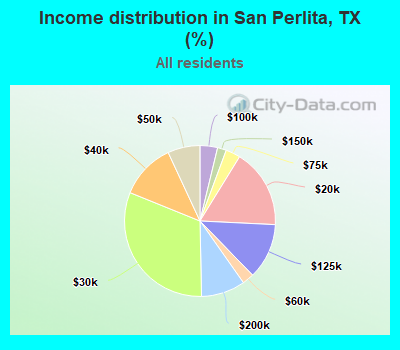
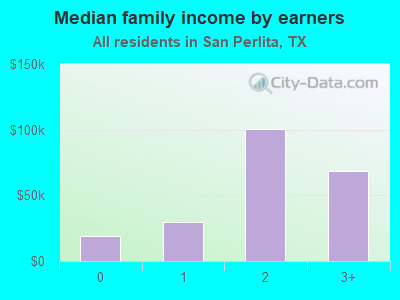
Income statistics for all residents
Median household income in San Perlita, TX in 2022:
San Perlita:
$29,846
Texas:
$72,284
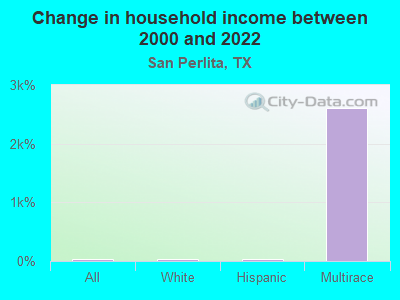
Change in median household income between 2000 and 2022:
San Perlita, Texas:
+32.6%
Texas:
+81.0%
Number of households with income < $10k:
San Perlita:
0.0% (0)
State:
5.5% (611,011)
Number of households with income $10k - 20k:
San Perlita:
17.0% (27)
State:
6.7% (743,157)
Number of households with income $20k - 30k:
San Perlita:
31.4% (50)
State:
7.2% (803,381)
Number of households with income $30k - 40k:
San Perlita:
11.9% (19)
State:
7.8% (866,080)
Number of households with income $40k - 50k:
San Perlita:
6.9% (11)
State:
7.3% (810,440)
Number of households with income $50k - 60k:
San Perlita:
2.5% (4)
State:
7.2% (799,783)
Number of households with income $60k - 75k:
San Perlita:
3.1% (5)
State:
9.9% (1,095,384)
Number of households with income $75k - 100k:
San Perlita:
3.8% (6)
State:
12.8% (1,419,057)
Number of households with income $100k - 125k:
San Perlita:
11.9% (19)
State:
9.5% (1,054,577)
Number of households with income $125k - 150k:
San Perlita:
1.9% (3)
State:
6.7% (741,518)
Number of households with income $150k - 200k:
San Perlita:
9.4% (15)
State:
8.7% (961,776)
Number of households with income > $200k:
San Perlita:
0.0% (0)
State:
10.7% (1,181,544)
Aggregate household income in San Perlita in 2022: $8,812,891
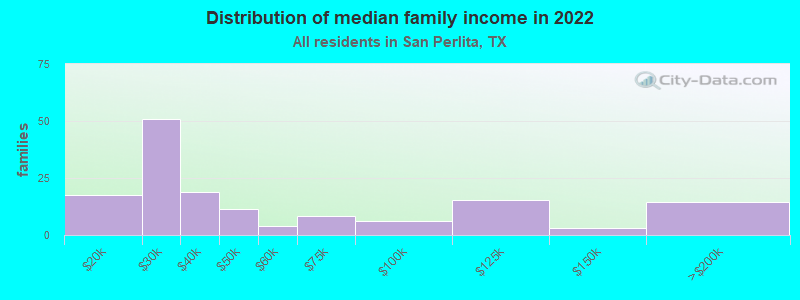
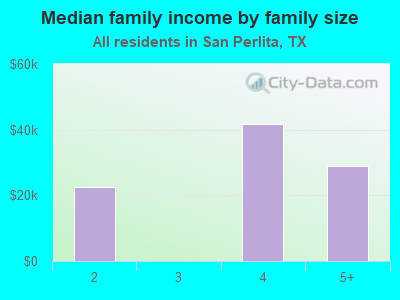
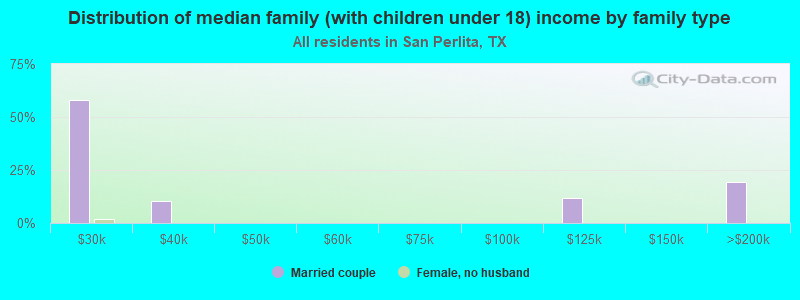
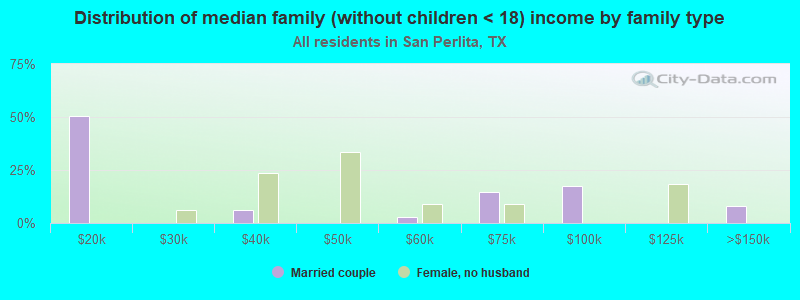
Median family income in San Perlita in 2022:
San Perlita:
$31,238
State:
$86,267
Number of families with income $10k - 20k:
San Perlita:
11.5% (17)
State:
4.3% (324,514)
Number of families with income $20k - 30k:
San Perlita:
33.9% (51)
State:
5.8% (430,949)
Number of families with income $30k - 40k:
San Perlita:
12.5% (19)
State:
6.6% (493,535)
Number of families with income $40k - 50k:
San Perlita:
7.6% (11)
State:
6.7% (499,663)
Number of families with income $50k - 60k:
San Perlita:
2.8% (4)
Texas:
6.6% (492,203)
Number of families with income $60k - 75k:
San Perlita:
5.7% (9)
State:
9.5% (710,229)
Number of families with income $75k - 100k:
San Perlita:
4.2% (6)
State:
13.6% (1,015,480)
Number of families with income $100k - 125k:
San Perlita:
10.1% (15)
State:
10.7% (797,961)
Number of families with income $125k - 150k:
San Perlita:
2.0% (3)
Texas:
8.1% (602,985)
Number of families with income $150k - 200k:
San Perlita:
9.7% (15)
Texas:
10.7% (804,459)
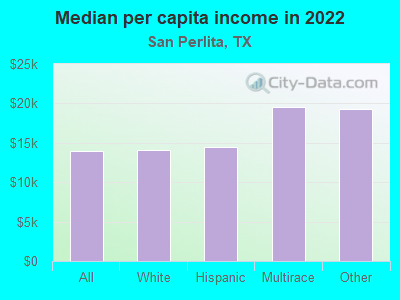
Median per capita income in San Perlita in 2022:
San Perlita:
$13,917
State:
$38,123
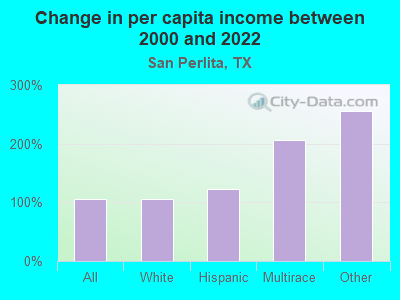
Change in median per capita income between 2000 and 2022:
San Perlita, Texas:
+105.8%
State:
+94.3%
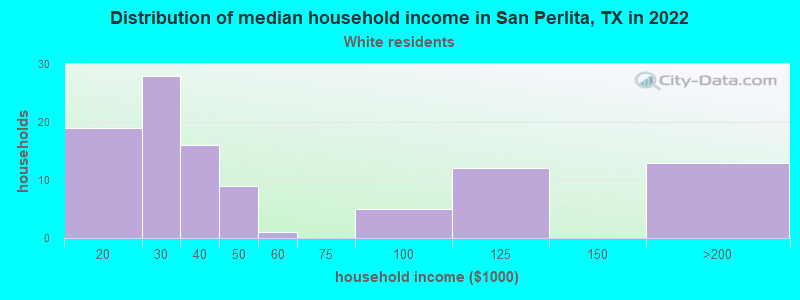
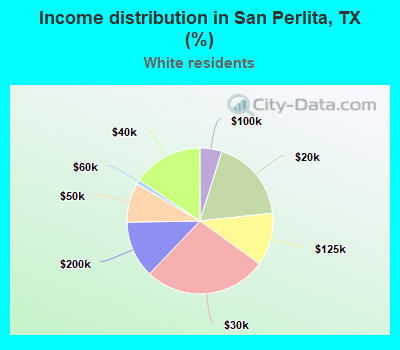
Income statistics for White residents
Median household income in San Perlita, TX in 2022:
San Perlita:
$31,031
Texas:
$82,032
Change in median household income between 2000 and 2022:
San Perlita, Texas:
+31.3%
State:
+91.0%
Number of households with income < $10k:
San Perlita:
0.0% (0)
Texas:
4.7% (273,716)
Number of households with income $10k - 20k:
San Perlita:
18.4% (19)
State:
5.5% (322,702)
Number of households with income $20k - 30k:
San Perlita:
27.2% (28)
Texas:
6.2% (363,947)
Number of households with income $30k - 40k:
San Perlita:
15.5% (16)
Texas:
6.8% (399,275)
Number of households with income $40k - 50k:
San Perlita:
8.7% (9)
State:
6.5% (383,417)
Number of households with income $50k - 60k:
San Perlita:
1.0% (1)
Texas:
6.6% (388,535)
Number of households with income $60k - 75k:
San Perlita:
0.0% (0)
State:
9.7% (566,295)
Number of households with income $75k - 100k:
San Perlita:
4.9% (5)
State:
13.0% (760,276)
Number of households with income $100k - 125k:
San Perlita:
11.7% (12)
State:
10.2% (597,596)
Number of households with income $125k - 150k:
San Perlita:
0.0% (0)
State:
7.4% (436,830)
Number of households with income $150k - 200k:
San Perlita:
12.6% (13)
State:
9.9% (583,067)
Number of households with income > $200k:
San Perlita:
0.0% (0)
Texas:
13.5% (792,647)
Aggregate household income in San Perlita in 2022: $6,040,699
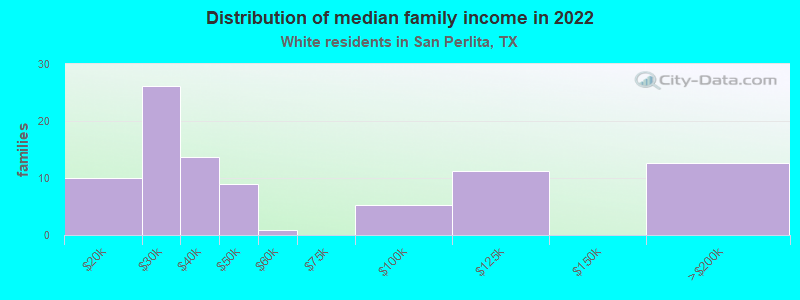
Median family income in San Perlita in 2022:
San Perlita:
$33,396
Texas:
$101,788
Number of families with income $10k - 20k:
San Perlita:
11.3% (10)
State:
2.9% (113,421)
Number of families with income $20k - 30k:
San Perlita:
29.4% (26)
State:
4.1% (157,688)
Number of families with income $30k - 40k:
San Perlita:
15.4% (14)
Texas:
5.2% (198,847)
Number of families with income $40k - 50k:
San Perlita:
10.1% (9)
State:
5.6% (216,490)
Number of families with income $50k - 60k:
San Perlita:
0.9% (1)
Texas:
5.7% (220,689)
Number of families with income $75k - 100k:
San Perlita:
5.9% (5)
Texas:
13.7% (527,363)
Number of families with income $100k - 125k:
San Perlita:
12.7% (11)
Texas:
11.6% (448,411)
Number of families with income $150k - 200k:
San Perlita:
14.2% (13)
Texas:
12.5% (480,185)
Median per capita income in San Perlita in 2022:
San Perlita:
$14,082
State:
$47,740
Change in median per capita income between 2000 and 2022:
San Perlita, Texas:
+105.9%
State:
+114.3%
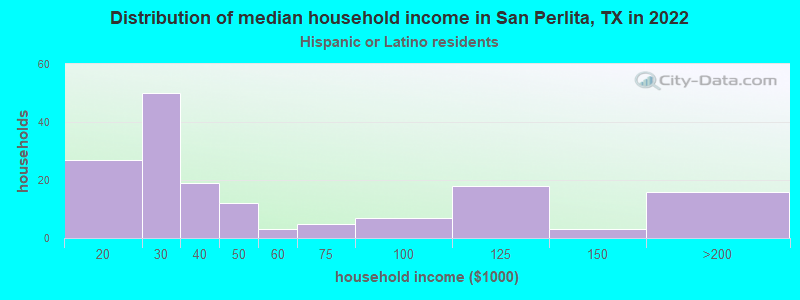
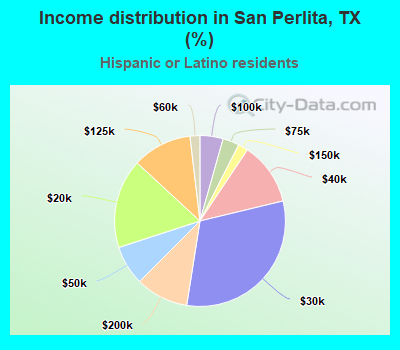
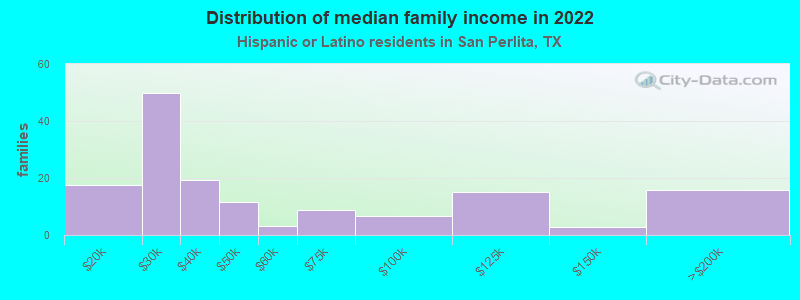
Income statistics for Hispanic or Latino residents
Median household income in San Perlita, TX in 2022:
San Perlita:
$30,589
State:
$60,504
Change in median household income between 2000 and 2022:
San Perlita, Texas:
+41.2%
State:
+102.5%
Number of households with income < $10k:
San Perlita:
0.0% (0)
State:
5.8% (213,953)
Number of households with income $10k - 20k:
San Perlita:
16.9% (27)
Texas:
8.0% (297,456)
Number of households with income $20k - 30k:
San Perlita:
31.2% (50)
State:
9.2% (340,166)
Number of households with income $30k - 40k:
San Perlita:
11.9% (19)
Texas:
9.5% (354,336)
Number of households with income $40k - 50k:
San Perlita:
7.5% (12)
State:
8.8% (327,013)
Number of households with income $50k - 60k:
San Perlita:
1.9% (3)
State:
8.3% (308,818)
Number of households with income $60k - 75k:
San Perlita:
3.1% (5)
State:
10.9% (405,109)
Number of households with income $75k - 100k:
San Perlita:
4.4% (7)
Texas:
13.8% (511,639)
Number of households with income $100k - 125k:
San Perlita:
11.2% (18)
Texas:
8.6% (319,728)
Number of households with income $125k - 150k:
San Perlita:
1.9% (3)
Texas:
5.7% (210,932)
Number of households with income $150k - 200k:
San Perlita:
10.0% (16)
State:
6.4% (236,055)
Number of households with income > $200k:
San Perlita:
0.0% (0)
Texas:
5.1% (189,259)
Aggregate household income in San Perlita in 2022: $8,940,522
Median family income in San Perlita in 2022:
San Perlita:
$31,962
State:
$65,080
Number of families with income $10k - 20k:
San Perlita:
11.7% (18)
State:
6.3% (174,531)
Number of families with income $20k - 30k:
San Perlita:
33.1% (50)
State:
8.6% (238,528)
Number of families with income $30k - 40k:
San Perlita:
12.7% (19)
Texas:
9.1% (251,999)
Number of families with income $40k - 50k:
San Perlita:
7.7% (12)
State:
8.6% (240,188)
Number of families with income $50k - 60k:
San Perlita:
2.1% (3)
State:
8.0% (223,566)
Number of families with income $60k - 75k:
San Perlita:
5.7% (9)
State:
10.9% (302,688)
Number of families with income $75k - 100k:
San Perlita:
4.4% (7)
State:
14.3% (398,554)
Number of families with income $100k - 125k:
San Perlita:
10.1% (15)
State:
9.5% (264,007)
Number of families with income $125k - 150k:
San Perlita:
2.0% (3)
State:
6.2% (171,274)
Number of families with income $150k - 200k:
San Perlita:
10.5% (16)
State:
7.3% (202,259)
Median per capita income in San Perlita in 2022:
San Perlita:
$14,477
Texas:
$24,862
Change in median per capita income between 2000 and 2022:
San Perlita, Texas:
+121.7%
State:
+130.8%
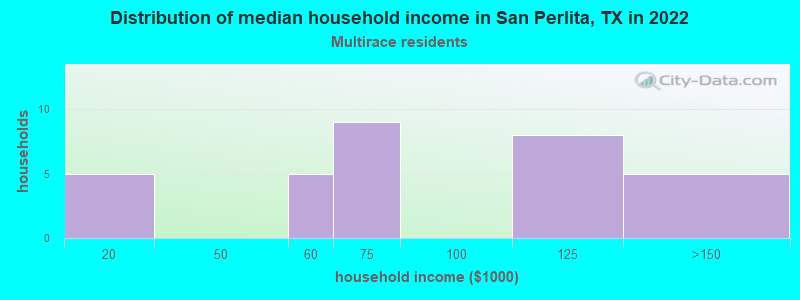
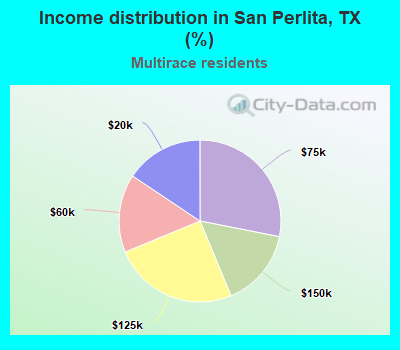
Income statistics for Multirace residents
Median household income in San Perlita, TX in 2022:
San Perlita:
$67,542
State:
$62,748
Number of households with income < $10k:
San Perlita:
0.0% (0)
Texas:
5.5% (122,324)
Number of households with income $10k - 20k:
San Perlita:
15.6% (5)
State:
8.2% (182,232)
Number of households with income $20k - 30k:
San Perlita:
0.0% (0)
Texas:
8.5% (189,456)
Number of households with income $30k - 40k:
San Perlita:
0.0% (0)
Texas:
8.9% (197,499)
Number of households with income $40k - 50k:
San Perlita:
0.0% (0)
State:
8.7% (191,735)
Number of households with income $50k - 60k:
San Perlita:
15.6% (5)
State:
8.0% (177,535)
Number of households with income $60k - 75k:
San Perlita:
28.1% (9)
Texas:
10.5% (232,479)
Number of households with income $75k - 100k:
San Perlita:
0.0% (0)
State:
13.1% (290,448)
Number of households with income $100k - 125k:
San Perlita:
25.0% (8)
Texas:
8.6% (191,595)
Number of households with income $125k - 150k:
San Perlita:
15.6% (5)
Texas:
6.0% (133,361)
Number of households with income $150k - 200k:
San Perlita:
0.0% (0)
Texas:
7.2% (159,195)
Number of households with income > $200k:
San Perlita:
0.0% (0)
Texas:
6.7% (148,064)
Aggregate household income in San Perlita in 2022: $2,483,333
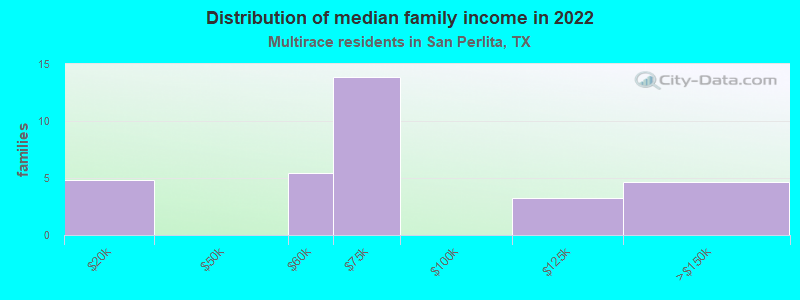
Median family income in San Perlita in 2022:
San Perlita:
$66,723
Texas:
$69,780
Number of families with income $10k - 20k:
San Perlita:
15.2% (5)
Texas:
5.9% (95,279)
Number of families with income $50k - 60k:
San Perlita:
17.0% (5)
Texas:
7.9% (127,739)
Number of families with income $60k - 75k:
San Perlita:
43.3% (14)
Texas:
10.5% (169,549)
Number of families with income $100k - 125k:
San Perlita:
10.0% (3)
Texas:
9.5% (153,597)
Number of families with income $125k - 150k:
San Perlita:
14.5% (5)
State:
6.7% (107,900)
Median per capita income in San Perlita in 2022:
San Perlita:
$19,503
State:
$26,785
Income statistics for other residents
Number of households with income < $10k:
San Perlita:
0.0% (0)
State:
5.9% (54,162)
Number of households with income $10k - 20k:
San Perlita:
0.0% (0)
State:
6.8% (62,891)
Number of households with income $20k - 30k:
San Perlita:
100.0% (19)
State:
10.6% (97,294)
Number of households with income $30k - 40k:
San Perlita:
0.0% (0)
Texas:
10.8% (99,670)
Number of households with income $40k - 50k:
San Perlita:
0.0% (0)
State:
9.3% (85,548)
Number of households with income $50k - 60k:
San Perlita:
0.0% (0)
Texas:
9.0% (82,757)
Number of households with income $60k - 75k:
San Perlita:
0.0% (0)
State:
10.9% (100,326)
Number of households with income $75k - 100k:
San Perlita:
0.0% (0)
State:
14.0% (128,767)
Number of households with income $100k - 125k:
San Perlita:
0.0% (0)
State:
8.2% (75,218)
Number of households with income $125k - 150k:
San Perlita:
0.0% (0)
State:
4.8% (44,223)
Number of households with income $150k - 200k:
San Perlita:
0.0% (0)
State:
5.6% (51,376)
Number of households with income > $200k:
San Perlita:
0.0% (0)
State:
4.0% (36,393)
Aggregate household income in San Perlita in 2022: $340,909
Median per capita income in San Perlita in 2022:
San Perlita:
$19,232
State:
$23,899
Discuss San Perlita, Texas (TX) on our hugely popular Texas forum.