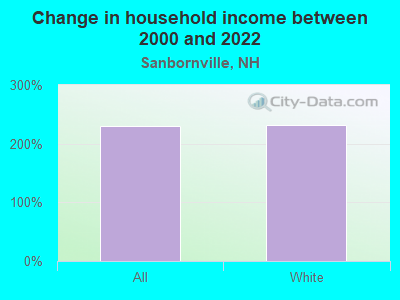
The median household income in Sanbornville, NH in 2022 was $131,916, which was 31.8% greater than the median annual income of $89,992 across the entire state of New Hampshire. Compared to the median income of $39,990 in 2000 this represents an increase of 69.7%. The per capita income in 2022 was $45,825, which means an increase of 52.1% compared to 2000 when it was $21,931.
Whole page based on the data from 2000 / 2022 when the population of Sanbornville, New Hampshire was 1,056 / 929
Income statistics for all residents
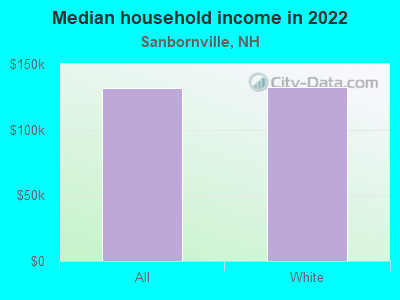
Median household income in Sanbornville, NH in 2022:
Sanbornville:
$131,917
State:
$89,992
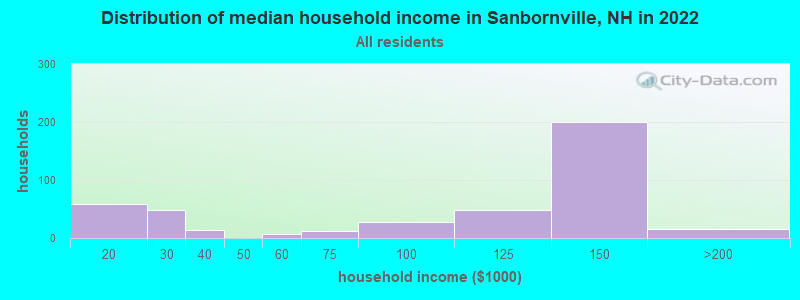
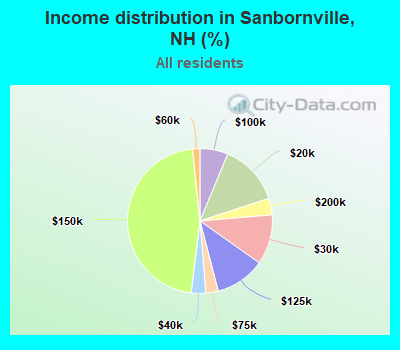
Number of households with income < $10k:
Sanbornville:
0.0% (0)
New Hampshire:
3.1% (17,541)
Number of households with income $10k - 20k:
Sanbornville:
13.7% (59)
State:
5.4% (29,916)
Number of households with income $20k - 30k:
Sanbornville:
11.1% (48)
State:
5.5% (30,783)
Number of households with income $30k - 40k:
Sanbornville:
3.2% (14)
New Hampshire:
5.9% (32,868)
Number of households with income $40k - 50k:
Sanbornville:
0.0% (0)
New Hampshire:
5.9% (32,728)
Number of households with income $50k - 60k:
Sanbornville:
1.6% (7)
State:
6.9% (38,422)
Number of households with income $60k - 75k:
Sanbornville:
2.8% (12)
State:
9.1% (50,552)
Number of households with income $75k - 100k:
Sanbornville:
6.3% (27)
State:
13.1% (73,145)
Number of households with income $100k - 125k:
Sanbornville:
11.1% (48)
New Hampshire:
10.5% (58,593)
Number of households with income $125k - 150k:
Sanbornville:
46.4% (200)
State:
8.1% (44,878)
Number of households with income $150k - 200k:
Sanbornville:
3.7% (16)
State:
11.5% (64,340)
Number of households with income > $200k:
Sanbornville:
0.0% (0)
State:
15.0% (83,454)
Aggregate household income in Sanbornville in 2022: $45,312,351
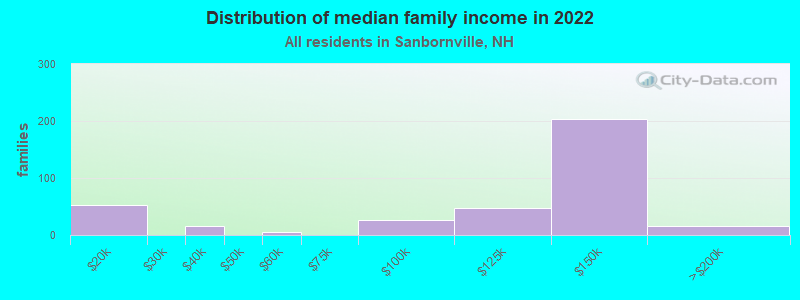
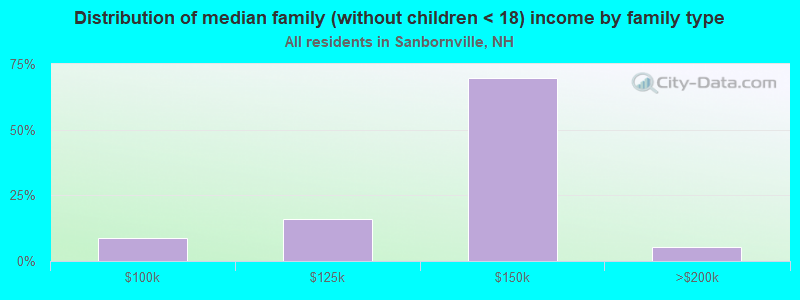
Median family income in Sanbornville in 2022:
Sanbornville:
$136,956
New Hampshire:
$112,950
Number of families with income $10k - 20k:
Sanbornville:
14.3% (53)
State:
2.0% (7,188)
Number of families with income $30k - 40k:
Sanbornville:
4.0% (15)
State:
4.2% (15,188)
Number of families with income $50k - 60k:
Sanbornville:
1.7% (6)
New Hampshire:
5.6% (20,061)
Number of families with income $75k - 100k:
Sanbornville:
7.4% (27)
State:
13.9% (49,922)
Number of families with income $100k - 125k:
Sanbornville:
12.7% (47)
State:
12.2% (43,562)
Number of families with income $125k - 150k:
Sanbornville:
55.6% (204)
State:
10.1% (36,190)
Number of families with income $150k - 200k:
Sanbornville:
4.4% (16)
State:
14.9% (53,418)
Median income for 2 person families:
Sanbornville:
$138,292
New Hampshire:
$95,861
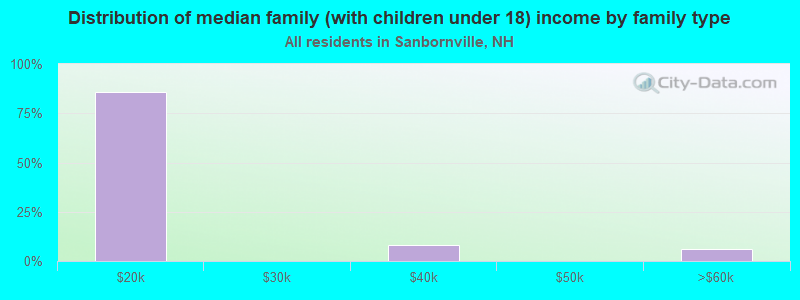
Median income for families with 0 earners:
Sanbornville:
$0
State:
$58,095
Median income for families with 1 earner:
Sanbornville:
$0
New Hampshire:
$80,695
Median income for families with 2 earners:
Sanbornville:
$140,731
State:
$135,599
Median income for families with 3+ earners:
Sanbornville:
$0
State:
$178,031
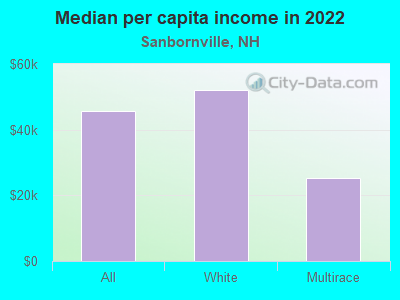
Median per capita income in Sanbornville in 2022:
Sanbornville:
$45,826
New Hampshire:
$49,281
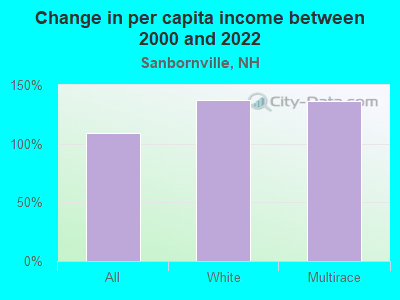
Change in median per capita income between 2000 and 2022:
Sanbornville, New Hampshire:
+109.0%
State:
+106.7%
Income statistics for White residents
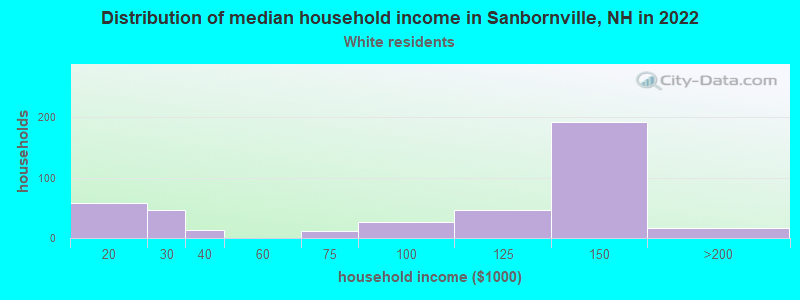
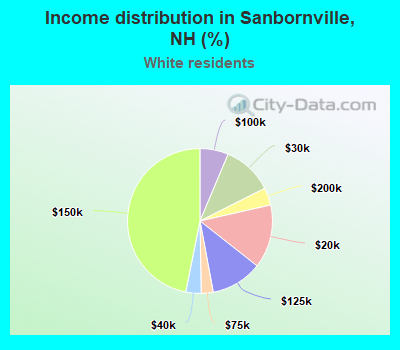
Median household income in Sanbornville, NH in 2022:
Sanbornville:
$132,855
New Hampshire:
$90,839
Number of households with income < $10k:
Sanbornville:
0.0% (0)
State:
3.1% (15,499)
Number of households with income $10k - 20k:
Sanbornville:
14.1% (58)
New Hampshire:
5.6% (27,915)
Number of households with income $20k - 30k:
Sanbornville:
11.2% (46)
State:
5.4% (27,382)
Number of households with income $30k - 40k:
Sanbornville:
3.4% (14)
New Hampshire:
5.9% (29,681)
Number of households with income $40k - 50k:
Sanbornville:
0.0% (0)
State:
5.7% (28,456)
Number of households with income $50k - 60k:
Sanbornville:
0.0% (0)
State:
6.9% (34,641)
Number of households with income $60k - 75k:
Sanbornville:
2.7% (11)
State:
9.0% (45,144)
Number of households with income $75k - 100k:
Sanbornville:
6.3% (26)
State:
13.0% (65,259)
Number of households with income $100k - 125k:
Sanbornville:
11.5% (47)
New Hampshire:
10.7% (53,931)
Number of households with income $125k - 150k:
Sanbornville:
46.8% (192)
State:
8.1% (40,466)
Number of households with income $150k - 200k:
Sanbornville:
3.9% (16)
New Hampshire:
11.9% (59,781)
Number of households with income > $200k:
Sanbornville:
0.0% (0)
State:
14.8% (74,387)
Aggregate household income in Sanbornville in 2022: $43,911,216
Median family income in Sanbornville in 2022:
Sanbornville:
$138,653
New Hampshire:
$115,125
Number of families with income $10k - 20k:
Sanbornville:
15.0% (53)
State:
2.1% (6,602)
Number of families with income $30k - 40k:
Sanbornville:
4.2% (15)
State:
4.0% (12,696)
Number of families with income $75k - 100k:
Sanbornville:
7.4% (26)
State:
13.8% (44,284)
Number of families with income $100k - 125k:
Sanbornville:
12.9% (45)
State:
12.5% (39,959)
Number of families with income $125k - 150k:
Sanbornville:
56.0% (198)
State:
10.3% (33,038)
Number of families with income $150k - 200k:
Sanbornville:
4.6% (16)
State:
15.4% (49,456)
Median per capita income in Sanbornville in 2022:
Sanbornville:
$52,172
State:
$50,469
Change in median per capita income between 2000 and 2022:
Sanbornville, New Hampshire:
+136.7%
New Hampshire:
+109.2%
Income statistics for Multirace residents
Aggregate household income in Sanbornville in 2022: $67,567,169
Median per capita income in Sanbornville in 2022:
Sanbornville:
$25,196
State:
$34,906
Change in median per capita income between 2000 and 2022:
Sanbornville, New Hampshire:
+136.0%
State:
+135.6%
Discuss Sanbornville, New Hampshire (NH) on our hugely popular New Hampshire forum.