Sanford, Virginia (VA) income map, earnings map, and wages data
Data:
The per capita income in 2022 was $33,289, which means an increase of 51.0% compared to 2000 when it was $16,309.
Whole page based on the data from 2000 / 2022 when the population of Sanford, Virginia was 212 / 36
Income statistics for all residents
Number of households with income < $10k:| Sanford: | 0.0% (0) |
| State: | 4.9% (165,315) |
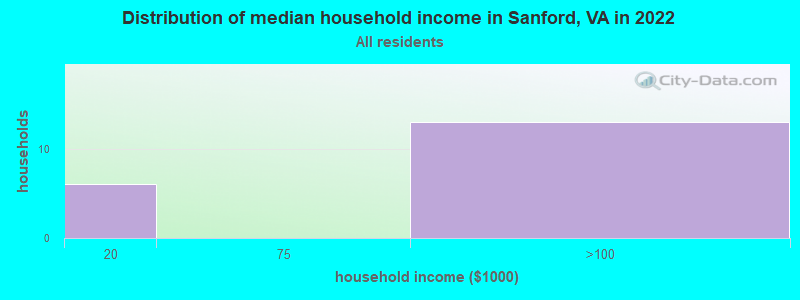
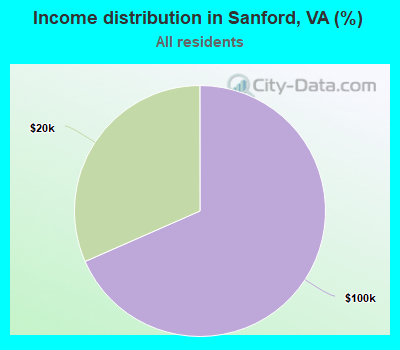
Number of households with income $10k - 20k:| Sanford: | 31.6% (6) |
| State: | 5.9% (199,380) |
Number of households with income $20k - 30k:| Sanford: | 0.0% (0) |
| State: | 6.0% (202,243) |
Number of households with income $30k - 40k:| Sanford: | 0.0% (0) |
| State: | 6.1% (205,967) |
Number of households with income $40k - 50k:| Sanford: | 0.0% (0) |
| Virginia: | 6.4% (215,648) |
Number of households with income $50k - 60k:| Sanford: | 0.0% (0) |
| State: | 6.2% (210,516) |
Number of households with income $60k - 75k:| Sanford: | 0.0% (0) |
| State: | 8.6% (292,112) |
Number of households with income $75k - 100k:| Sanford: | 68.4% (13) |
| State: | 12.2% (412,198) |
Number of households with income $100k - 125k:| Sanford: | 0.0% (0) |
| State: | 10.3% (348,998) |
Number of households with income $125k - 150k:| Sanford: | 0.0% (0) |
| Virginia: | 7.7% (261,236) |
Number of households with income $150k - 200k:| Sanford: | 0.0% (0) |
| State: | 10.3% (347,282) |
Number of households with income > $200k:| Sanford: | 0.0% (0) |
| State: | 15.4% (519,712) |
Aggregate household income in Sanford in 2022: $5,906,837
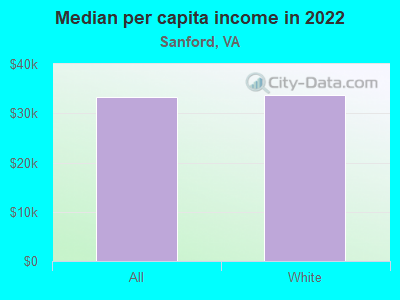
Median per capita income in Sanford in 2022:| Sanford: | $33,289 |
| Virginia: | $47,199 |
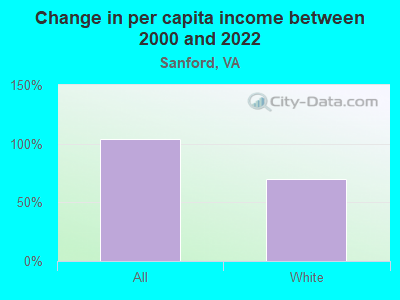
Change in median per capita income between 2000 and 2022:| Sanford, Virginia: | +104.1% |
| State: | +96.9% |
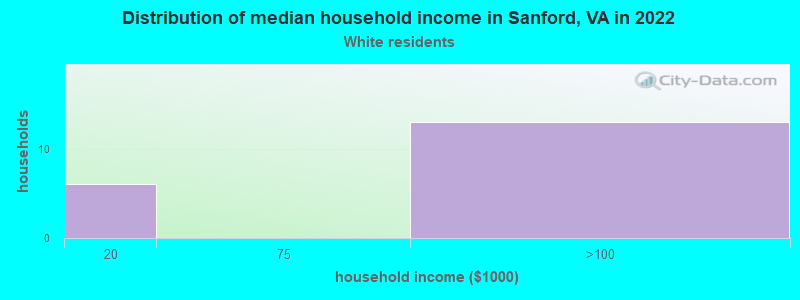
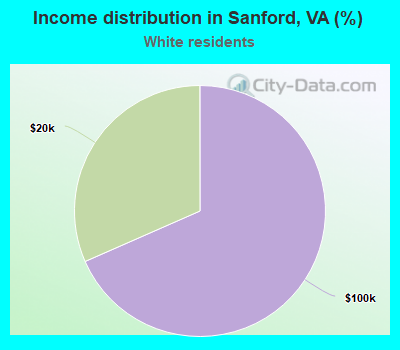
Income statistics for White residents
Number of households with income < $10k:| Sanford: | 0.0% (0) |
| State: | 4.1% (90,549) |
Number of households with income $10k - 20k:| Sanford: | 31.6% (6) |
| Virginia: | 5.2% (114,324) |
Number of households with income $20k - 30k:| Sanford: | 0.0% (0) |
| State: | 5.7% (125,676) |
Number of households with income $30k - 40k:| Sanford: | 0.0% (0) |
| State: | 5.5% (121,220) |
Number of households with income $40k - 50k:| Sanford: | 0.0% (0) |
| State: | 6.0% (133,011) |
Number of households with income $50k - 60k:| Sanford: | 0.0% (0) |
| State: | 6.2% (136,856) |
Number of households with income $60k - 75k:| Sanford: | 0.0% (0) |
| State: | 8.4% (186,094) |
Number of households with income $75k - 100k:| Sanford: | 68.4% (13) |
| State: | 12.5% (277,077) |
Number of households with income $100k - 125k:| Sanford: | 0.0% (0) |
| State: | 10.8% (237,562) |
Number of households with income $125k - 150k:| Sanford: | 0.0% (0) |
| State: | 8.0% (177,532) |
Number of households with income $150k - 200k:| Sanford: | 0.0% (0) |
| State: | 11.0% (242,106) |
Number of households with income > $200k:| Sanford: | 0.0% (0) |
| Virginia: | 16.6% (366,064) |
Aggregate household income in Sanford in 2022: $5,569,171
Median per capita income in Sanford in 2022:| Sanford: | $33,607 |
| State: | $53,456 |
Change in median per capita income between 2000 and 2022:| Sanford, Virginia: | +69.8% |
| Virginia: | +99.2% |