Shelby, New York (NY) income map, earnings map, and wages data
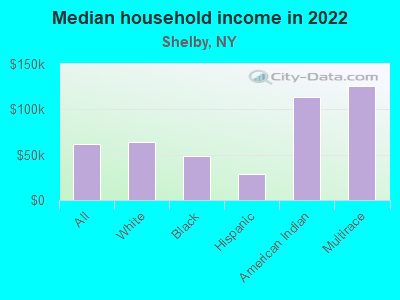
The median household income in Shelby, NY in 2022 was $62,061, which was 28.2% less than the median annual income of $79,557 across the entire state of New York. Compared to the median income of $34,091 in 2000 this represents an increase of 45.1%. The per capita income in 2022 was $34,955, which means an increase of 50.9% compared to 2000 when it was $17,154.
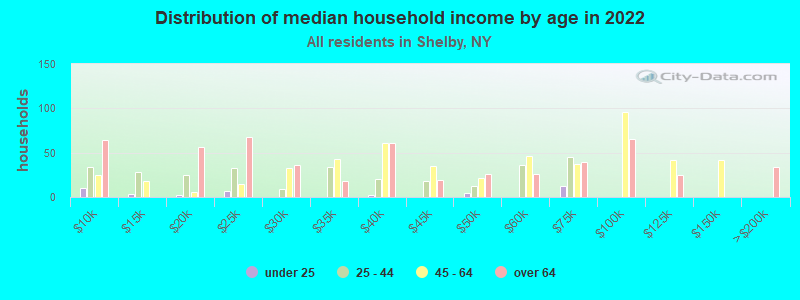
Income statistics for all residents
Median household income in Shelby, NY in 2022:| Shelby: | $62,062 |
| New York: | $79,557 |
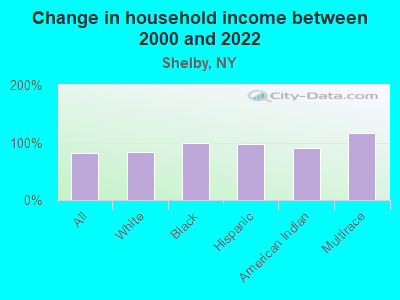
Change in median household income between 2000 and 2022:| Shelby, New York: | +82.0% |
| New York: | +83.3% |
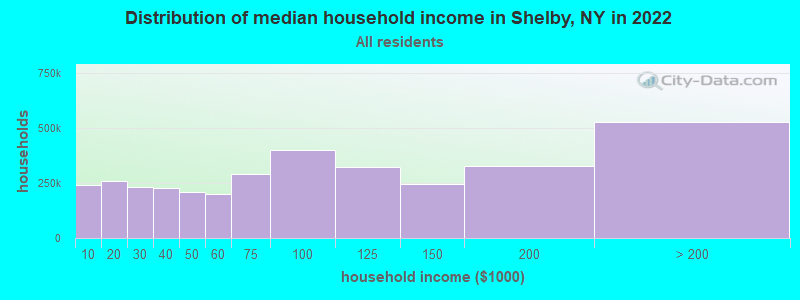
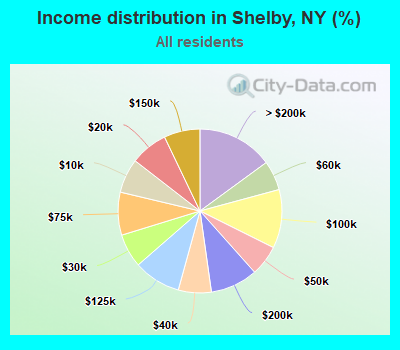
Number of households with income < $10k:| Shelby: | 6.8% (207,354) |
| New York: | 6.8% (527,598) |
Number of households with income $10k - 20k:| Shelby: | 7.4% (225,921) |
| State: | 7.4% (574,940) |
Number of households with income $20k - 30k:| Shelby: | 6.7% (203,419) |
| New York: | 6.7% (517,718) |
Number of households with income $30k - 40k:| Shelby: | 6.5% (199,064) |
| New York: | 6.5% (506,674) |
Number of households with income $40k - 50k:| Shelby: | 6.1% (184,815) |
| State: | 6.1% (470,439) |
Number of households with income $50k - 60k:| Shelby: | 5.8% (178,372) |
| State: | 5.8% (454,042) |
Number of households with income $60k - 75k:| Shelby: | 8.5% (258,299) |
| New York: | 8.5% (657,508) |
Number of households with income $75k - 100k:| Shelby: | 11.6% (353,489) |
| New York: | 11.6% (899,824) |
Number of households with income $100k - 125k:| Shelby: | 9.3% (284,355) |
| New York: | 9.3% (723,825) |
Number of households with income $125k - 150k:| Shelby: | 7.1% (217,028) |
| State: | 7.1% (552,420) |
Number of households with income $150k - 200k:| Shelby: | 9.4% (285,668) |
| State: | 9.4% (727,051) |
Number of households with income > $200k:| Shelby: | 15.0% (456,764) |
| State: | 15.0% (1,162,269) |
Aggregate household income in Shelby in 2022: $19,007,925,263
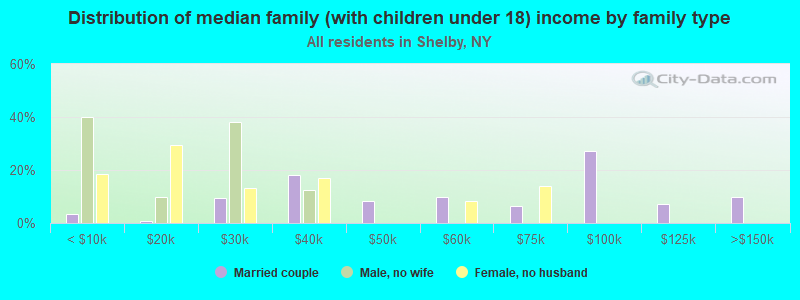
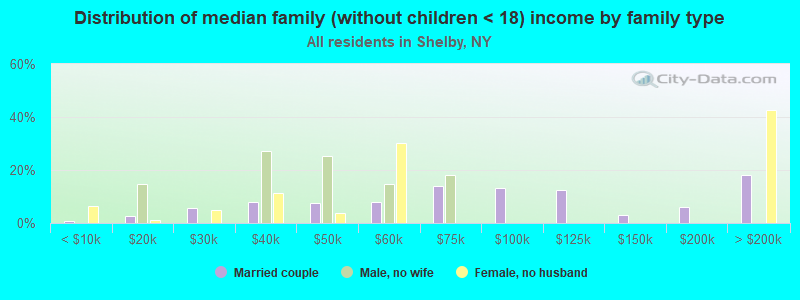
Median family income in Shelby in 2022:| Shelby: | $78,216 |
| State: | $99,066 |
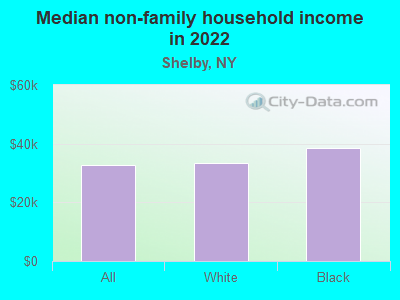
Median non-family income in Shelby in 2022:| Shelby: | $32,775 |
| State: | $50,181 |
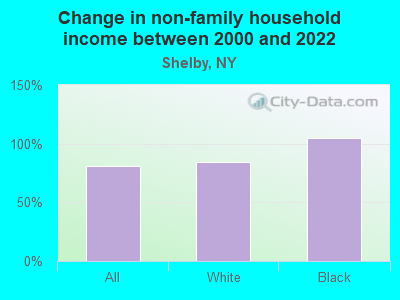
Change in median non-family income between 2000 and 2022:| Shelby, New York: | +81.3% |
| New York: | +85.4% |
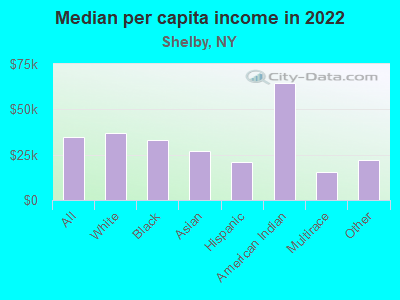
Median per capita income in Shelby in 2022:| Shelby: | $34,956 |
| New York: | $47,421 |
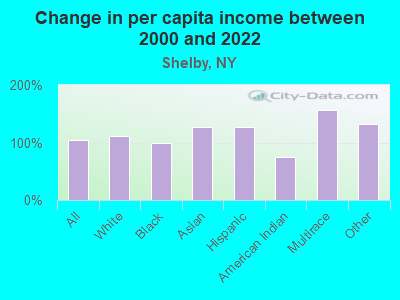
Change in median per capita income between 2000 and 2022:| Shelby, New York: | +103.8% |
| New York: | +102.7% |
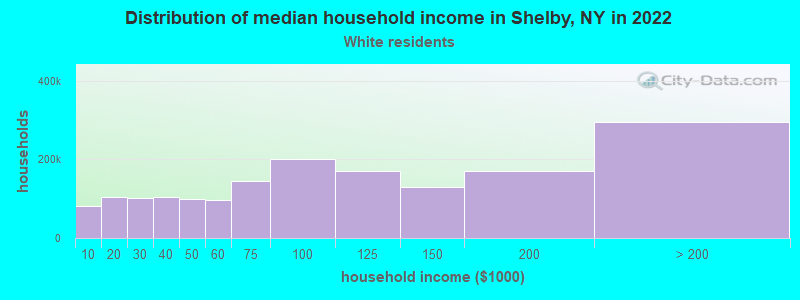
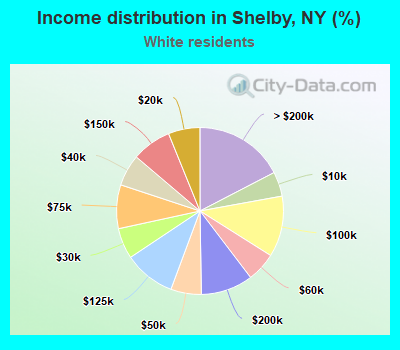
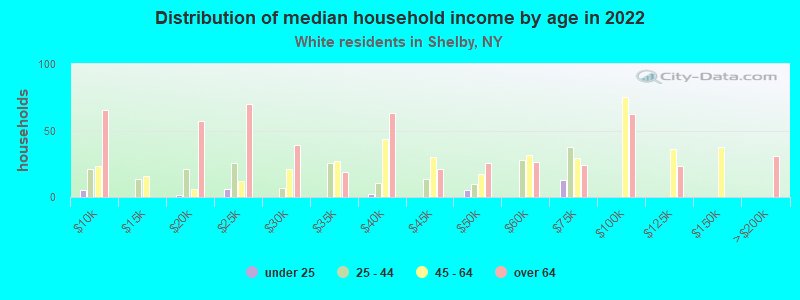
Income statistics for White residents
Median household income in Shelby, NY in 2022:| Shelby: | $63,655 |
| State: | $89,408 |
Change in median household income between 2000 and 2022:| Shelby, New York: | +83.3% |
| State: | +85.5% |
Number of households with income < $10k:| Shelby: | 4.8% (80,889) |
| New York: | 4.8% (225,550) |
Number of households with income $10k - 20k:| Shelby: | 6.1% (104,220) |
| New York: | 6.1% (289,425) |
Number of households with income $20k - 30k:| Shelby: | 6.0% (101,090) |
| New York: | 5.9% (280,254) |
Number of households with income $30k - 40k:| Shelby: | 6.1% (104,094) |
| New York: | 6.1% (288,263) |
Number of households with income $40k - 50k:| Shelby: | 5.9% (100,519) |
| State: | 5.9% (278,079) |
Number of households with income $50k - 60k:| Shelby: | 5.7% (96,770) |
| State: | 5.7% (267,554) |
Number of households with income $60k - 75k:| Shelby: | 8.5% (144,109) |
| New York: | 8.4% (398,344) |
Number of households with income $75k - 100k:| Shelby: | 11.8% (200,685) |
| New York: | 11.8% (554,841) |
Number of households with income $100k - 125k:| Shelby: | 10.0% (169,441) |
| New York: | 10.0% (469,794) |
Number of households with income $125k - 150k:| Shelby: | 7.7% (129,941) |
| New York: | 7.6% (360,467) |
Number of households with income $150k - 200k:| Shelby: | 10.1% (171,163) |
| State: | 10.1% (477,078) |
Number of households with income > $200k:| Shelby: | 17.4% (295,245) |
| New York: | 17.6% (829,233) |
Aggregate household income in Shelby in 2022: $11,926,773,074
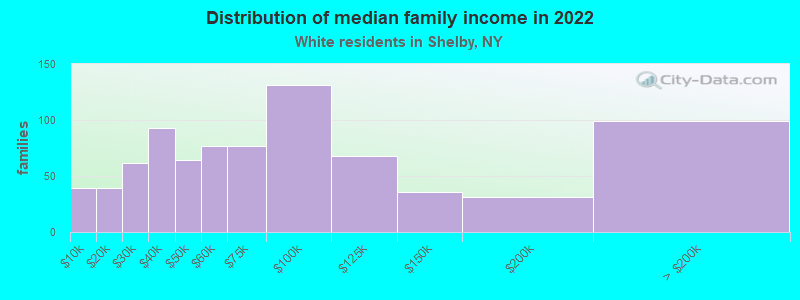
Median family income in Shelby in 2022:| Shelby: | $82,916 |
| New York: | $115,170 |
Number of families with income < $10k:| Shelby: | 4.8% (39) |
| State: | 2.5% (68,851) |
Number of families with income $10k - 20k:| Shelby: | 4.8% (39) |
| State: | 3.0% (83,127) |
Number of families with income $20k - 30k:| Shelby: | 7.6% (62) |
| New York: | 3.5% (97,578) |
Number of families with income $30k - 40k:| Shelby: | 11.4% (93) |
| New York: | 4.1% (114,108) |
Number of families with income $40k - 50k:| Shelby: | 7.8% (64) |
| State: | 4.7% (130,902) |
Number of families with income $50k - 60k:| Shelby: | 9.4% (77) |
| New York: | 4.9% (135,118) |
Number of families with income $60k - 75k:| Shelby: | 9.4% (77) |
| State: | 7.8% (216,254) |
Number of families with income $75k - 100k:| Shelby: | 16.0% (131) |
| State: | 12.4% (342,382) |
Number of families with income $100k - 125k:| Shelby: | 8.4% (68) |
| New York: | 11.4% (314,917) |
Number of families with income $125k - 150k:| Shelby: | 4.4% (36) |
| New York: | 9.4% (260,489) |
Number of families with income $150k - 200k:| Shelby: | 3.8% (31) |
| New York: | 13.2% (365,586) |
Number of families with income > $200k:| Shelby: | 12.2% (99) |
| New York: | 23.2% (642,319) |
Median non-family income in Shelby in 2022:| Shelby: | $33,246 |
| State: | $54,783 |
Change in median non-family income between 2000 and 2022:| Shelby, New York: | +83.9% |
| State: | +87.9% |
Median per capita income in Shelby in 2022:| Shelby: | $36,818 |
| State: | $57,640 |
Change in median per capita income between 2000 and 2022:| Shelby, New York: | +111.0% |
| State: | +111.6% |
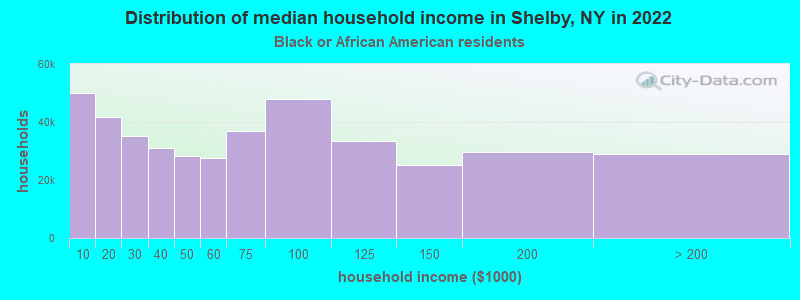
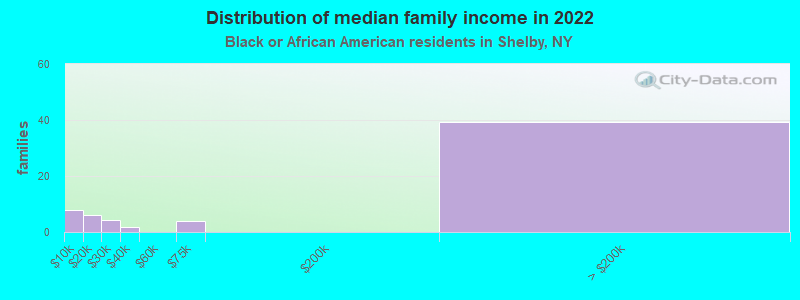
Income statistics for Black or African American residents
Median household income in Shelby, NY in 2022:| Shelby: | $48,796 |
| State: | $57,898 |
Change in median household income between 2000 and 2022:| Shelby, New York: | +100.2% |
| State: | +84.6% |
Number of households with income < $10k:| Shelby: | 12.0% (49,972) |
| State: | 12.0% (128,500) |
Number of households with income $10k - 20k:| Shelby: | 10.0% (41,780) |
| New York: | 10.0% (107,541) |
Number of households with income $20k - 30k:| Shelby: | 8.4% (35,064) |
| New York: | 8.4% (90,192) |
Number of households with income $30k - 40k:| Shelby: | 7.4% (30,904) |
| State: | 7.4% (79,579) |
Number of households with income $40k - 50k:| Shelby: | 6.8% (28,179) |
| State: | 6.8% (72,491) |
Number of households with income $50k - 60k:| Shelby: | 6.6% (27,637) |
| State: | 6.7% (71,309) |
Number of households with income $60k - 75k:| Shelby: | 8.9% (36,948) |
| New York: | 8.9% (95,050) |
Number of households with income $75k - 100k:| Shelby: | 11.5% (47,939) |
| New York: | 11.5% (123,569) |
Number of households with income $100k - 125k:| Shelby: | 8.1% (33,561) |
| State: | 8.1% (86,632) |
Number of households with income $125k - 150k:| Shelby: | 6.1% (25,179) |
| State: | 6.0% (64,788) |
Number of households with income $150k - 200k:| Shelby: | 7.1% (29,710) |
| State: | 7.2% (76,644) |
Number of households with income > $200k:| Shelby: | 7.0% (29,014) |
| New York: | 7.0% (75,062) |
Aggregate household income in Shelby in 2022: $77,422,520
Median family income in Shelby in 2022:| Shelby: | $46,648 |
| State: | $72,528 |
Number of families with income < $10k:| Shelby: | 12.6% (8) |
| New York: | 8.6% (54,100) |
Number of families with income $10k - 20k:| Shelby: | 9.3% (6) |
| State: | 6.6% (41,506) |
Number of families with income $20k - 30k:| Shelby: | 6.8% (4) |
| State: | 7.0% (44,139) |
Number of families with income $30k - 40k:| Shelby: | 3.0% (2) |
| State: | 6.9% (43,353) |
Number of families with income $60k - 75k:| Shelby: | 6.0% (4) |
| State: | 9.2% (57,626) |
Number of families with income > $200k:| Shelby: | 62.3% (39) |
| State: | 9.3% (58,575) |
Median non-family income in Shelby in 2022:| Shelby: | $38,369 |
| State: | $37,265 |
Change in median non-family income between 2000 and 2022:| Shelby, New York: | +104.6% |
| New York: | +81.7% |
Median per capita income in Shelby in 2022:| Shelby: | $32,907 |
| State: | $31,947 |
Change in median per capita income between 2000 and 2022:| Shelby, New York: | +99.4% |
| State: | +106.1% |
Income statistics for Asian residents
Number of households with income < $10k:| Shelby: | 6.9% (12,412) |
| State: | 6.9% (42,537) |
Number of households with income $10k - 20k:| Shelby: | 7.3% (13,058) |
| New York: | 7.3% (44,745) |
Number of households with income $20k - 30k:| Shelby: | 6.2% (11,175) |
| State: | 6.2% (38,249) |
Number of households with income $30k - 40k:| Shelby: | 5.5% (9,919) |
| New York: | 5.5% (33,993) |
Number of households with income $40k - 50k:| Shelby: | 4.9% (8,702) |
| State: | 4.8% (29,795) |
Number of households with income $50k - 60k:| Shelby: | 5.2% (9,331) |
| New York: | 5.2% (32,100) |
Number of households with income $60k - 75k:| Shelby: | 7.3% (13,014) |
| State: | 7.3% (44,615) |
Number of households with income $75k - 100k:| Shelby: | 10.9% (19,456) |
| State: | 10.8% (66,687) |
Number of households with income $100k - 125k:| Shelby: | 8.2% (14,631) |
| State: | 8.2% (50,233) |
Number of households with income $125k - 150k:| Shelby: | 7.2% (12,919) |
| New York: | 7.2% (44,299) |
Number of households with income $150k - 200k:| Shelby: | 10.4% (18,598) |
| State: | 10.4% (63,837) |
Number of households with income > $200k:| Shelby: | 20.1% (36,092) |
| State: | 20.1% (123,891) |
Median per capita income in Shelby in 2022:| Shelby: | $27,234 |
| State: | $46,726 |
Change in median per capita income between 2000 and 2022:| Shelby, New York: | +126.5% |
| New York: | +126.6% |
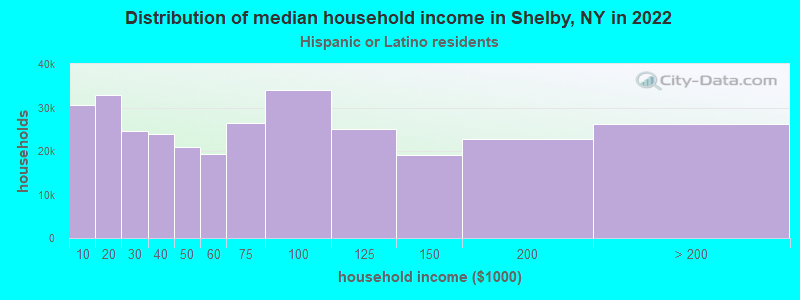
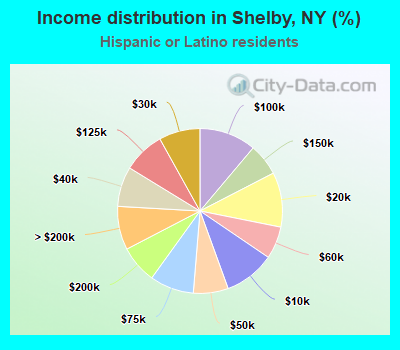
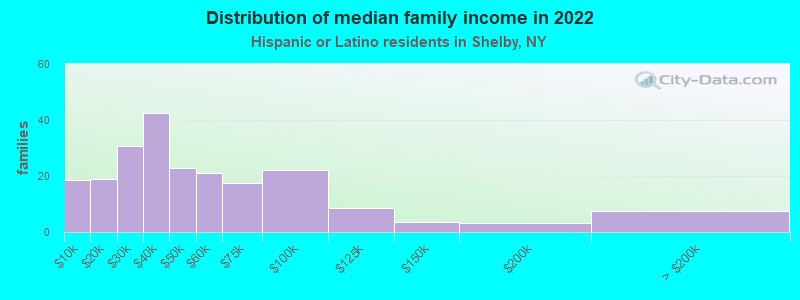
Income statistics for Hispanic or Latino residents
Median household income in Shelby, NY in 2022:| Shelby: | $28,746 |
| State: | $60,468 |
Change in median household income between 2000 and 2022:| Shelby, New York: | +96.6% |
| State: | +98.3% |
Number of households with income < $10k:| Shelby: | 10.0% (30,474) |
| New York: | 9.9% (127,185) |
Number of households with income $10k - 20k:| Shelby: | 10.7% (32,804) |
| New York: | 10.7% (136,699) |
Number of households with income $20k - 30k:| Shelby: | 8.1% (24,701) |
| State: | 8.1% (102,991) |
Number of households with income $30k - 40k:| Shelby: | 7.8% (23,926) |
| New York: | 7.8% (100,149) |
Number of households with income $40k - 50k:| Shelby: | 6.8% (20,934) |
| State: | 6.9% (87,760) |
Number of households with income $50k - 60k:| Shelby: | 6.3% (19,385) |
| State: | 6.3% (80,968) |
Number of households with income $60k - 75k:| Shelby: | 8.6% (26,422) |
| State: | 8.7% (110,631) |
Number of households with income $75k - 100k:| Shelby: | 11.2% (34,105) |
| State: | 11.2% (142,787) |
Number of households with income $100k - 125k:| Shelby: | 8.2% (24,992) |
| State: | 8.2% (104,850) |
Number of households with income $125k - 150k:| Shelby: | 6.3% (19,175) |
| New York: | 6.3% (80,274) |
Number of households with income $150k - 200k:| Shelby: | 7.4% (22,668) |
| New York: | 7.4% (95,117) |
Number of households with income > $200k:| Shelby: | 8.6% (26,143) |
| State: | 8.6% (109,514) |
Aggregate household income in Shelby in 2022: $36,422,141
Median family income in Shelby in 2022:| Shelby: | $31,014 |
| State: | $68,770 |
Number of families with income < $10k:| Shelby: | 8.5% (18) |
| New York: | 6.9% (58,565) |
Number of families with income $10k - 20k:| Shelby: | 8.8% (19) |
| State: | 7.0% (59,058) |
Number of families with income $20k - 30k:| Shelby: | 14.1% (31) |
| State: | 8.0% (68,048) |
Number of families with income $30k - 40k:| Shelby: | 19.6% (43) |
| State: | 8.4% (70,668) |
Number of families with income $40k - 50k:| Shelby: | 10.5% (23) |
| New York: | 7.4% (62,941) |
Number of families with income $50k - 60k:| Shelby: | 9.8% (21) |
| State: | 6.6% (55,592) |
Number of families with income $60k - 75k:| Shelby: | 8.1% (18) |
| State: | 9.3% (78,564) |
Number of families with income $75k - 100k:| Shelby: | 10.2% (22) |
| State: | 12.6% (106,685) |
Number of families with income $100k - 125k:| Shelby: | 3.9% (9) |
| State: | 9.4% (79,139) |
Number of families with income $125k - 150k:| Shelby: | 1.7% (4) |
| State: | 6.9% (58,255) |
Number of families with income $150k - 200k:| Shelby: | 1.4% (3) |
| State: | 8.3% (69,877) |
Number of families with income > $200k:| Shelby: | 3.4% (7) |
| State: | 9.3% (78,555) |
Median per capita income in Shelby in 2022:| Shelby: | $21,046 |
| State: | $29,761 |
Change in median per capita income between 2000 and 2022:| Shelby, New York: | +127.3% |
| New York: | +132.7% |
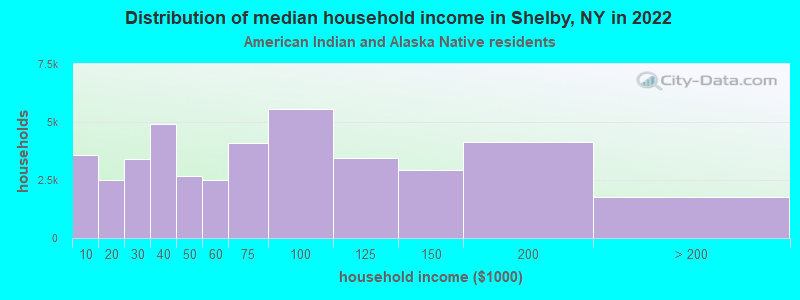
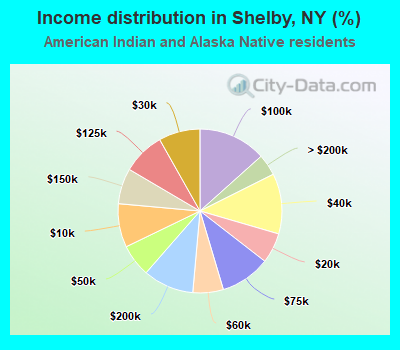
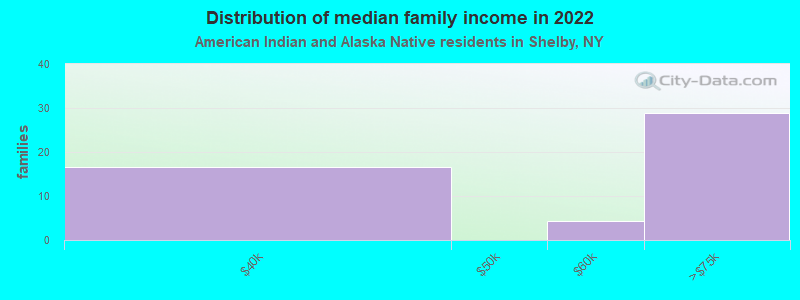
Income statistics for American Indian and Alaska Native residents
Median household income in Shelby, NY in 2022:| Shelby: | $113,892 |
| State: | $63,208 |
Change in median household income between 2000 and 2022:| Shelby, New York: | +90.5% |
| State: | +110.1% |
Number of households with income < $10k:| Shelby: | 8.6% (3,570) |
| State: | 8.6% (3,559) |
Number of households with income $10k - 20k:| Shelby: | 6.0% (2,479) |
| State: | 5.9% (2,455) |
Number of households with income $20k - 30k:| Shelby: | 8.2% (3,389) |
| State: | 8.2% (3,393) |
Number of households with income $30k - 40k:| Shelby: | 11.9% (4,935) |
| State: | 11.9% (4,918) |
Number of households with income $40k - 50k:| Shelby: | 6.4% (2,651) |
| State: | 6.5% (2,682) |
Number of households with income $50k - 60k:| Shelby: | 6.0% (2,495) |
| State: | 6.1% (2,516) |
Number of households with income $60k - 75k:| Shelby: | 9.9% (4,101) |
| New York: | 10.0% (4,125) |
Number of households with income $75k - 100k:| Shelby: | 13.4% (5,546) |
| State: | 13.3% (5,517) |
Number of households with income $100k - 125k:| Shelby: | 8.4% (3,462) |
| State: | 8.4% (3,463) |
Number of households with income $125k - 150k:| Shelby: | 7.0% (2,911) |
| State: | 7.0% (2,887) |
Number of households with income $150k - 200k:| Shelby: | 10.0% (4,148) |
| State: | 9.9% (4,106) |
Number of households with income > $200k:| Shelby: | 4.2% (1,753) |
| State: | 4.2% (1,744) |
Aggregate household income in Shelby in 2022: $3,776,600
Median family income in Shelby in 2022:| Shelby: | $120,934 |
| New York: | $69,721 |
Number of families with income $30k - 40k:| Shelby: | 33.3% (17) |
| New York: | 12.0% (3,480) |
Number of families with income $50k - 60k:| Shelby: | 8.6% (4) |
| New York: | 3.4% (985) |
Number of families with income $60k - 75k:| Shelby: | 58.1% (29) |
| State: | 11.8% (3,425) |
Median per capita income in Shelby in 2022:| Shelby: | $64,674 |
| New York: | $25,837 |
Change in median per capita income between 2000 and 2022:| Shelby, New York: | +75.0% |
| State: | +99.6% |
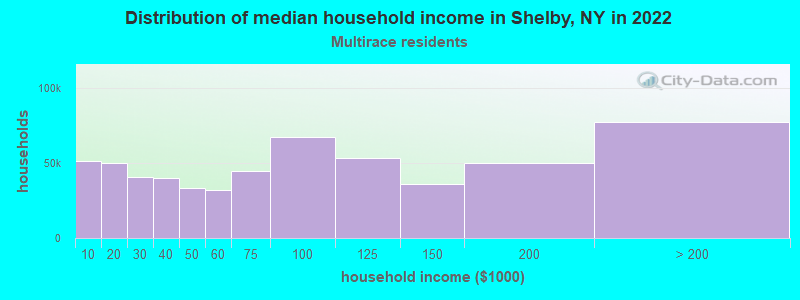
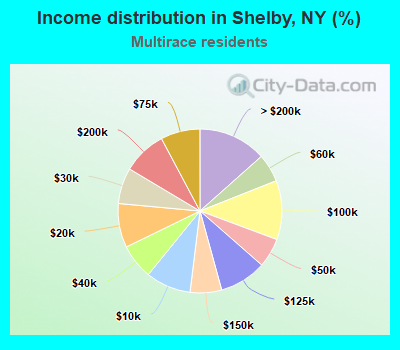
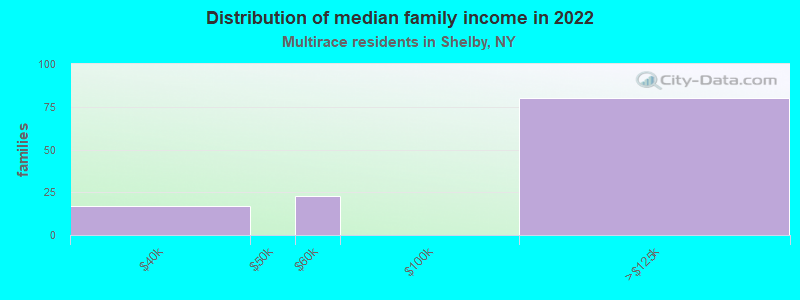
Income statistics for Multirace residents
Median household income in Shelby, NY in 2022:| Shelby: | $126,060 |
| State: | $73,557 |
Change in median household income between 2000 and 2022:| Shelby, New York: | +116.5% |
| State: | +123.9% |
Number of households with income < $10k:| Shelby: | 8.9% (51,385) |
| State: | 8.9% (57,924) |
Number of households with income $10k - 20k:| Shelby: | 8.7% (50,114) |
| State: | 8.7% (56,590) |
Number of households with income $20k - 30k:| Shelby: | 7.1% (40,963) |
| New York: | 7.1% (46,287) |
Number of households with income $30k - 40k:| Shelby: | 6.9% (39,900) |
| New York: | 6.9% (45,132) |
Number of households with income $40k - 50k:| Shelby: | 5.8% (33,482) |
| State: | 5.8% (37,946) |
Number of households with income $50k - 60k:| Shelby: | 5.6% (32,169) |
| State: | 5.6% (36,410) |
Number of households with income $60k - 75k:| Shelby: | 7.8% (44,873) |
| State: | 7.8% (50,819) |
Number of households with income $75k - 100k:| Shelby: | 11.7% (67,242) |
| State: | 11.7% (76,024) |
Number of households with income $100k - 125k:| Shelby: | 9.3% (53,508) |
| State: | 9.3% (60,635) |
Number of households with income $125k - 150k:| Shelby: | 6.2% (35,853) |
| New York: | 6.2% (40,533) |
Number of households with income $150k - 200k:| Shelby: | 8.6% (49,874) |
| State: | 8.6% (56,409) |
Number of households with income > $200k:| Shelby: | 13.4% (77,429) |
| State: | 13.4% (87,442) |
Aggregate household income in Shelby in 2022: $27,402,827
Median family income in Shelby in 2022:| Shelby: | $135,976 |
| State: | $85,788 |
Number of families with income $30k - 40k:| Shelby: | 14.3% (17) |
| New York: | 6.5% (26,239) |
Number of families with income $50k - 60k:| Shelby: | 19.0% (23) |
| New York: | 5.5% (22,002) |
Number of families with income $100k - 125k:| Shelby: | 66.7% (80) |
| State: | 10.7% (43,036) |
Median per capita income in Shelby in 2022:| Shelby: | $15,396 |
| New York: | $36,931 |
Income statistics for other residents
Number of households with income < $10k:| Shelby: | 12.0% (3) |
| State: | 10.3% (69,252) |
Number of households with income $10k - 20k:| Shelby: | 12.0% (3) |
| State: | 11.0% (73,890) |
Number of households with income $20k - 30k:| Shelby: | 8.0% (2) |
| New York: | 8.8% (59,096) |
Number of households with income $30k - 40k:| Shelby: | 8.0% (2) |
| State: | 8.1% (54,418) |
Number of households with income $40k - 50k:| Shelby: | 8.0% (2) |
| State: | 7.3% (49,042) |
Number of households with income $50k - 60k:| Shelby: | 4.0% (1) |
| State: | 6.5% (43,945) |
Number of households with income $60k - 75k:| Shelby: | 8.0% (2) |
| State: | 9.5% (64,087) |
Number of households with income $75k - 100k:| Shelby: | 12.0% (3) |
| State: | 10.9% (73,094) |
Number of households with income $100k - 125k:| Shelby: | 8.0% (2) |
| State: | 7.9% (53,055) |
Number of households with income $125k - 150k:| Shelby: | 4.0% (1) |
| State: | 5.9% (39,446) |
Number of households with income $150k - 200k:| Shelby: | 8.0% (2) |
| New York: | 7.2% (48,653) |
Number of households with income > $200k:| Shelby: | 8.0% (2) |
| State: | 6.6% (44,703) |
Aggregate household income in Shelby in 2022: $2,263,020
Median family income in Shelby in 2022:| Shelby: | $32,457 |
| State: | $63,465 |
Number of families with income $10k - 20k:| Shelby: | 100.0% (19) |
| State: | 7.4% (34,598) |
Median per capita income in Shelby in 2022:| Shelby: | $21,974 |
| State: | $26,975 |
Change in median per capita income between 2000 and 2022:| Shelby, New York: | +132.7% |
| State: | +144.6% |