The median household income in Siesta Shores, TX in 2022 was $34,375, which was 110.3% less than the median annual income of $72,284 across the entire state of Texas. Compared to the median income of $24,808 in 2000 this represents an increase of 27.8%. The per capita income in 2022 was $12,321, which means an increase of 6.8% compared to 2000 when it was $11,484.
Whole page based on the data from 2000 / 2022 when the population of Siesta Shores, Texas was 890 / 1,663
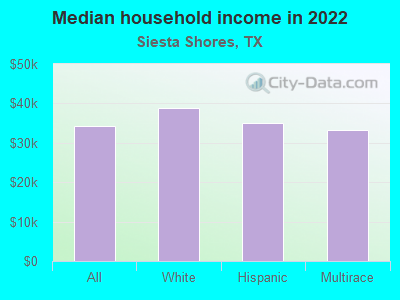
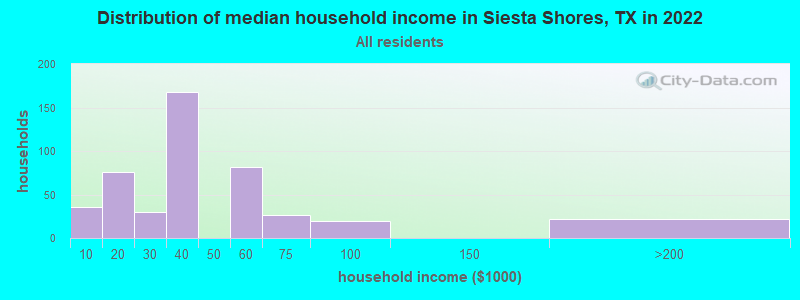
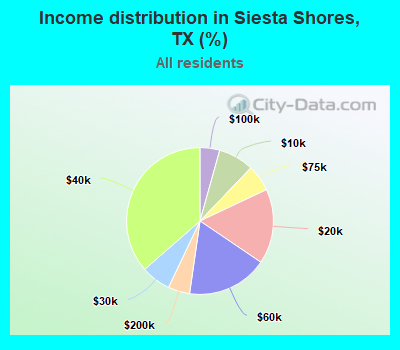
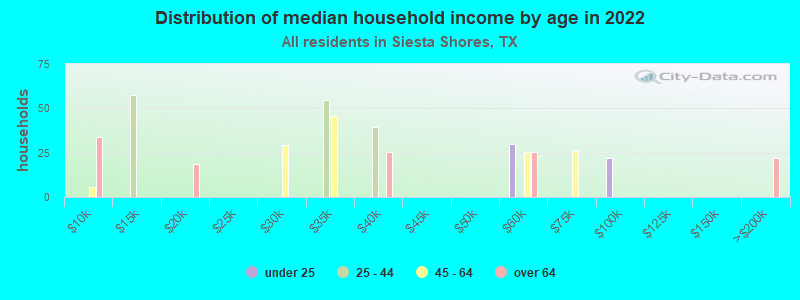
Income statistics for all residents
Median household income in Siesta Shores, TX in 2022:
Siesta Shores:
$34,376
State:
$72,284
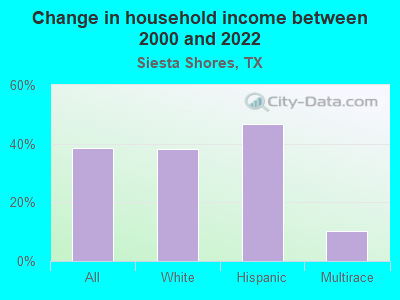
Change in median household income between 2000 and 2022:
Siesta Shores, Texas:
+38.6%
Texas:
+81.0%
Number of households with income < $10k:
Siesta Shores:
7.8% (36)
Texas:
5.5% (611,011)
Number of households with income $10k - 20k:
Siesta Shores:
16.5% (76)
Texas:
6.7% (743,157)
Number of households with income $20k - 30k:
Siesta Shores:
6.5% (30)
State:
7.2% (803,381)
Number of households with income $30k - 40k:
Siesta Shores:
36.4% (168)
State:
7.8% (866,080)
Number of households with income $40k - 50k:
Siesta Shores:
0.0% (0)
State:
7.3% (810,440)
Number of households with income $50k - 60k:
Siesta Shores:
17.8% (82)
State:
7.2% (799,783)
Number of households with income $60k - 75k:
Siesta Shores:
5.9% (27)
State:
9.9% (1,095,384)
Number of households with income $75k - 100k:
Siesta Shores:
4.3% (20)
State:
12.8% (1,419,057)
Number of households with income $100k - 125k:
Siesta Shores:
0.0% (0)
Texas:
9.5% (1,054,577)
Number of households with income $125k - 150k:
Siesta Shores:
0.0% (0)
Texas:
6.7% (741,518)
Number of households with income $150k - 200k:
Siesta Shores:
4.8% (22)
State:
8.7% (961,776)
Number of households with income > $200k:
Siesta Shores:
0.0% (0)
Texas:
10.7% (1,181,544)
Aggregate household income in Siesta Shores in 2022: $19,039,585
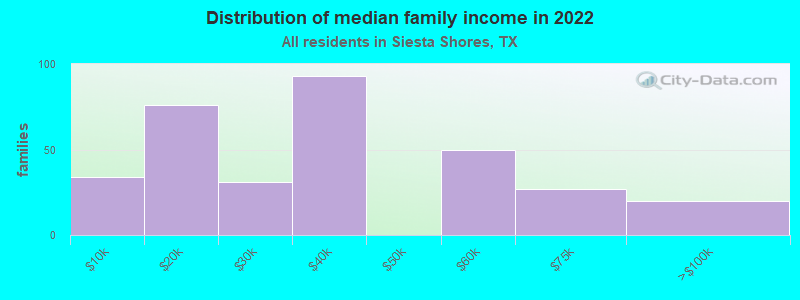
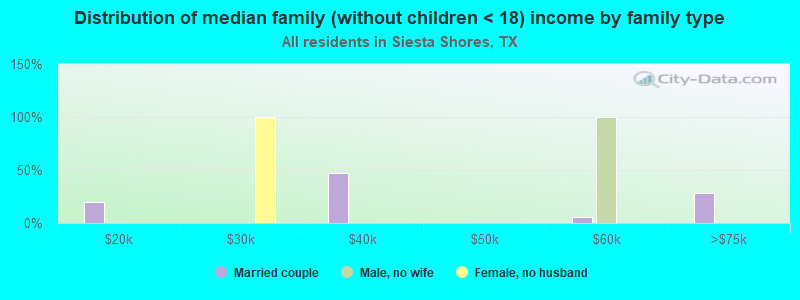
Median family income in Siesta Shores in 2022:
Siesta Shores:
$33,239
State:
$86,267
Number of families with income < $10k:
Siesta Shores:
10.3% (34)
State:
4.0% (297,884)
Number of families with income $10k - 20k:
Siesta Shores:
23.0% (76)
State:
4.3% (324,514)
Number of families with income $20k - 30k:
Siesta Shores:
9.3% (31)
Texas:
5.8% (430,949)
Number of families with income $30k - 40k:
Siesta Shores:
28.2% (93)
Texas:
6.6% (493,535)
Number of families with income $50k - 60k:
Siesta Shores:
15.0% (50)
Texas:
6.6% (492,203)
Number of families with income $60k - 75k:
Siesta Shores:
8.1% (27)
State:
9.5% (710,229)
Number of families with income $75k - 100k:
Siesta Shores:
6.1% (20)
State:
13.6% (1,015,480)
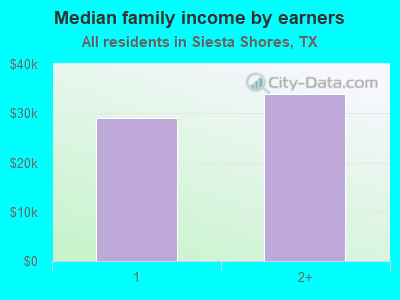
Median income for 3 person families:
Siesta Shores:
$37,777
State:
$86,290
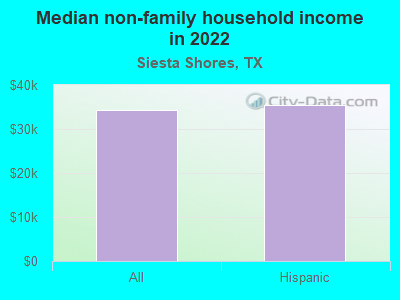
Median non-family income in Siesta Shores in 2022:
Siesta Shores:
$34,420
Texas:
$45,999
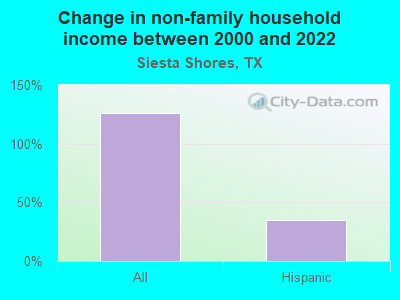
Change in median non-family income between 2000 and 2022:
Siesta Shores, Texas:
+125.7%
State:
+79.5%
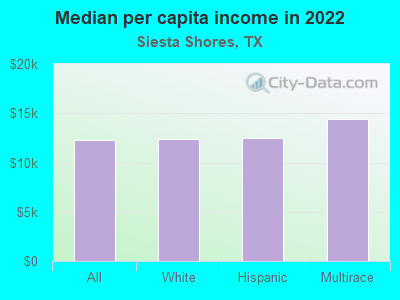
Median per capita income in Siesta Shores in 2022:
Siesta Shores:
$12,322
Texas:
$38,123
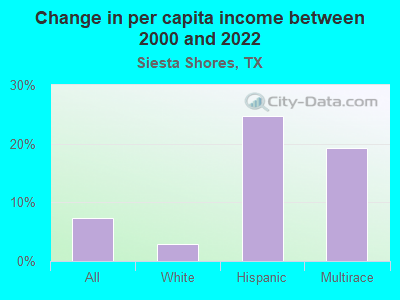
Change in median per capita income between 2000 and 2022:
Siesta Shores, Texas:
+7.3%
State:
+94.3%
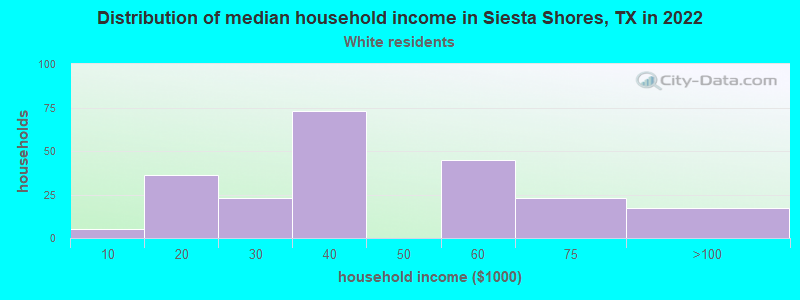
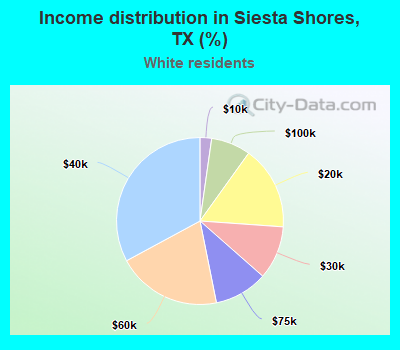
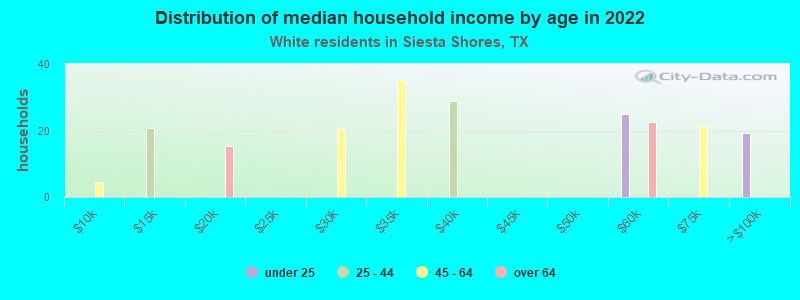
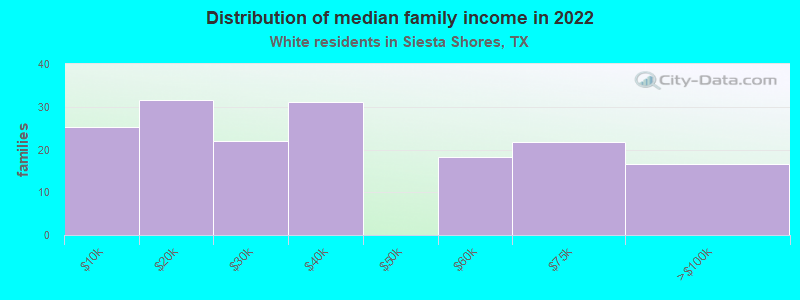
Income statistics for White residents
Median household income in Siesta Shores, TX in 2022:
Siesta Shores:
$38,868
Texas:
$82,032
Change in median household income between 2000 and 2022:
Siesta Shores, Texas:
+38.2%
State:
+91.0%
Number of households with income < $10k:
Siesta Shores:
2.3% (5)
State:
4.7% (273,716)
Number of households with income $10k - 20k:
Siesta Shores:
16.2% (36)
State:
5.5% (322,702)
Number of households with income $20k - 30k:
Siesta Shores:
10.4% (23)
Texas:
6.2% (363,947)
Number of households with income $30k - 40k:
Siesta Shores:
32.9% (73)
State:
6.8% (399,275)
Number of households with income $40k - 50k:
Siesta Shores:
0.0% (0)
State:
6.5% (383,417)
Number of households with income $50k - 60k:
Siesta Shores:
20.3% (45)
State:
6.6% (388,535)
Number of households with income $60k - 75k:
Siesta Shores:
10.4% (23)
State:
9.7% (566,295)
Number of households with income $75k - 100k:
Siesta Shores:
7.7% (17)
State:
13.0% (760,276)
Number of households with income $100k - 125k:
Siesta Shores:
0.0% (0)
Texas:
10.2% (597,596)
Number of households with income $125k - 150k:
Siesta Shores:
0.0% (0)
State:
7.4% (436,830)
Number of households with income $150k - 200k:
Siesta Shores:
0.0% (0)
State:
9.9% (583,067)
Number of households with income > $200k:
Siesta Shores:
0.0% (0)
State:
13.5% (792,647)
Aggregate household income in Siesta Shores in 2022: $9,874,590
Median family income in Siesta Shores in 2022:
Siesta Shores:
$39,420
Texas:
$101,788
Number of families with income < $10k:
Siesta Shores:
15.1% (25)
State:
2.8% (108,142)
Number of families with income $10k - 20k:
Siesta Shores:
19.0% (32)
Texas:
2.9% (113,421)
Number of families with income $20k - 30k:
Siesta Shores:
13.2% (22)
State:
4.1% (157,688)
Number of families with income $30k - 40k:
Siesta Shores:
18.7% (31)
State:
5.2% (198,847)
Number of families with income $50k - 60k:
Siesta Shores:
10.9% (18)
Texas:
5.7% (220,689)
Number of families with income $60k - 75k:
Siesta Shores:
13.0% (22)
Texas:
9.0% (346,106)
Number of families with income $75k - 100k:
Siesta Shores:
10.0% (17)
State:
13.7% (527,363)
Median per capita income in Siesta Shores in 2022:
Siesta Shores:
$12,414
Texas:
$47,740
Change in median per capita income between 2000 and 2022:
Siesta Shores, Texas:
+2.9%
Texas:
+114.3%
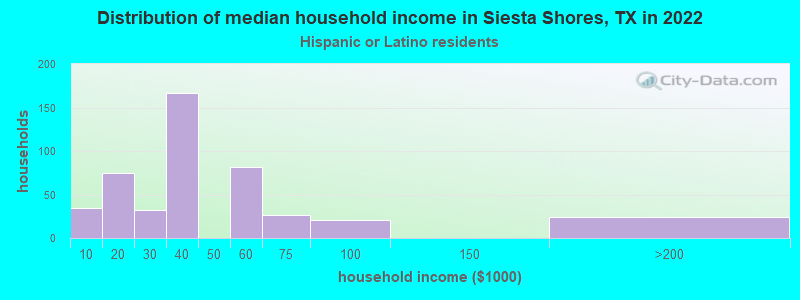
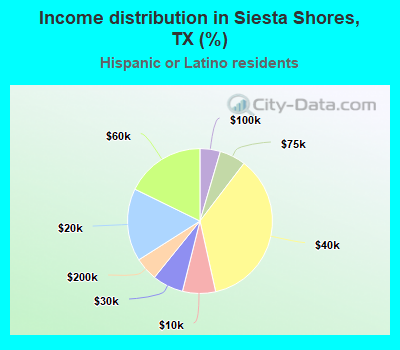
Income statistics for Hispanic or Latino residents
Median household income in Siesta Shores, TX in 2022:
Siesta Shores:
$35,049
State:
$60,504
Change in median household income between 2000 and 2022:
Siesta Shores, Texas:
+46.7%
State:
+102.5%
Number of households with income < $10k:
Siesta Shores:
7.4% (34)
Texas:
5.8% (213,953)
Number of households with income $10k - 20k:
Siesta Shores:
16.2% (75)
Texas:
8.0% (297,456)
Number of households with income $20k - 30k:
Siesta Shores:
6.9% (32)
Texas:
9.2% (340,166)
Number of households with income $30k - 40k:
Siesta Shores:
36.1% (167)
State:
9.5% (354,336)
Number of households with income $40k - 50k:
Siesta Shores:
0.0% (0)
State:
8.8% (327,013)
Number of households with income $50k - 60k:
Siesta Shores:
17.7% (82)
State:
8.3% (308,818)
Number of households with income $60k - 75k:
Siesta Shores:
5.8% (27)
State:
10.9% (405,109)
Number of households with income $75k - 100k:
Siesta Shores:
4.5% (21)
State:
13.8% (511,639)
Number of households with income $100k - 125k:
Siesta Shores:
0.0% (0)
Texas:
8.6% (319,728)
Number of households with income $125k - 150k:
Siesta Shores:
0.0% (0)
State:
5.7% (210,932)
Number of households with income $150k - 200k:
Siesta Shores:
5.2% (24)
Texas:
6.4% (236,055)
Number of households with income > $200k:
Siesta Shores:
0.0% (0)
State:
5.1% (189,259)
Aggregate household income in Siesta Shores in 2022: $19,579,235
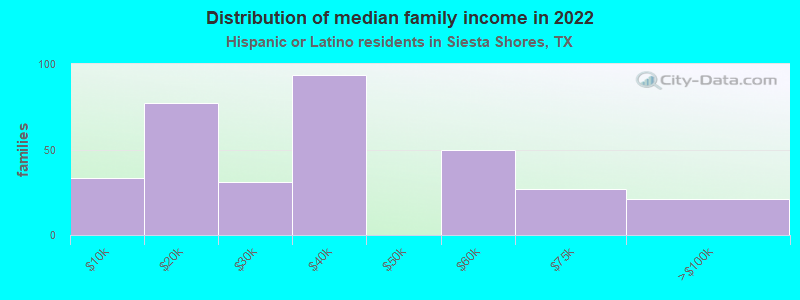
Median family income in Siesta Shores in 2022:
Siesta Shores:
$33,842
Texas:
$65,080
Number of families with income < $10k:
Siesta Shores:
10.0% (33)
Texas:
5.3% (147,493)
Number of families with income $10k - 20k:
Siesta Shores:
23.2% (77)
State:
6.3% (174,531)
Number of families with income $20k - 30k:
Siesta Shores:
9.4% (31)
Texas:
8.6% (238,528)
Number of families with income $30k - 40k:
Siesta Shores:
28.1% (94)
State:
9.1% (251,999)
Number of families with income $50k - 60k:
Siesta Shores:
14.9% (50)
State:
8.0% (223,566)
Number of families with income $60k - 75k:
Siesta Shores:
8.1% (27)
State:
10.9% (302,688)
Number of families with income $75k - 100k:
Siesta Shores:
6.3% (21)
State:
14.3% (398,554)
Median non-family income in Siesta Shores in 2022:
Siesta Shores:
$35,502
State:
$39,934
Change in median non-family income between 2000 and 2022:
Siesta Shores, Texas:
+35.2%
Texas:
+109.1%
Median per capita income in Siesta Shores in 2022:
Siesta Shores:
$12,465
Texas:
$24,862
Change in median per capita income between 2000 and 2022:
Siesta Shores, Texas:
+24.6%
State:
+130.8%
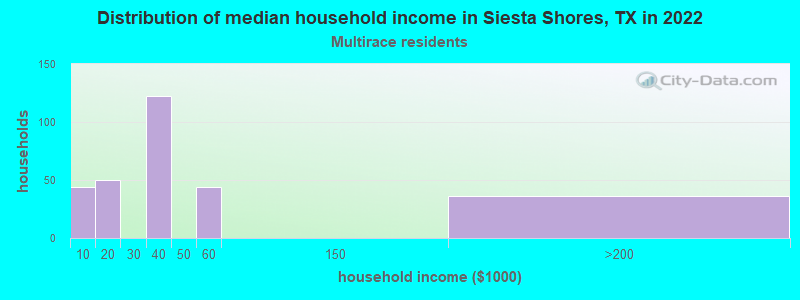
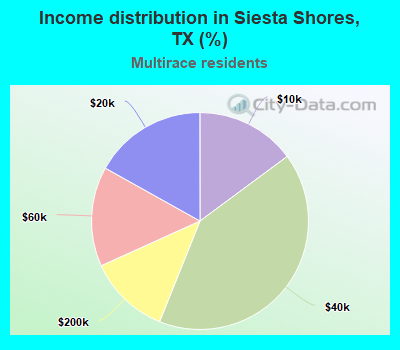
Income statistics for Multirace residents
Median household income in Siesta Shores, TX in 2022:
Siesta Shores:
$33,255
Texas:
$62,748
Change in median household income between 2000 and 2022:
Siesta Shores, Texas:
+10.1%
State:
+92.3%
Number of households with income < $10k:
Siesta Shores:
14.9% (44)
State:
5.5% (122,324)
Number of households with income $10k - 20k:
Siesta Shores:
16.9% (50)
State:
8.2% (182,232)
Number of households with income $20k - 30k:
Siesta Shores:
0.0% (0)
State:
8.5% (189,456)
Number of households with income $30k - 40k:
Siesta Shores:
41.2% (122)
Texas:
8.9% (197,499)
Number of households with income $40k - 50k:
Siesta Shores:
0.0% (0)
State:
8.7% (191,735)
Number of households with income $50k - 60k:
Siesta Shores:
14.9% (44)
Texas:
8.0% (177,535)
Number of households with income $60k - 75k:
Siesta Shores:
0.0% (0)
State:
10.5% (232,479)
Number of households with income $75k - 100k:
Siesta Shores:
0.0% (0)
State:
13.1% (290,448)
Number of households with income $100k - 125k:
Siesta Shores:
0.0% (0)
State:
8.6% (191,595)
Number of households with income $125k - 150k:
Siesta Shores:
0.0% (0)
State:
6.0% (133,361)
Number of households with income $150k - 200k:
Siesta Shores:
12.2% (36)
Texas:
7.2% (159,195)
Number of households with income > $200k:
Siesta Shores:
0.0% (0)
State:
6.7% (148,064)
Aggregate household income in Siesta Shores in 2022: $12,535,105
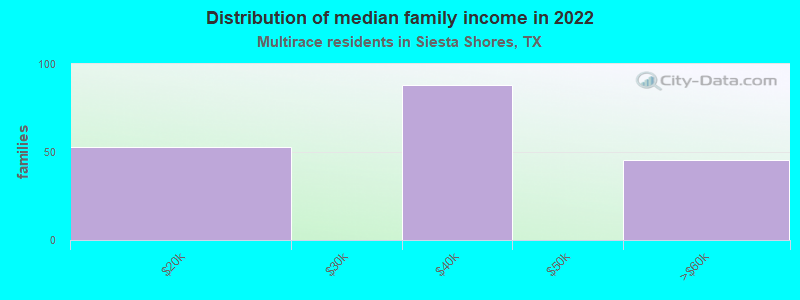
Median family income in Siesta Shores in 2022:
Siesta Shores:
$32,726
State:
$69,780
Number of families with income $10k - 20k:
Siesta Shores:
28.5% (53)
Texas:
5.9% (95,279)
Number of families with income $30k - 40k:
Siesta Shores:
47.2% (88)
State:
8.5% (137,626)
Number of families with income $50k - 60k:
Siesta Shores:
24.3% (45)
State:
7.9% (127,739)
Median per capita income in Siesta Shores in 2022:
Siesta Shores:
$14,380
Texas:
$26,785
Change in median per capita income between 2000 and 2022:
Siesta Shores, Texas:
+19.2%
Texas:
+110.9%
Discuss Siesta Shores, Texas (TX) on our hugely popular Texas forum.