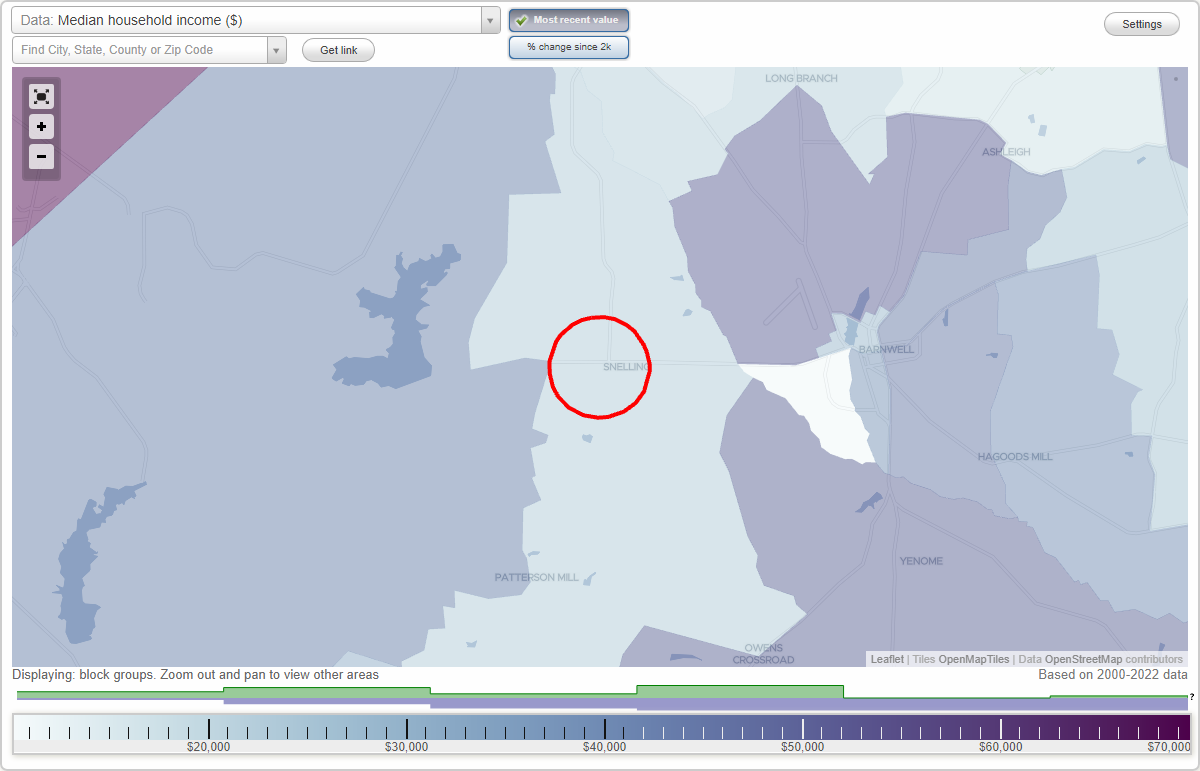
The median household income in Snelling, SC in 2022 was $57,044, which was 12.4% less than the median annual income of $64,115 across the entire state of South Carolina. Compared to the median income of $35,313 in 2000 this represents an increase of 38.1%. The per capita income in 2022 was $32,864, which means an increase of 59.2% compared to 2000 when it was $13,420.
Whole page based on the data from 2000 / 2022 when the population of Snelling, South Carolina was 246 / 269
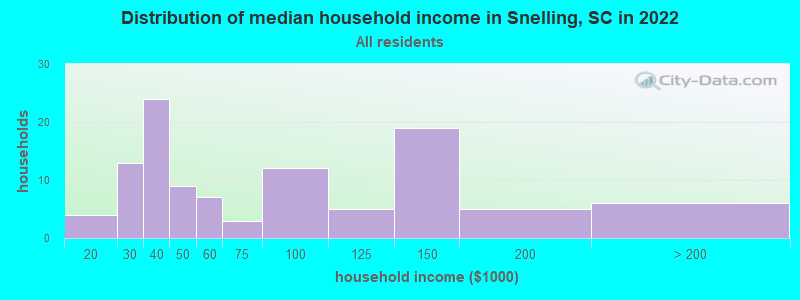
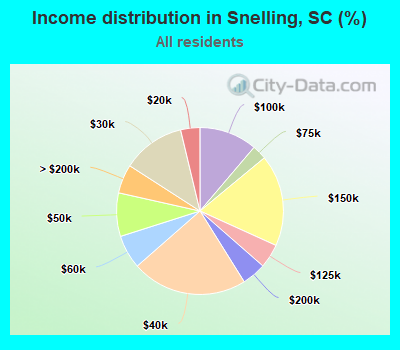
Income statistics for all residents
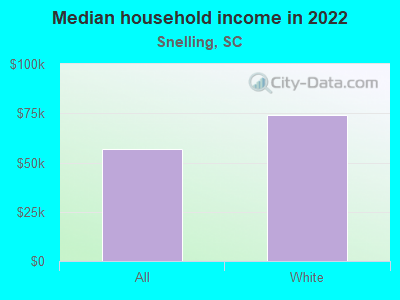
Median household income in Snelling, SC in 2022:
Snelling:
$57,045
State:
$64,115
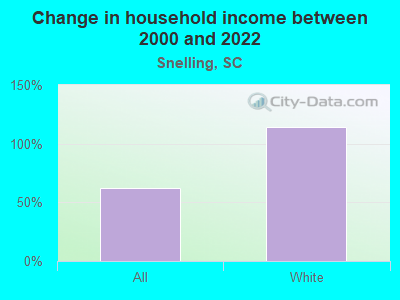
Change in median household income between 2000 and 2022:
Snelling, South Carolina:
+61.5%
South Carolina:
+72.9%
Number of households with income < $10k:
Snelling:
0.0% (0)
State:
6.1% (130,922)
Number of households with income $10k - 20k:
Snelling:
3.7% (4)
State:
7.9% (168,918)
Number of households with income $20k - 30k:
Snelling:
12.1% (13)
State:
8.0% (171,564)
Number of households with income $30k - 40k:
Snelling:
22.4% (24)
South Carolina:
9.2% (195,662)
Number of households with income $40k - 50k:
Snelling:
8.4% (9)
South Carolina:
8.2% (176,179)
Number of households with income $50k - 60k:
Snelling:
6.5% (7)
State:
7.5% (159,159)
Number of households with income $60k - 75k:
Snelling:
2.8% (3)
State:
9.9% (211,862)
Number of households with income $75k - 100k:
Snelling:
11.2% (12)
State:
13.5% (287,601)
Number of households with income $100k - 125k:
Snelling:
4.7% (5)
State:
9.3% (199,068)
Number of households with income $125k - 150k:
Snelling:
17.8% (19)
State:
6.2% (133,330)
Number of households with income $150k - 200k:
Snelling:
4.7% (5)
State:
6.6% (141,363)
Number of households with income > $200k:
Snelling:
5.6% (6)
South Carolina:
7.5% (160,452)
Aggregate household income in Snelling in 2022: $8,759,231
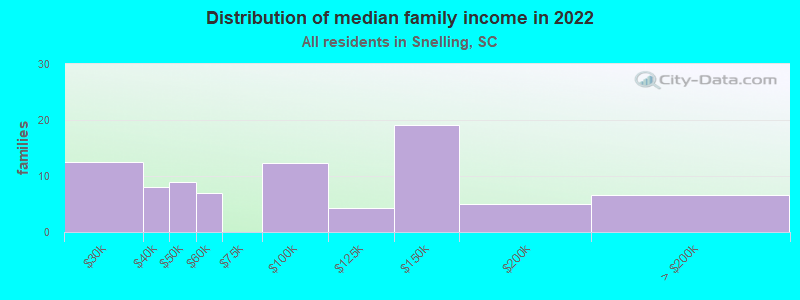
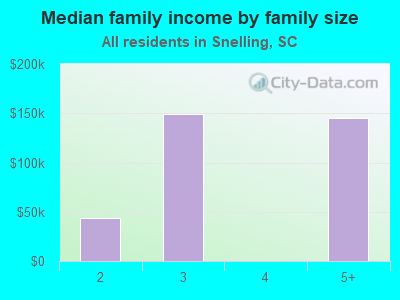
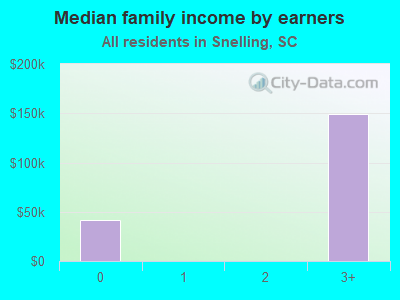
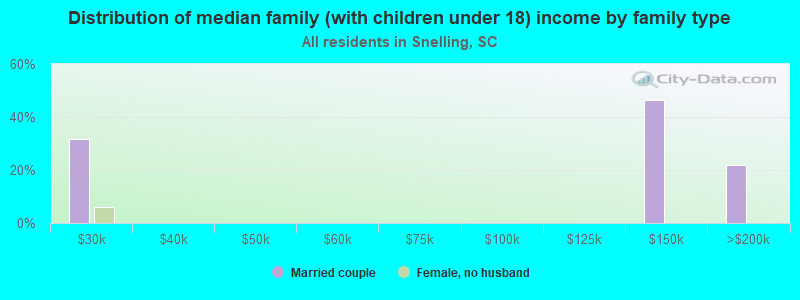
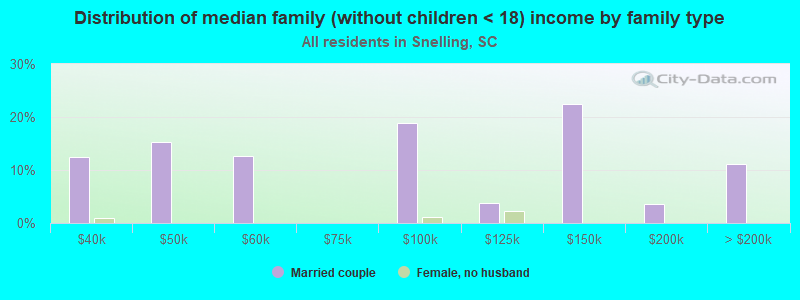
Median family income in Snelling in 2022:
Snelling:
$78,388
State:
$79,886
Number of families with income $20k - 30k:
Snelling:
14.9% (12)
State:
5.9% (82,415)
Number of families with income $30k - 40k:
Snelling:
9.6% (8)
State:
7.5% (105,475)
Number of families with income $40k - 50k:
Snelling:
10.6% (9)
State:
7.7% (107,666)
Number of families with income $50k - 60k:
Snelling:
8.4% (7)
South Carolina:
7.1% (98,803)
Number of families with income $75k - 100k:
Snelling:
14.8% (12)
South Carolina:
15.4% (214,716)
Number of families with income $100k - 125k:
Snelling:
5.1% (4)
South Carolina:
11.4% (159,999)
Number of families with income $125k - 150k:
Snelling:
22.8% (19)
State:
8.0% (112,152)
Number of families with income $150k - 200k:
Snelling:
6.1% (5)
South Carolina:
8.8% (123,525)
Number of families with income > $200k:
Snelling:
7.8% (7)
South Carolina:
10.1% (140,575)
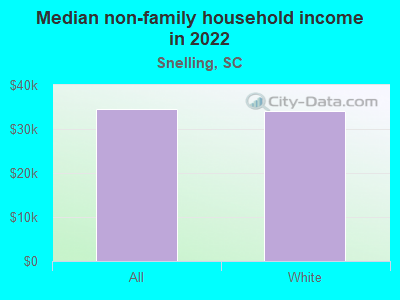
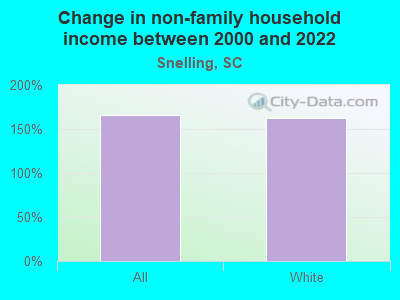
Median non-family income in Snelling in 2022:
Snelling:
$34,546
State:
$38,426
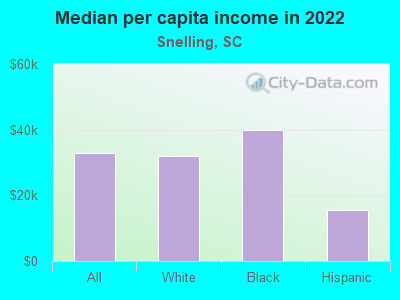
Median per capita income in Snelling in 2022:
Snelling:
$32,864
South Carolina:
$36,675
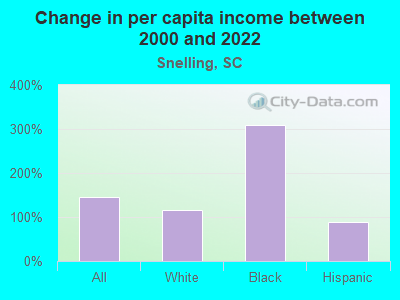
Change in median per capita income between 2000 and 2022:
Snelling, South Carolina:
+144.9%
South Carolina:
+95.1%
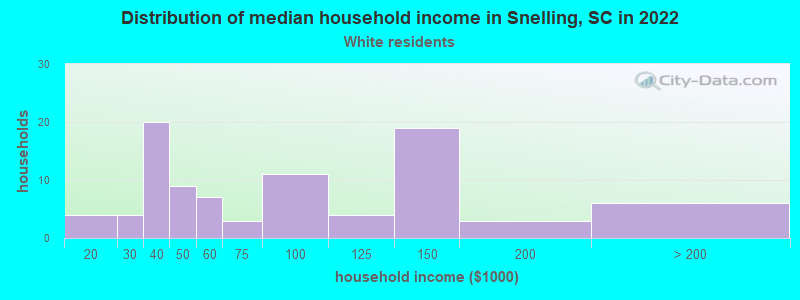
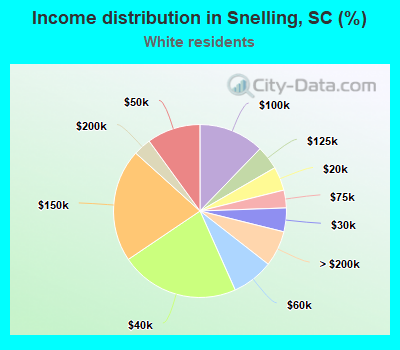
Income statistics for White residents
Median household income in Snelling, SC in 2022:
Snelling:
$74,064
South Carolina:
$73,516
Change in median household income between 2000 and 2022:
Snelling, South Carolina:
+113.9%
State:
+74.8%
Number of households with income < $10k:
Snelling:
0.0% (0)
State:
4.8% (68,379)
Number of households with income $10k - 20k:
Snelling:
4.4% (4)
State:
5.9% (85,105)
Number of households with income $20k - 30k:
Snelling:
4.4% (4)
State:
7.1% (101,178)
Number of households with income $30k - 40k:
Snelling:
22.2% (20)
State:
8.0% (114,877)
Number of households with income $40k - 50k:
Snelling:
10.0% (9)
State:
7.9% (112,749)
Number of households with income $50k - 60k:
Snelling:
7.8% (7)
State:
7.1% (101,835)
Number of households with income $60k - 75k:
Snelling:
3.3% (3)
State:
10.2% (145,879)
Number of households with income $75k - 100k:
Snelling:
12.2% (11)
State:
14.0% (200,068)
Number of households with income $100k - 125k:
Snelling:
4.4% (4)
South Carolina:
10.4% (148,542)
Number of households with income $125k - 150k:
Snelling:
21.1% (19)
South Carolina:
7.3% (105,118)
Number of households with income $150k - 200k:
Snelling:
3.3% (3)
State:
8.0% (114,506)
Number of households with income > $200k:
Snelling:
6.7% (6)
South Carolina:
9.3% (133,550)
Aggregate household income in Snelling in 2022: $7,658,435
Median non-family income in Snelling in 2022:
Snelling:
$34,103
State:
$42,596
Median per capita income in Snelling in 2022:
Snelling:
$31,859
South Carolina:
$42,728
Change in median per capita income between 2000 and 2022:
Snelling, South Carolina:
+115.1%
South Carolina:
+93.4%
Income statistics for Black or African American residents
Aggregate household income in Snelling in 2022: $508,150
Median per capita income in Snelling in 2022:
Snelling:
$40,036
State:
$24,863
Income statistics for Hispanic or Latino residents
Aggregate household income in Snelling in 2022: $569,291
Median per capita income in Snelling in 2022:
Snelling:
$15,406
State:
$23,692
Change in median per capita income between 2000 and 2022:
Snelling, South Carolina:
+87.9%
State:
+95.1%
Discuss Snelling, South Carolina (SC) on our hugely popular South Carolina forum.