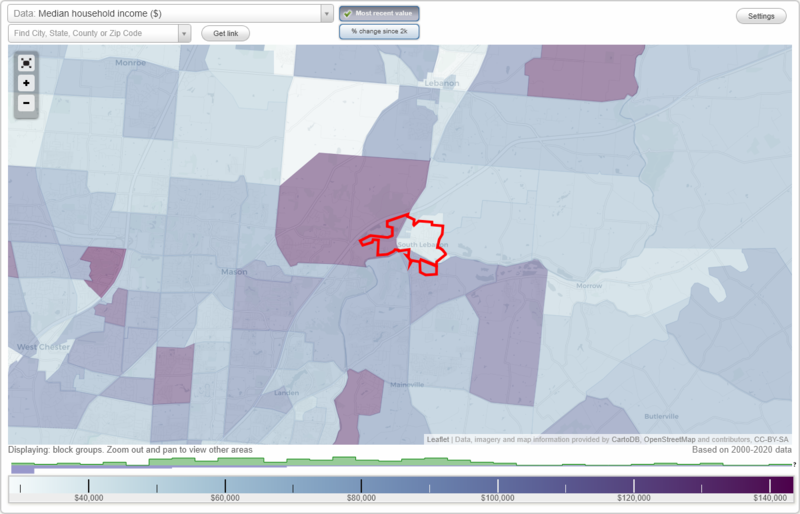
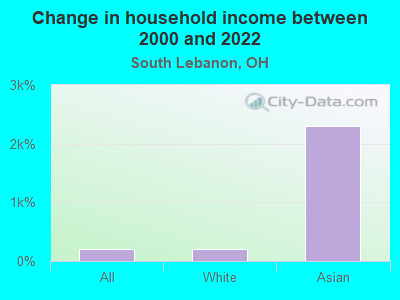
The median household income in South Lebanon, OH in 2022 was $109,178, which was 39.8% greater than the median annual income of $65,720 across the entire state of Ohio. Compared to the median income of $35,676 in 2000 this represents an increase of 67.3%. The per capita income in 2022 was $40,904, which means an increase of 59.0% compared to 2000 when it was $16,779.
Whole page based on the data from 2000 / 2022 when the population of South Lebanon, Ohio was 2,538 / 6,549
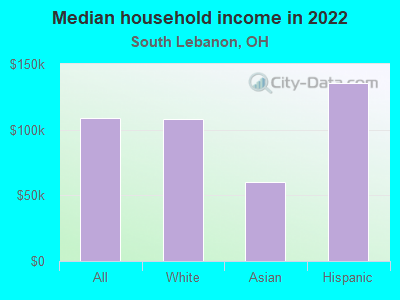
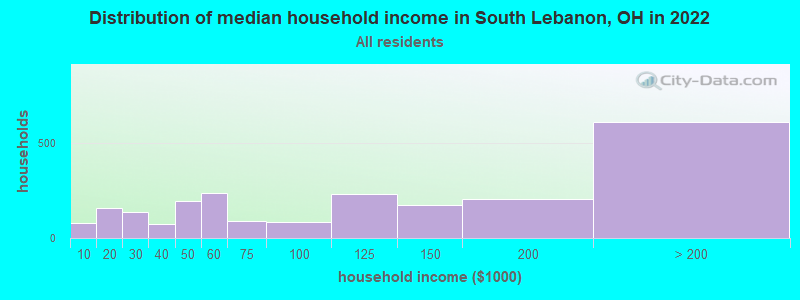
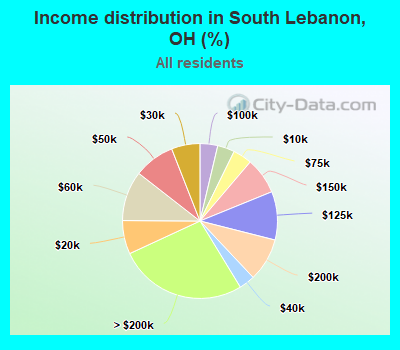
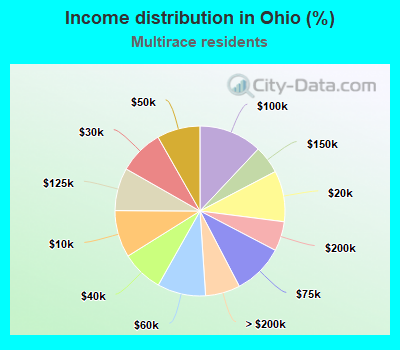
Income statistics for all residents
Median household income in South Lebanon, OH in 2022:
South Lebanon:
$109,178
State:
$65,720
Number of households with income < $10k:
South Lebanon:
3.6% (81)
State:
5.9% (286,511)
Number of households with income $10k - 20k:
South Lebanon:
7.0% (159)
Ohio:
8.0% (392,234)
Number of households with income $20k - 30k:
South Lebanon:
5.9% (135)
State:
7.8% (380,130)
Number of households with income $30k - 40k:
South Lebanon:
3.3% (75)
State:
8.3% (405,713)
Number of households with income $40k - 50k:
South Lebanon:
8.5% (193)
Ohio:
8.0% (388,158)
Number of households with income $50k - 60k:
South Lebanon:
10.4% (237)
State:
7.7% (378,045)
Number of households with income $60k - 75k:
South Lebanon:
4.0% (90)
Ohio:
10.0% (488,380)
Number of households with income $75k - 100k:
South Lebanon:
3.7% (84)
State:
13.2% (643,774)
Number of households with income $100k - 125k:
South Lebanon:
10.1% (229)
State:
9.6% (467,137)
Number of households with income $125k - 150k:
South Lebanon:
7.6% (173)
Ohio:
6.4% (314,382)
Number of households with income $150k - 200k:
South Lebanon:
9.0% (205)
Ohio:
7.4% (359,847)
Number of households with income > $200k:
South Lebanon:
26.8% (608)
Ohio:
7.7% (373,895)
Aggregate household income in South Lebanon in 2022: $283,339,264
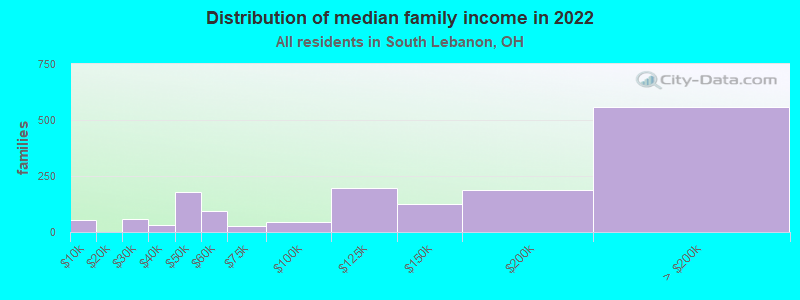
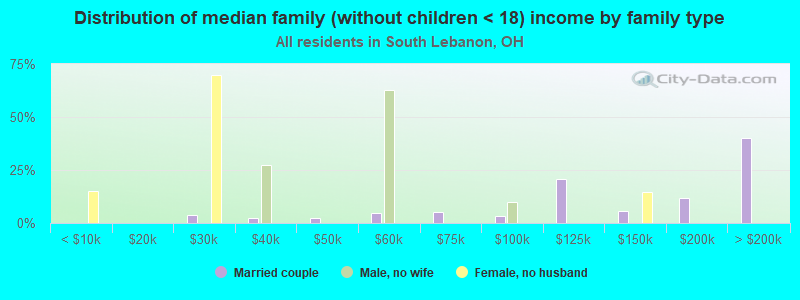
Median family income in South Lebanon in 2022:
South Lebanon:
$132,642
Ohio:
$86,001
Number of families with income < $10k:
South Lebanon:
3.5% (54)
State:
3.6% (107,748)
Number of families with income $20k - 30k:
South Lebanon:
3.6% (57)
State:
4.9% (147,509)
Number of families with income $30k - 40k:
South Lebanon:
2.1% (33)
Ohio:
6.3% (189,350)
Number of families with income $40k - 50k:
South Lebanon:
11.5% (179)
State:
6.8% (201,952)
Number of families with income $50k - 60k:
South Lebanon:
6.1% (95)
State:
7.2% (216,119)
Number of families with income $60k - 75k:
South Lebanon:
1.7% (26)
State:
10.0% (298,584)
Number of families with income $75k - 100k:
South Lebanon:
2.9% (44)
State:
15.1% (449,004)
Number of families with income $100k - 125k:
South Lebanon:
12.7% (197)
Ohio:
12.0% (357,739)
Number of families with income $125k - 150k:
South Lebanon:
8.2% (127)
State:
8.7% (258,363)
Number of families with income $150k - 200k:
South Lebanon:
11.9% (186)
State:
10.4% (308,871)
Number of families with income > $200k:
South Lebanon:
35.9% (558)
State:
10.9% (326,404)
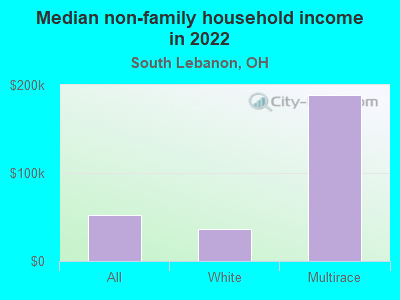
Median non-family income in South Lebanon in 2022:
South Lebanon:
$52,396
State:
$40,164
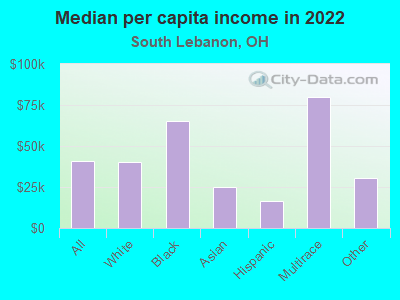
Median per capita income in South Lebanon in 2022:
South Lebanon:
$40,904
State:
$37,932
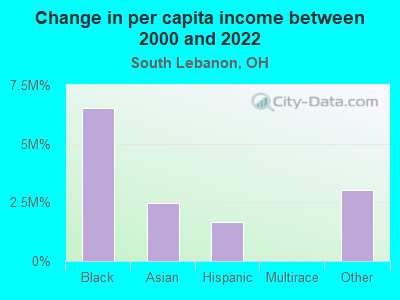
Change in median per capita income between 2000 and 2022:
South Lebanon, Ohio:
+143.8%
Ohio:
+80.6%
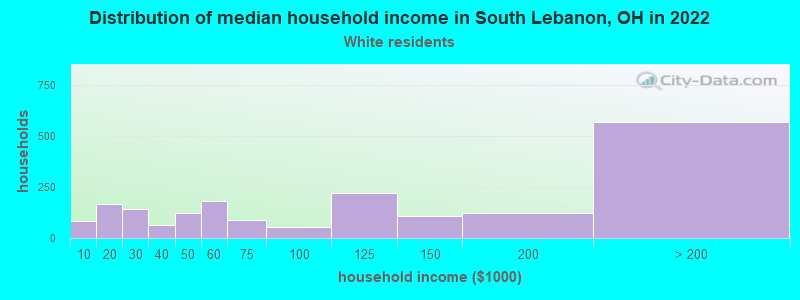
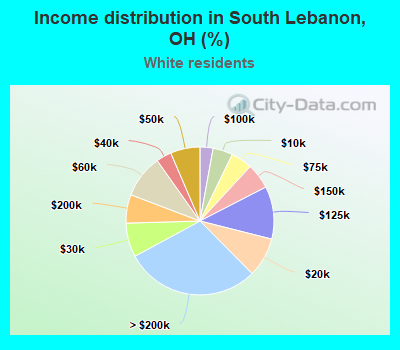
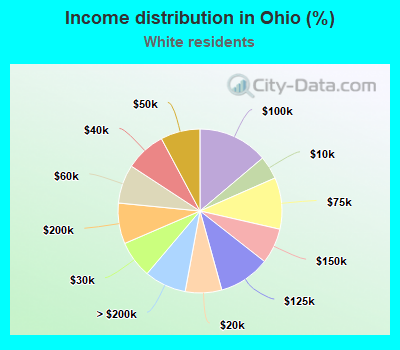
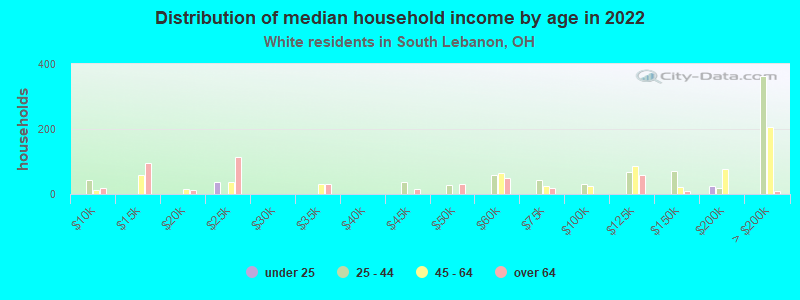
Income statistics for White residents
Median household income in South Lebanon, OH in 2022:
South Lebanon:
$107,832
Ohio:
$70,749
Number of households with income < $10k:
South Lebanon:
4.3% (83)
State:
4.6% (178,598)
Number of households with income $10k - 20k:
South Lebanon:
8.6% (166)
Ohio:
7.2% (279,908)
Number of households with income $20k - 30k:
South Lebanon:
7.4% (143)
Ohio:
7.3% (285,935)
Number of households with income $30k - 40k:
South Lebanon:
3.3% (64)
State:
8.0% (310,871)
Number of households with income $40k - 50k:
South Lebanon:
6.5% (124)
State:
7.8% (303,221)
Number of households with income $50k - 60k:
South Lebanon:
9.4% (181)
State:
7.7% (297,864)
Number of households with income $60k - 75k:
South Lebanon:
4.7% (90)
State:
10.2% (395,379)
Number of households with income $75k - 100k:
South Lebanon:
2.9% (55)
Ohio:
13.8% (538,093)
Number of households with income $100k - 125k:
South Lebanon:
11.5% (221)
State:
10.1% (394,658)
Number of households with income $125k - 150k:
South Lebanon:
5.6% (107)
Ohio:
7.0% (272,471)
Number of households with income $150k - 200k:
South Lebanon:
6.2% (120)
Ohio:
8.0% (312,939)
Number of households with income > $200k:
South Lebanon:
29.5% (567)
Ohio:
8.3% (321,654)
Aggregate household income in South Lebanon in 2022: $237,248,469
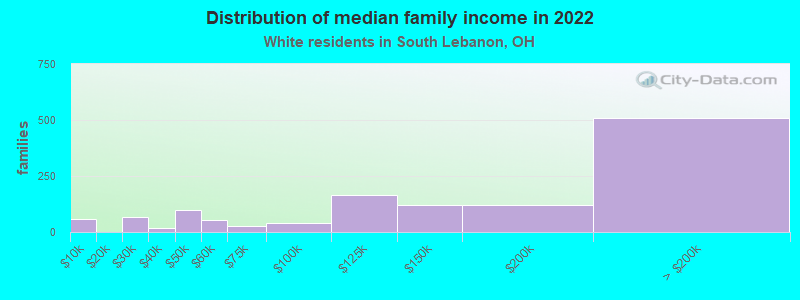
Median family income in South Lebanon in 2022:
South Lebanon:
$142,523
State:
$91,556
Number of families with income < $10k:
South Lebanon:
4.4% (57)
State:
2.6% (62,772)
Number of families with income $20k - 30k:
South Lebanon:
5.2% (66)
State:
4.3% (102,470)
Number of families with income $30k - 40k:
South Lebanon:
1.4% (18)
Ohio:
5.8% (139,122)
Number of families with income $40k - 50k:
South Lebanon:
7.6% (97)
Ohio:
6.4% (152,812)
Number of families with income $50k - 60k:
South Lebanon:
4.2% (54)
State:
7.0% (167,384)
Number of families with income $60k - 75k:
South Lebanon:
2.0% (25)
State:
10.2% (245,177)
Number of families with income $75k - 100k:
South Lebanon:
3.3% (42)
State:
15.6% (375,564)
Number of families with income $100k - 125k:
South Lebanon:
13.0% (166)
State:
12.6% (303,754)
Number of families with income $125k - 150k:
South Lebanon:
9.3% (119)
State:
9.3% (224,334)
Number of families with income $150k - 200k:
South Lebanon:
9.6% (122)
State:
11.2% (268,546)
Number of families with income > $200k:
South Lebanon:
40.0% (511)
Ohio:
11.8% (282,391)
Median non-family income in South Lebanon in 2022:
South Lebanon:
$36,027
State:
$42,037
Change in median non-family income between 2000 and 2022:
South Lebanon, Ohio:
+85.9%
Ohio:
+68.0%
Median per capita income in South Lebanon in 2022:
South Lebanon:
$40,352
Ohio:
$40,927
Change in median per capita income between 2000 and 2022:
South Lebanon, Ohio:
+140.6%
State:
+85.3%
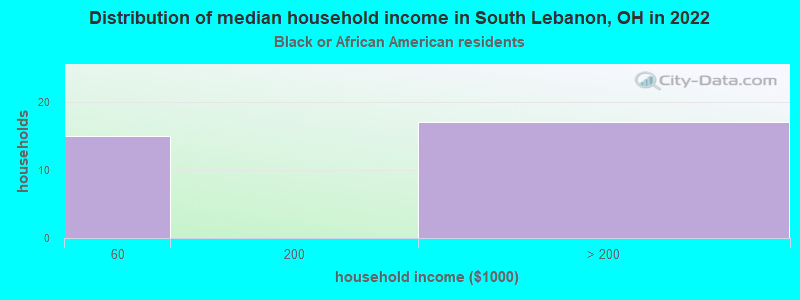
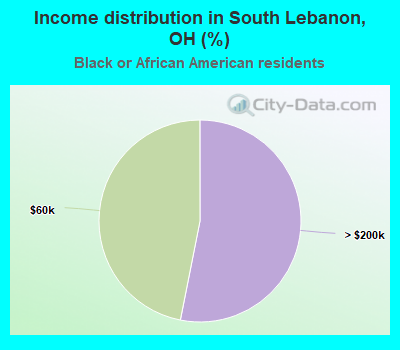
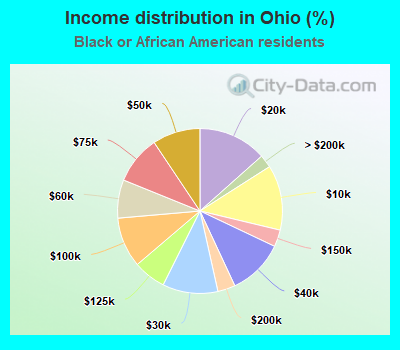
Income statistics for Black or African American residents
Number of households with income < $10k:
South Lebanon:
0.0% (0)
State:
12.8% (74,069)
Number of households with income $10k - 20k:
South Lebanon:
0.0% (0)
Ohio:
13.4% (77,994)
Number of households with income $20k - 30k:
South Lebanon:
0.0% (0)
Ohio:
10.9% (63,098)
Number of households with income $30k - 40k:
South Lebanon:
0.0% (0)
Ohio:
11.0% (63,974)
Number of households with income $40k - 50k:
South Lebanon:
0.0% (0)
Ohio:
9.4% (54,498)
Number of households with income $50k - 60k:
South Lebanon:
46.9% (15)
Ohio:
7.5% (43,648)
Number of households with income $60k - 75k:
South Lebanon:
0.0% (0)
State:
9.5% (55,058)
Number of households with income $75k - 100k:
South Lebanon:
0.0% (0)
State:
9.8% (57,169)
Number of households with income $100k - 125k:
South Lebanon:
0.0% (0)
State:
6.4% (37,172)
Number of households with income $125k - 150k:
South Lebanon:
0.0% (0)
Ohio:
3.3% (19,208)
Number of households with income $150k - 200k:
South Lebanon:
0.0% (0)
State:
3.5% (20,047)
Number of households with income > $200k:
South Lebanon:
53.1% (17)
Ohio:
2.6% (14,827)
Median per capita income in South Lebanon in 2022:
South Lebanon:
$65,221
State:
$25,457
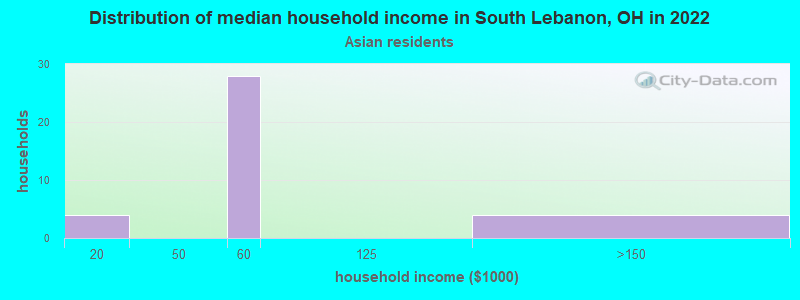
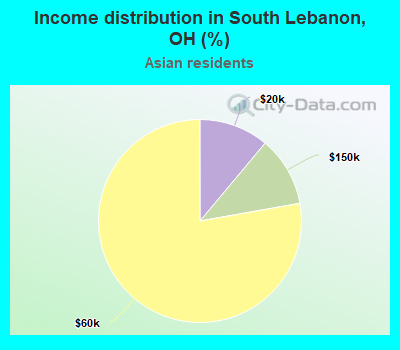
Income statistics for Asian residents
Median household income in South Lebanon, OH in 2022:
South Lebanon:
$59,975
State:
$90,445
Number of households with income < $10k:
South Lebanon:
0.0% (0)
Ohio:
6.2% (6,183)
Number of households with income $10k - 20k:
South Lebanon:
11.1% (4)
State:
4.9% (4,897)
Number of households with income $20k - 30k:
South Lebanon:
0.0% (0)
State:
5.6% (5,549)
Number of households with income $30k - 40k:
South Lebanon:
0.0% (0)
State:
5.9% (5,856)
Number of households with income $40k - 50k:
South Lebanon:
0.0% (0)
Ohio:
4.6% (4,577)
Number of households with income $50k - 60k:
South Lebanon:
77.8% (28)
State:
6.4% (6,359)
Number of households with income $60k - 75k:
South Lebanon:
0.0% (0)
Ohio:
8.8% (8,760)
Number of households with income $75k - 100k:
South Lebanon:
0.0% (0)
State:
11.9% (11,893)
Number of households with income $100k - 125k:
South Lebanon:
0.0% (0)
State:
10.5% (10,425)
Number of households with income $125k - 150k:
South Lebanon:
11.1% (4)
State:
7.5% (7,458)
Number of households with income $150k - 200k:
South Lebanon:
0.0% (0)
State:
9.2% (9,166)
Number of households with income > $200k:
South Lebanon:
0.0% (0)
Ohio:
18.6% (18,476)
Aggregate household income in South Lebanon in 2022: $2,285,014
Median per capita income in South Lebanon in 2022:
South Lebanon:
$24,876
Ohio:
$45,984
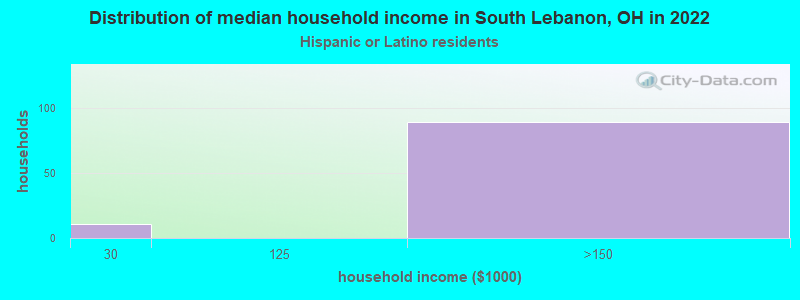
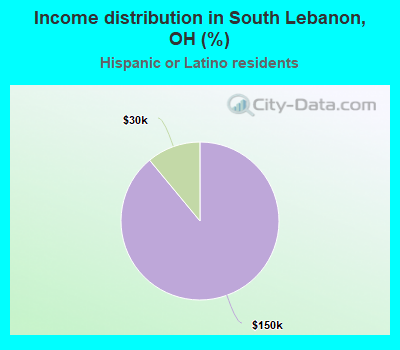
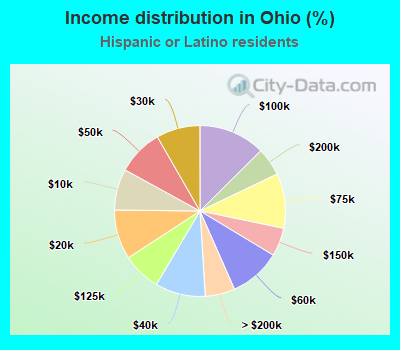
Income statistics for Hispanic or Latino residents
Median household income in South Lebanon, OH in 2022:
South Lebanon:
$135,169
Ohio:
$55,580
Number of households with income < $10k:
South Lebanon:
0.0% (0)
State:
7.8% (12,549)
Number of households with income $10k - 20k:
South Lebanon:
0.0% (0)
State:
9.4% (15,109)
Number of households with income $20k - 30k:
South Lebanon:
11.0% (11)
State:
8.3% (13,358)
Number of households with income $30k - 40k:
South Lebanon:
0.0% (0)
State:
9.5% (15,327)
Number of households with income $40k - 50k:
South Lebanon:
0.0% (0)
Ohio:
8.7% (14,026)
Number of households with income $50k - 60k:
South Lebanon:
0.0% (0)
State:
9.8% (15,711)
Number of households with income $60k - 75k:
South Lebanon:
0.0% (0)
Ohio:
10.4% (16,676)
Number of households with income $75k - 100k:
South Lebanon:
0.0% (0)
State:
12.6% (20,252)
Number of households with income $100k - 125k:
South Lebanon:
0.0% (0)
State:
7.3% (11,728)
Number of households with income $125k - 150k:
South Lebanon:
89.0% (89)
State:
5.4% (8,663)
Number of households with income $150k - 200k:
South Lebanon:
0.0% (0)
Ohio:
5.3% (8,578)
Number of households with income > $200k:
South Lebanon:
0.0% (0)
State:
5.6% (9,027)
Aggregate household income in South Lebanon in 2022: $16,681,538
Median per capita income in South Lebanon in 2022:
South Lebanon:
$16,531
State:
$25,336
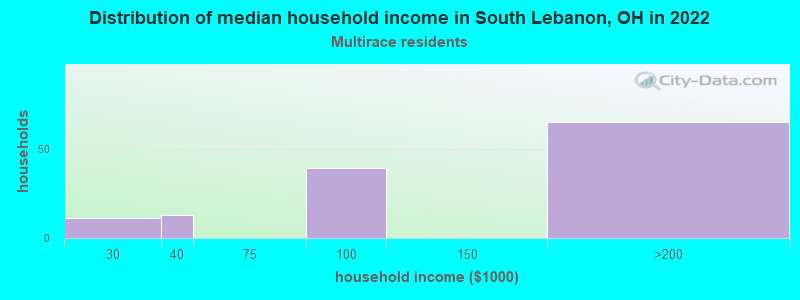
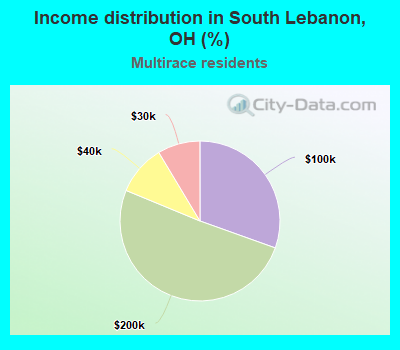
Income statistics for Multirace residents
Number of households with income < $10k:
South Lebanon:
0.0% (0)
State:
9.0% (20,905)
Number of households with income $10k - 20k:
South Lebanon:
0.0% (0)
State:
9.7% (22,576)
Number of households with income $20k - 30k:
South Lebanon:
8.6% (11)
Ohio:
8.5% (19,857)
Number of households with income $30k - 40k:
South Lebanon:
10.2% (13)
State:
7.9% (18,445)
Number of households with income $40k - 50k:
South Lebanon:
0.0% (0)
Ohio:
8.2% (19,093)
Number of households with income $50k - 60k:
South Lebanon:
0.0% (0)
State:
9.2% (21,428)
Number of households with income $60k - 75k:
South Lebanon:
0.0% (0)
State:
9.7% (22,502)
Number of households with income $75k - 100k:
South Lebanon:
30.5% (39)
Ohio:
12.0% (27,921)
Number of households with income $100k - 125k:
South Lebanon:
0.0% (0)
State:
8.2% (18,963)
Number of households with income $125k - 150k:
South Lebanon:
0.0% (0)
Ohio:
5.3% (12,373)
Number of households with income $150k - 200k:
South Lebanon:
50.8% (65)
Ohio:
5.6% (13,097)
Number of households with income > $200k:
South Lebanon:
0.0% (0)
State:
6.6% (15,364)
Aggregate household income in South Lebanon in 2022: $23,749,321
Median non-family income in South Lebanon in 2022:
South Lebanon:
$188,204
State:
$37,743
Median per capita income in South Lebanon in 2022:
South Lebanon:
$79,856
State:
$25,822
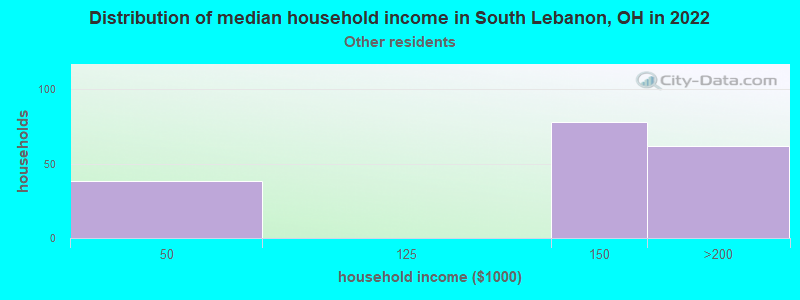
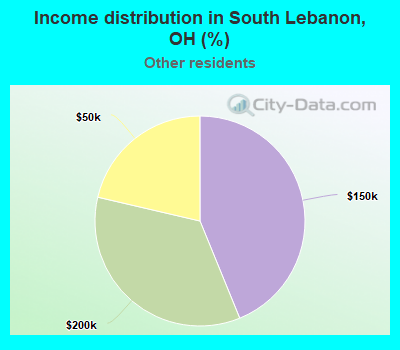
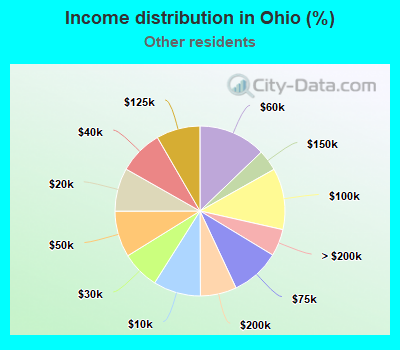
Income statistics for other residents
Number of households with income < $10k:
South Lebanon:
0.0% (0)
Ohio:
9.0% (5,770)
Number of households with income $10k - 20k:
South Lebanon:
0.0% (0)
State:
8.2% (5,259)
Number of households with income $20k - 30k:
South Lebanon:
0.0% (0)
State:
7.2% (4,600)
Number of households with income $30k - 40k:
South Lebanon:
0.0% (0)
State:
8.4% (5,383)
Number of households with income $40k - 50k:
South Lebanon:
21.3% (38)
State:
8.8% (5,616)
Number of households with income $50k - 60k:
South Lebanon:
0.0% (0)
State:
12.8% (8,181)
Number of households with income $60k - 75k:
South Lebanon:
0.0% (0)
State:
9.4% (5,970)
Number of households with income $75k - 100k:
South Lebanon:
0.0% (0)
State:
11.7% (7,463)
Number of households with income $100k - 125k:
South Lebanon:
0.0% (0)
State:
8.3% (5,329)
Number of households with income $125k - 150k:
South Lebanon:
43.8% (78)
Ohio:
4.0% (2,570)
Number of households with income $150k - 200k:
South Lebanon:
34.8% (62)
State:
6.9% (4,405)
Number of households with income > $200k:
South Lebanon:
0.0% (0)
State:
5.1% (3,280)
Aggregate household income in South Lebanon in 2022: $22,880,475
Median per capita income in South Lebanon in 2022:
South Lebanon:
$30,423
State:
$26,283
Discuss South Lebanon, Ohio (OH) on our hugely popular Ohio forum.