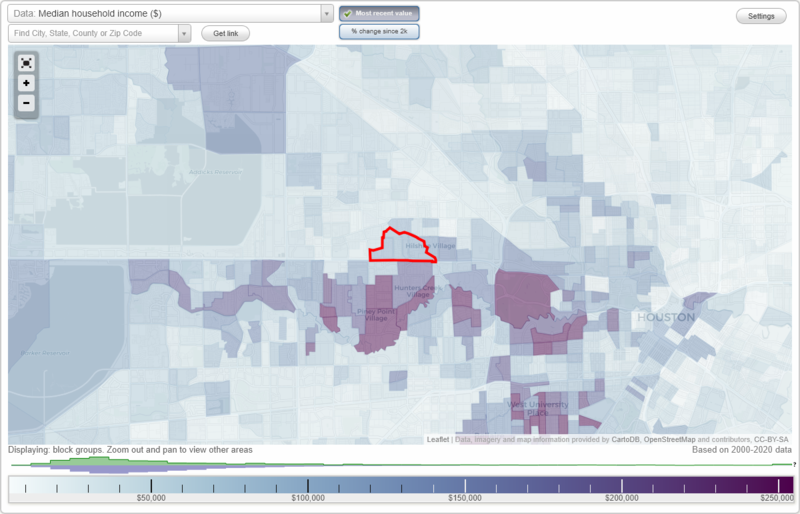
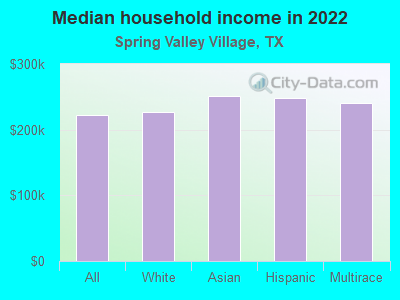
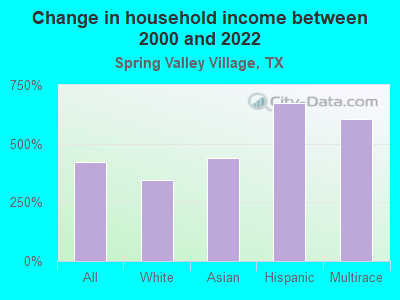
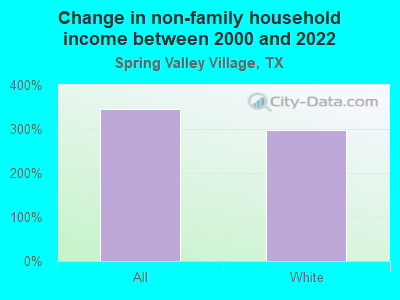
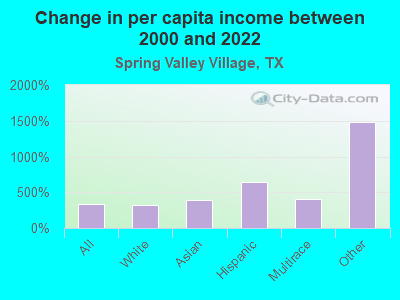
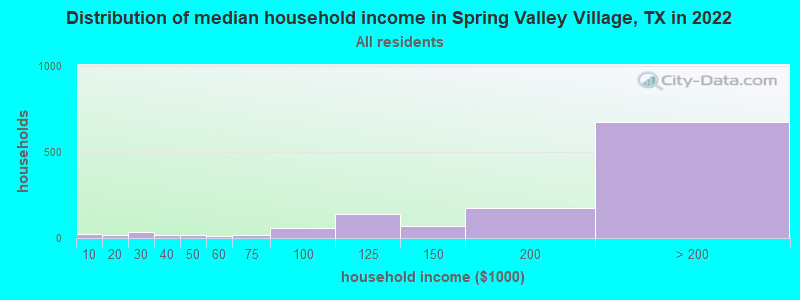
The median household income in Spring Valley Village, TX in 2022 was $222,942, which was 67.6% greater than the median annual income of $72,284 across the entire state of Texas. Compared to the median income of $42,598 in 2000 this represents an increase of 80.9%. The per capita income in 2022 was $94,260, which means an increase of 77.3% compared to 2000 when it was $21,435.
Whole page based on the data from 2000 / 2022 when the population of Spring Valley Village, Texas was 3,715 / 4,271
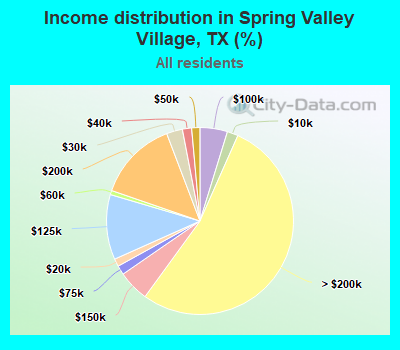
Income statistics for all residents
Median household income in Spring Valley Village, TX in 2022:
Spring Valley Village:
$222,943
State:
$72,284
Number of households with income < $10k:
Spring Valley Village:
1.9% (24)
Texas:
5.5% (611,011)
Number of households with income $10k - 20k:
Spring Valley Village:
1.3% (17)
State:
6.7% (743,157)
Number of households with income $20k - 30k:
Spring Valley Village:
2.8% (35)
State:
7.2% (803,381)
Number of households with income $30k - 40k:
Spring Valley Village:
1.6% (20)
State:
7.8% (866,080)
Number of households with income $40k - 50k:
Spring Valley Village:
1.4% (18)
State:
7.3% (810,440)
Number of households with income $50k - 60k:
Spring Valley Village:
0.7% (9)
State:
7.2% (799,783)
Number of households with income $60k - 75k:
Spring Valley Village:
1.6% (20)
Texas:
9.9% (1,095,384)
Number of households with income $75k - 100k:
Spring Valley Village:
4.8% (60)
State:
12.8% (1,419,057)
Number of households with income $100k - 125k:
Spring Valley Village:
11.2% (142)
State:
9.5% (1,054,577)
Number of households with income $125k - 150k:
Spring Valley Village:
5.4% (68)
State:
6.7% (741,518)
Number of households with income $150k - 200k:
Spring Valley Village:
13.9% (176)
Texas:
8.7% (961,776)
Number of households with income > $200k:
Spring Valley Village:
53.4% (674)
State:
10.7% (1,181,544)
Aggregate household income in Spring Valley Village in 2022: $398,326,776
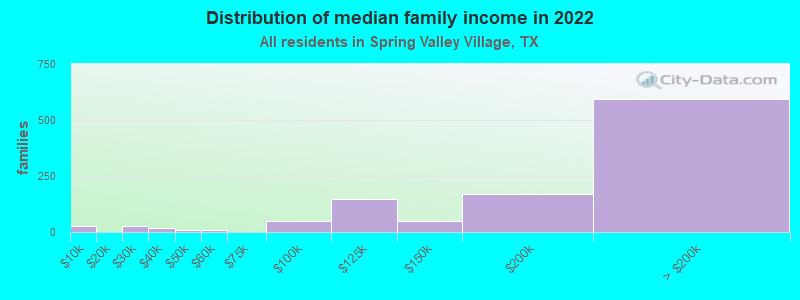
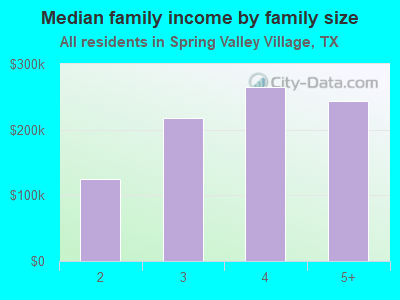
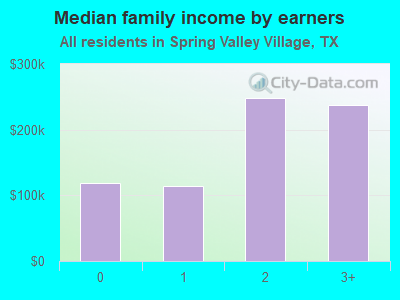
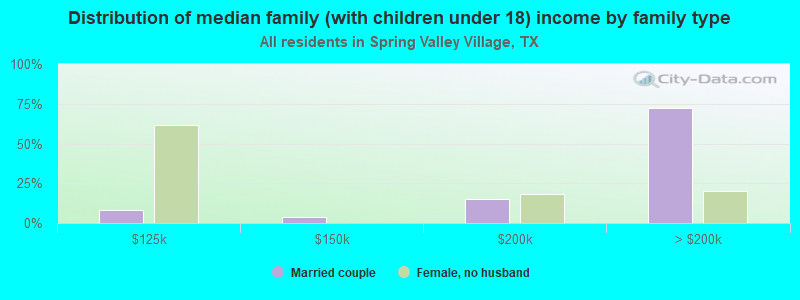
Median family income in Spring Valley Village in 2022:
Spring Valley Village:
$227,879
Texas:
$86,267
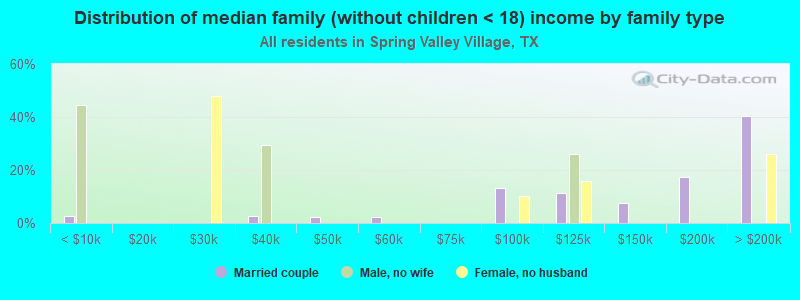
Number of families with income < $10k:
Spring Valley Village:
2.5% (27)
State:
4.0% (297,884)
Number of families with income $20k - 30k:
Spring Valley Village:
2.3% (25)
State:
5.8% (430,949)
Number of families with income $30k - 40k:
Spring Valley Village:
1.7% (19)
Texas:
6.6% (493,535)
Number of families with income $40k - 50k:
Spring Valley Village:
0.8% (8)
Texas:
6.7% (499,663)
Number of families with income $50k - 60k:
Spring Valley Village:
0.8% (8)
State:
6.6% (492,203)
Number of families with income $75k - 100k:
Spring Valley Village:
4.5% (50)
Texas:
13.6% (1,015,480)
Number of families with income $100k - 125k:
Spring Valley Village:
13.5% (148)
Texas:
10.7% (797,961)
Number of families with income $125k - 150k:
Spring Valley Village:
4.6% (50)
State:
8.1% (602,985)
Number of families with income $150k - 200k:
Spring Valley Village:
15.4% (170)
State:
10.7% (804,459)
Number of families with income > $200k:
Spring Valley Village:
54.0% (595)
Texas:
13.5% (1,013,514)
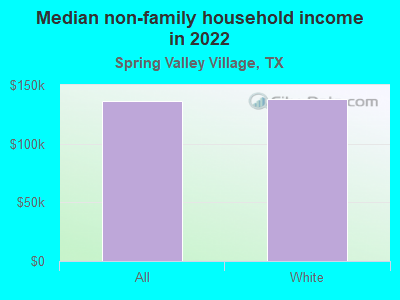
Median non-family income in Spring Valley Village in 2022:
Spring Valley Village:
$136,376
State:
$45,999
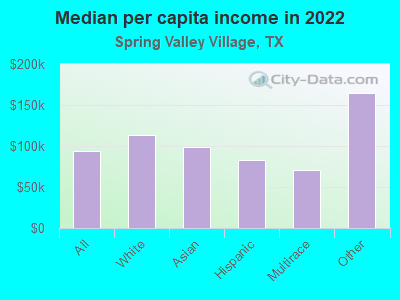
Median per capita income in Spring Valley Village in 2022:
Spring Valley Village:
$94,260
Texas:
$38,123
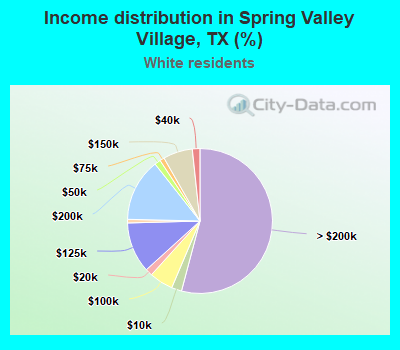
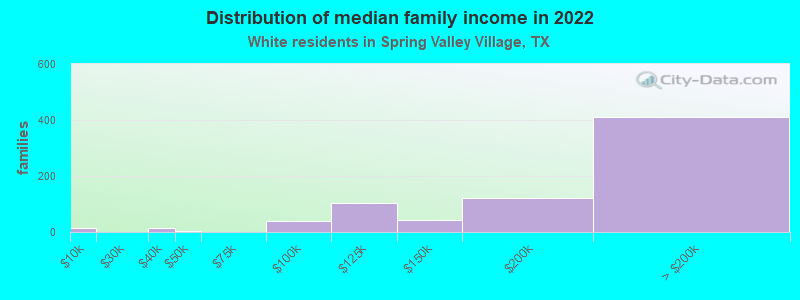
Income statistics for White residents
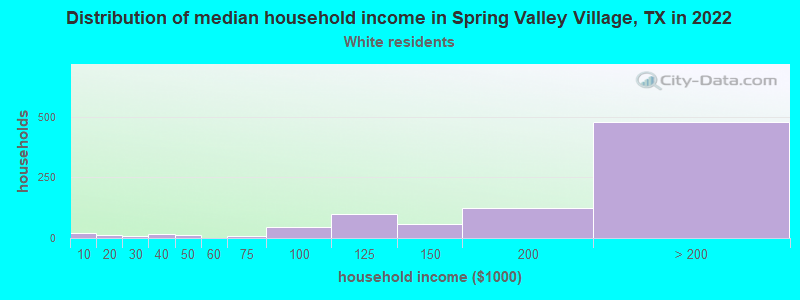
Median household income in Spring Valley Village, TX in 2022:
Spring Valley Village:
$227,063
State:
$82,032
Number of households with income < $10k:
Spring Valley Village:
2.3% (20)
Texas:
4.7% (273,716)
Number of households with income $10k - 20k:
Spring Valley Village:
1.6% (14)
Texas:
5.5% (322,702)
Number of households with income $20k - 30k:
Spring Valley Village:
0.8% (7)
State:
6.2% (363,947)
Number of households with income $30k - 40k:
Spring Valley Village:
1.7% (15)
Texas:
6.8% (399,275)
Number of households with income $40k - 50k:
Spring Valley Village:
1.4% (12)
State:
6.5% (383,417)
Number of households with income $50k - 60k:
Spring Valley Village:
0.0% (0)
State:
6.6% (388,535)
Number of households with income $60k - 75k:
Spring Valley Village:
1.0% (9)
State:
9.7% (566,295)
Number of households with income $75k - 100k:
Spring Valley Village:
5.3% (47)
State:
13.0% (760,276)
Number of households with income $100k - 125k:
Spring Valley Village:
11.3% (100)
State:
10.2% (597,596)
Number of households with income $125k - 150k:
Spring Valley Village:
6.6% (58)
Texas:
7.4% (436,830)
Number of households with income $150k - 200k:
Spring Valley Village:
14.0% (124)
Texas:
9.9% (583,067)
Number of households with income > $200k:
Spring Valley Village:
54.1% (479)
State:
13.5% (792,647)
Aggregate household income in Spring Valley Village in 2022: $275,051,196
Median family income in Spring Valley Village in 2022:
Spring Valley Village:
$240,125
Texas:
$101,788
Number of families with income < $10k:
Spring Valley Village:
2.2% (16)
State:
2.8% (108,142)
Number of families with income $30k - 40k:
Spring Valley Village:
1.8% (14)
State:
5.2% (198,847)
Number of families with income $40k - 50k:
Spring Valley Village:
0.6% (5)
State:
5.6% (216,490)
Number of families with income $75k - 100k:
Spring Valley Village:
5.0% (38)
State:
13.7% (527,363)
Number of families with income $100k - 125k:
Spring Valley Village:
13.7% (102)
Texas:
11.6% (448,411)
Number of families with income $125k - 150k:
Spring Valley Village:
5.7% (42)
State:
9.2% (355,798)
Number of families with income $150k - 200k:
Spring Valley Village:
16.0% (120)
Texas:
12.5% (480,185)
Number of families with income > $200k:
Spring Valley Village:
55.0% (412)
State:
17.6% (677,490)
Median non-family income in Spring Valley Village in 2022:
Spring Valley Village:
$137,873
State:
$50,587
Median per capita income in Spring Valley Village in 2022:
Spring Valley Village:
$113,156
State:
$47,740
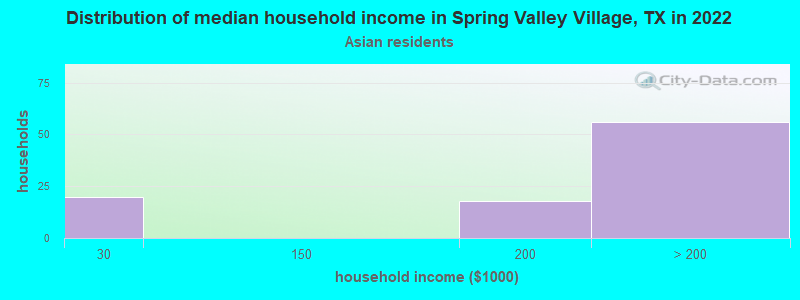
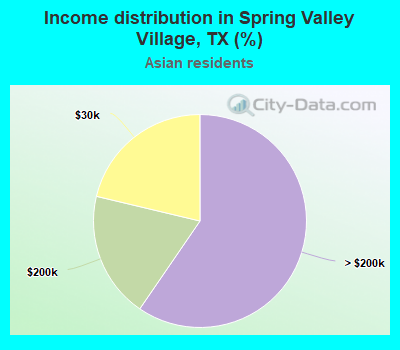
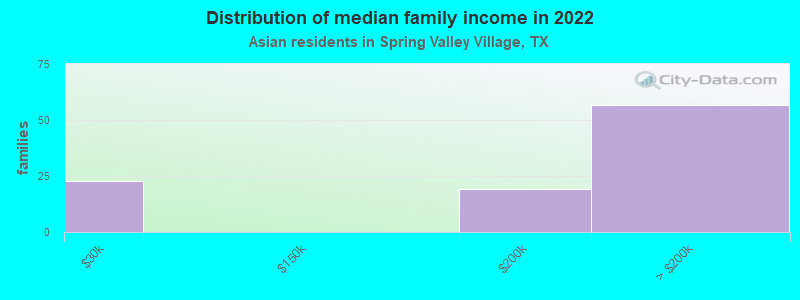
Income statistics for Asian residents
Median household income in Spring Valley Village, TX in 2022:
Spring Valley Village:
$251,144
State:
$107,673
Number of households with income < $10k:
Spring Valley Village:
0.0% (0)
Texas:
5.2% (29,885)
Number of households with income $10k - 20k:
Spring Valley Village:
0.0% (0)
State:
4.7% (27,044)
Number of households with income $20k - 30k:
Spring Valley Village:
21.3% (20)
State:
4.1% (23,363)
Number of households with income $30k - 40k:
Spring Valley Village:
0.0% (0)
Texas:
4.1% (23,309)
Number of households with income $40k - 50k:
Spring Valley Village:
0.0% (0)
State:
5.2% (29,826)
Number of households with income $50k - 60k:
Spring Valley Village:
0.0% (0)
State:
4.7% (26,512)
Number of households with income $60k - 75k:
Spring Valley Village:
0.0% (0)
Texas:
6.5% (36,905)
Number of households with income $75k - 100k:
Spring Valley Village:
0.0% (0)
Texas:
11.3% (64,350)
Number of households with income $100k - 125k:
Spring Valley Village:
0.0% (0)
Texas:
11.4% (64,714)
Number of households with income $125k - 150k:
Spring Valley Village:
0.0% (0)
Texas:
9.3% (52,719)
Number of households with income $150k - 200k:
Spring Valley Village:
19.1% (18)
Texas:
12.5% (70,953)
Number of households with income > $200k:
Spring Valley Village:
59.6% (56)
State:
21.1% (120,260)
Aggregate household income in Spring Valley Village in 2022: $35,642,240
Median family income in Spring Valley Village in 2022:
Spring Valley Village:
$245,890
State:
$123,328
Number of families with income $20k - 30k:
Spring Valley Village:
22.9% (23)
Texas:
3.4% (14,738)
Number of families with income $150k - 200k:
Spring Valley Village:
19.3% (19)
Texas:
14.7% (64,203)
Number of families with income > $200k:
Spring Valley Village:
57.8% (57)
Texas:
24.8% (108,511)
Median per capita income in Spring Valley Village in 2022:
Spring Valley Village:
$98,646
State:
$48,626
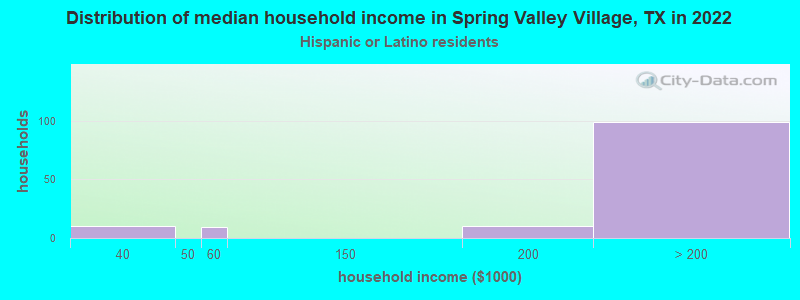
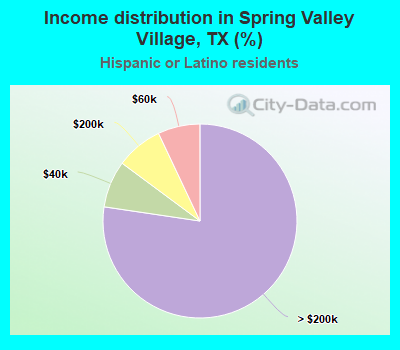
Income statistics for Hispanic or Latino residents
Median household income in Spring Valley Village, TX in 2022:
Spring Valley Village:
$247,748
State:
$60,504
Number of households with income < $10k:
Spring Valley Village:
0.0% (0)
Texas:
5.8% (213,953)
Number of households with income $10k - 20k:
Spring Valley Village:
0.0% (0)
Texas:
8.0% (297,456)
Number of households with income $20k - 30k:
Spring Valley Village:
0.0% (0)
State:
9.2% (340,166)
Number of households with income $30k - 40k:
Spring Valley Village:
7.8% (10)
State:
9.5% (354,336)
Number of households with income $40k - 50k:
Spring Valley Village:
0.0% (0)
State:
8.8% (327,013)
Number of households with income $50k - 60k:
Spring Valley Village:
7.0% (9)
State:
8.3% (308,818)
Number of households with income $60k - 75k:
Spring Valley Village:
0.0% (0)
State:
10.9% (405,109)
Number of households with income $75k - 100k:
Spring Valley Village:
0.0% (0)
Texas:
13.8% (511,639)
Number of households with income $100k - 125k:
Spring Valley Village:
0.0% (0)
State:
8.6% (319,728)
Number of households with income $125k - 150k:
Spring Valley Village:
0.0% (0)
Texas:
5.7% (210,932)
Number of households with income $150k - 200k:
Spring Valley Village:
7.8% (10)
State:
6.4% (236,055)
Number of households with income > $200k:
Spring Valley Village:
77.3% (99)
State:
5.1% (189,259)
Aggregate household income in Spring Valley Village in 2022: $51,177,720
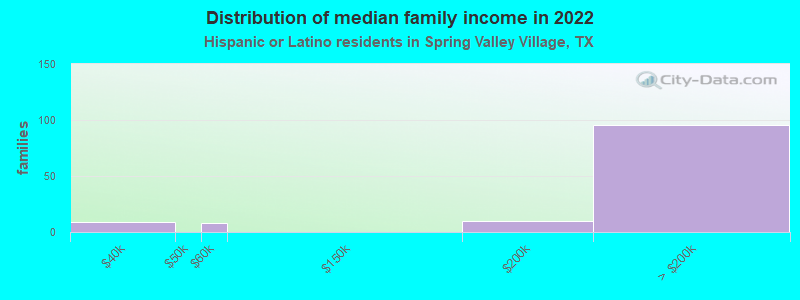
Median family income in Spring Valley Village in 2022:
Spring Valley Village:
$243,707
Texas:
$65,080
Number of families with income $30k - 40k:
Spring Valley Village:
7.6% (9)
State:
9.1% (251,999)
Number of families with income $50k - 60k:
Spring Valley Village:
6.5% (8)
State:
8.0% (223,566)
Number of families with income $150k - 200k:
Spring Valley Village:
7.8% (10)
State:
7.3% (202,259)
Number of families with income > $200k:
Spring Valley Village:
78.1% (96)
State:
5.9% (165,129)
Median per capita income in Spring Valley Village in 2022:
Spring Valley Village:
$83,210
State:
$24,862
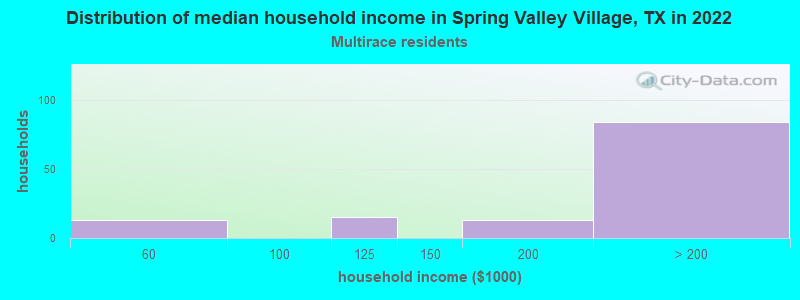
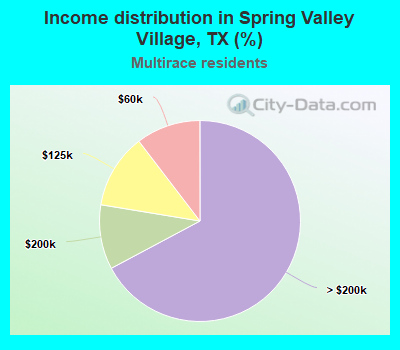
Income statistics for Multirace residents
Median household income in Spring Valley Village, TX in 2022:
Spring Valley Village:
$241,202
State:
$62,748
Number of households with income < $10k:
Spring Valley Village:
0.0% (0)
State:
5.5% (122,324)
Number of households with income $10k - 20k:
Spring Valley Village:
0.0% (0)
Texas:
8.2% (182,232)
Number of households with income $20k - 30k:
Spring Valley Village:
0.0% (0)
State:
8.5% (189,456)
Number of households with income $30k - 40k:
Spring Valley Village:
0.0% (0)
Texas:
8.9% (197,499)
Number of households with income $40k - 50k:
Spring Valley Village:
0.0% (0)
Texas:
8.7% (191,735)
Number of households with income $50k - 60k:
Spring Valley Village:
10.4% (13)
State:
8.0% (177,535)
Number of households with income $60k - 75k:
Spring Valley Village:
0.0% (0)
State:
10.5% (232,479)
Number of households with income $75k - 100k:
Spring Valley Village:
0.0% (0)
State:
13.1% (290,448)
Number of households with income $100k - 125k:
Spring Valley Village:
12.0% (15)
State:
8.6% (191,595)
Number of households with income $125k - 150k:
Spring Valley Village:
0.0% (0)
State:
6.0% (133,361)
Number of households with income $150k - 200k:
Spring Valley Village:
10.4% (13)
Texas:
7.2% (159,195)
Number of households with income > $200k:
Spring Valley Village:
67.2% (84)
State:
6.7% (148,064)
Aggregate household income in Spring Valley Village in 2022: $47,763,615
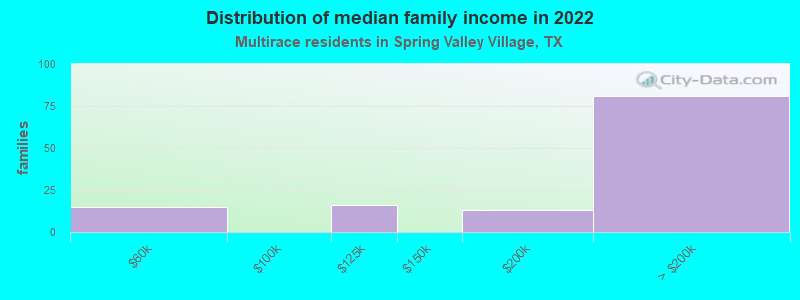
Median family income in Spring Valley Village in 2022:
Spring Valley Village:
$241,108
State:
$69,780
Number of families with income $50k - 60k:
Spring Valley Village:
11.8% (15)
State:
7.9% (127,739)
Number of families with income $100k - 125k:
Spring Valley Village:
12.7% (16)
State:
9.5% (153,597)
Number of families with income $150k - 200k:
Spring Valley Village:
10.4% (13)
State:
8.5% (137,607)
Number of families with income > $200k:
Spring Valley Village:
65.1% (81)
State:
7.9% (127,299)
Median per capita income in Spring Valley Village in 2022:
Spring Valley Village:
$70,672
Texas:
$26,785
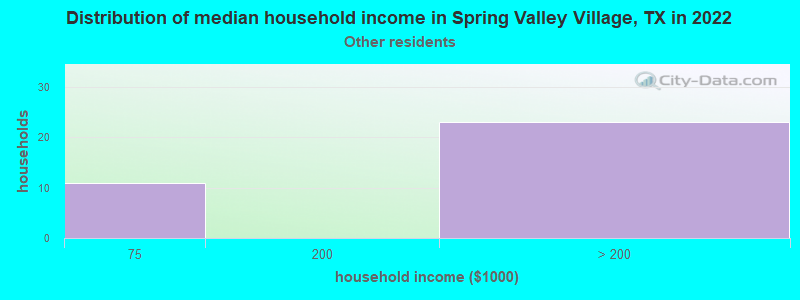
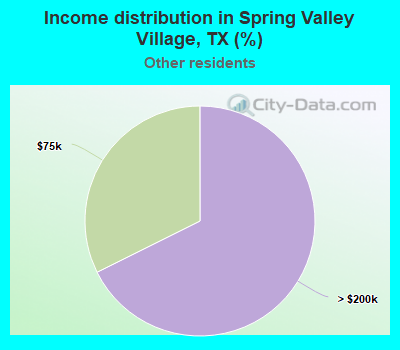
Income statistics for other residents
Number of households with income < $10k:
Spring Valley Village:
0.0% (0)
State:
5.9% (54,162)
Number of households with income $10k - 20k:
Spring Valley Village:
0.0% (0)
State:
6.8% (62,891)
Number of households with income $20k - 30k:
Spring Valley Village:
0.0% (0)
State:
10.6% (97,294)
Number of households with income $30k - 40k:
Spring Valley Village:
0.0% (0)
State:
10.8% (99,670)
Number of households with income $40k - 50k:
Spring Valley Village:
0.0% (0)
State:
9.3% (85,548)
Number of households with income $50k - 60k:
Spring Valley Village:
0.0% (0)
State:
9.0% (82,757)
Number of households with income $60k - 75k:
Spring Valley Village:
32.4% (11)
State:
10.9% (100,326)
Number of households with income $75k - 100k:
Spring Valley Village:
0.0% (0)
State:
14.0% (128,767)
Number of households with income $100k - 125k:
Spring Valley Village:
0.0% (0)
State:
8.2% (75,218)
Number of households with income $125k - 150k:
Spring Valley Village:
0.0% (0)
Texas:
4.8% (44,223)
Number of households with income $150k - 200k:
Spring Valley Village:
0.0% (0)
State:
5.6% (51,376)
Number of households with income > $200k:
Spring Valley Village:
67.6% (23)
State:
4.0% (36,393)
Aggregate household income in Spring Valley Village in 2022: $15,910,476,100
Median per capita income in Spring Valley Village in 2022:
Spring Valley Village:
$165,214
State:
$23,899
Discuss Spring Valley Village, Texas (TX) on our hugely popular Texas forum.