Stonewall, Texas (TX) income map, earnings map, and wages data
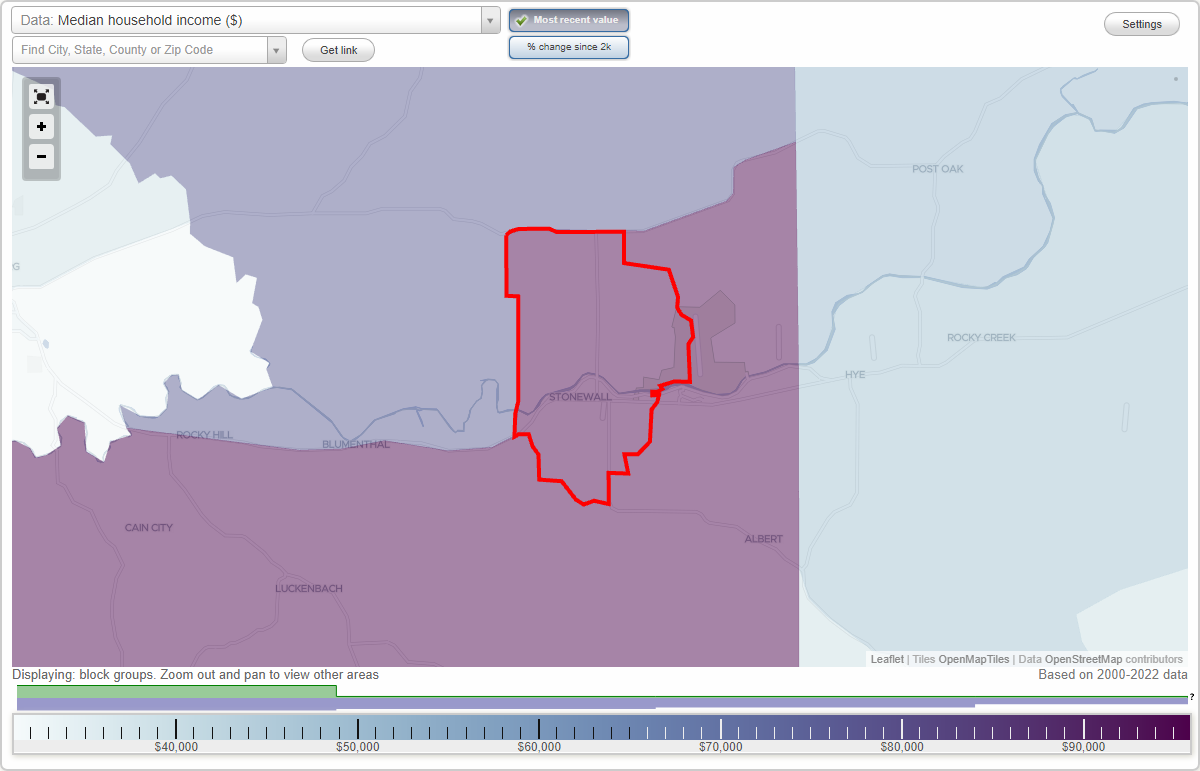
Data:
The per capita income in 2022 was $30,949, which means an increase of 28.8% compared to 2000 when it was $22,035.
Whole page based on the data from 2000 / 2022 when the population of Stonewall, Texas was 469 / 574
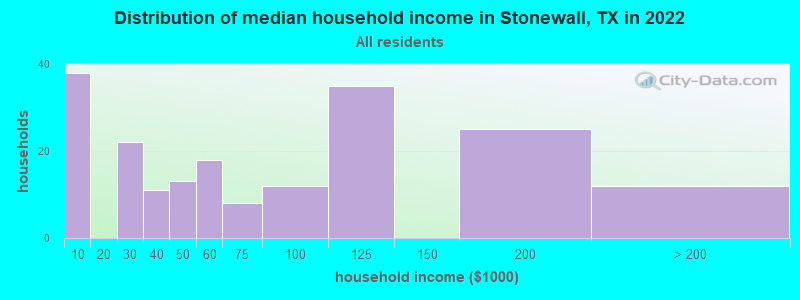
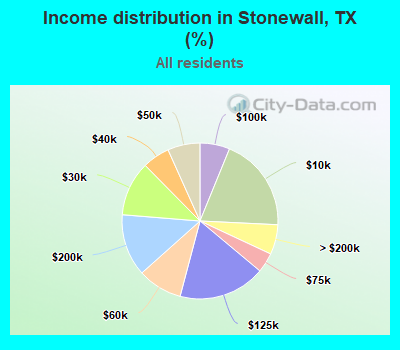
Income statistics for all residents
Number of households with income < $10k:| Stonewall: | 19.6% (38) |
| Texas: | 5.5% (611,011) |
Number of households with income $10k - 20k:| Stonewall: | 0.0% (0) |
| State: | 6.7% (743,157) |
Number of households with income $20k - 30k:| Stonewall: | 11.3% (22) |
| State: | 7.2% (803,381) |
Number of households with income $30k - 40k:| Stonewall: | 5.7% (11) |
| State: | 7.8% (866,080) |
Number of households with income $40k - 50k:| Stonewall: | 6.7% (13) |
| State: | 7.3% (810,440) |
Number of households with income $50k - 60k:| Stonewall: | 9.3% (18) |
| State: | 7.2% (799,783) |
Number of households with income $60k - 75k:| Stonewall: | 4.1% (8) |
| State: | 9.9% (1,095,384) |
Number of households with income $75k - 100k:| Stonewall: | 6.2% (12) |
| State: | 12.8% (1,419,057) |
Number of households with income $100k - 125k:| Stonewall: | 18.0% (35) |
| Texas: | 9.5% (1,054,577) |
Number of households with income $125k - 150k:| Stonewall: | 0.0% (0) |
| State: | 6.7% (741,518) |
Number of households with income $150k - 200k:| Stonewall: | 12.9% (25) |
| State: | 8.7% (961,776) |
Number of households with income > $200k:| Stonewall: | 6.2% (12) |
| State: | 10.7% (1,181,544) |
Aggregate household income in Stonewall in 2022: $15,000,821
Median family income in Stonewall in 2022:| Stonewall: | $64,895 |
| Texas: | $86,267 |
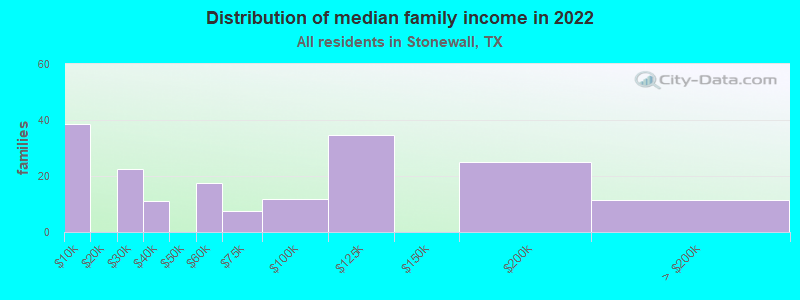
Number of families with income < $10k:| Stonewall: | 21.5% (39) |
| State: | 4.0% (297,884) |
Number of families with income $20k - 30k:| Stonewall: | 12.5% (23) |
| State: | 5.8% (430,949) |
Number of families with income $30k - 40k:| Stonewall: | 6.2% (11) |
| State: | 6.6% (493,535) |
Number of families with income $50k - 60k:| Stonewall: | 9.8% (18) |
| Texas: | 6.6% (492,203) |
Number of families with income $60k - 75k:| Stonewall: | 4.1% (7) |
| State: | 9.5% (710,229) |
Number of families with income $75k - 100k:| Stonewall: | 6.4% (12) |
| Texas: | 13.6% (1,015,480) |
Number of families with income $100k - 125k:| Stonewall: | 19.2% (35) |
| State: | 10.7% (797,961) |
Number of families with income $150k - 200k:| Stonewall: | 13.9% (25) |
| State: | 10.7% (804,459) |
Number of families with income > $200k:| Stonewall: | 6.4% (12) |
| State: | 13.5% (1,013,514) |
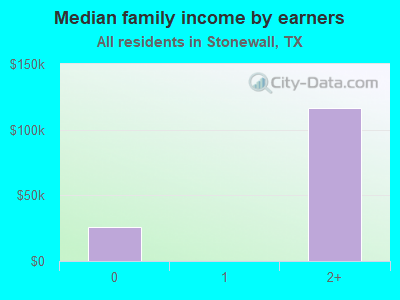
Median income for 4 person families:| Stonewall: | $107,586 |
| State: | $104,562 |
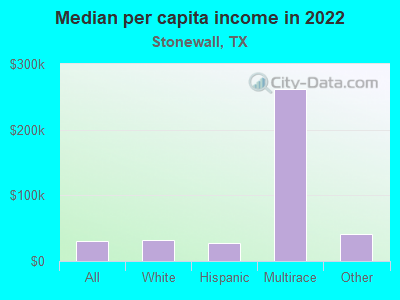
Median per capita income in Stonewall in 2022:| Stonewall: | $30,949 |
| Texas: | $38,123 |
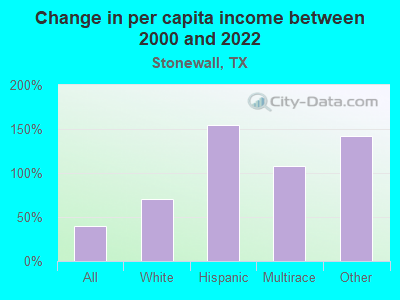
Change in median per capita income between 2000 and 2022:| Stonewall, Texas: | +40.5% |
| State: | +94.3% |
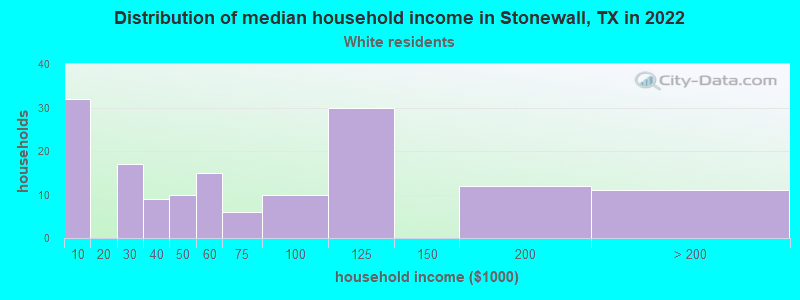
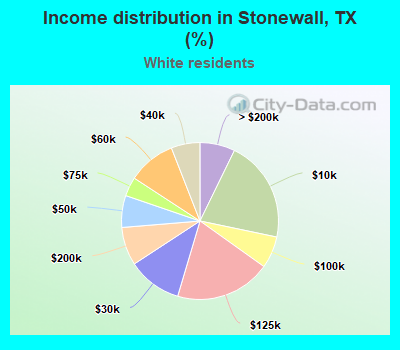
Income statistics for White residents
Median household income in Stonewall, TX in 2022:| Stonewall: | $54,947 |
| State: | $82,032 |
Change in median household income between 2000 and 2022:| Stonewall, Texas: | +74.1% |
| Texas: | +91.0% |
Number of households with income < $10k:| Stonewall: | 21.1% (32) |
| Texas: | 4.7% (273,716) |
Number of households with income $10k - 20k:| Stonewall: | 0.0% (0) |
| Texas: | 5.5% (322,702) |
Number of households with income $20k - 30k:| Stonewall: | 11.2% (17) |
| State: | 6.2% (363,947) |
Number of households with income $30k - 40k:| Stonewall: | 5.9% (9) |
| State: | 6.8% (399,275) |
Number of households with income $40k - 50k:| Stonewall: | 6.6% (10) |
| State: | 6.5% (383,417) |
Number of households with income $50k - 60k:| Stonewall: | 9.9% (15) |
| State: | 6.6% (388,535) |
Number of households with income $60k - 75k:| Stonewall: | 3.9% (6) |
| State: | 9.7% (566,295) |
Number of households with income $75k - 100k:| Stonewall: | 6.6% (10) |
| State: | 13.0% (760,276) |
Number of households with income $100k - 125k:| Stonewall: | 19.7% (30) |
| Texas: | 10.2% (597,596) |
Number of households with income $125k - 150k:| Stonewall: | 0.0% (0) |
| Texas: | 7.4% (436,830) |
Number of households with income $150k - 200k:| Stonewall: | 7.9% (12) |
| State: | 9.9% (583,067) |
Number of households with income > $200k:| Stonewall: | 7.2% (11) |
| Texas: | 13.5% (792,647) |
Aggregate household income in Stonewall in 2022: $11,527,662
Median per capita income in Stonewall in 2022:| Stonewall: | $31,471 |
| State: | $47,740 |
Change in median per capita income between 2000 and 2022:| Stonewall, Texas: | +70.8% |
| State: | +114.3% |
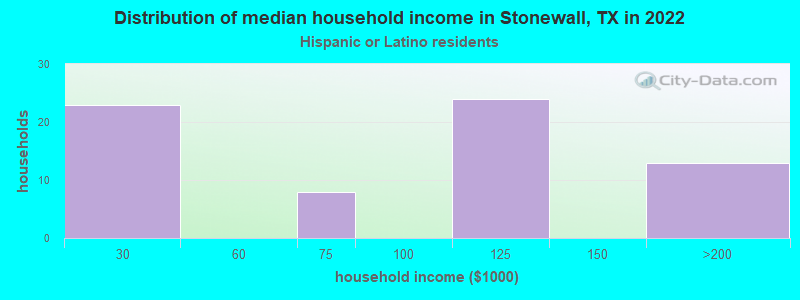
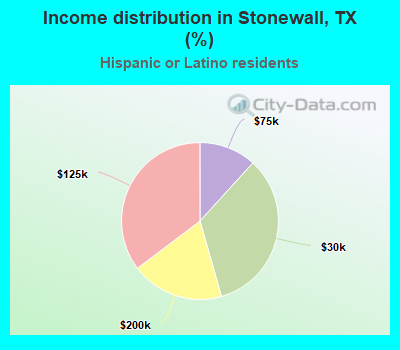
Income statistics for Hispanic or Latino residents
Number of households with income < $10k:| Stonewall: | 0.0% (0) |
| State: | 5.8% (213,953) |
Number of households with income $10k - 20k:| Stonewall: | 0.0% (0) |
| Texas: | 8.0% (297,456) |
Number of households with income $20k - 30k:| Stonewall: | 33.8% (23) |
| Texas: | 9.2% (340,166) |
Number of households with income $30k - 40k:| Stonewall: | 0.0% (0) |
| Texas: | 9.5% (354,336) |
Number of households with income $40k - 50k:| Stonewall: | 0.0% (0) |
| State: | 8.8% (327,013) |
Number of households with income $50k - 60k:| Stonewall: | 0.0% (0) |
| State: | 8.3% (308,818) |
Number of households with income $60k - 75k:| Stonewall: | 11.8% (8) |
| State: | 10.9% (405,109) |
Number of households with income $75k - 100k:| Stonewall: | 0.0% (0) |
| State: | 13.8% (511,639) |
Number of households with income $100k - 125k:| Stonewall: | 35.3% (24) |
| Texas: | 8.6% (319,728) |
Number of households with income $125k - 150k:| Stonewall: | 0.0% (0) |
| Texas: | 5.7% (210,932) |
Number of households with income $150k - 200k:| Stonewall: | 19.1% (13) |
| State: | 6.4% (236,055) |
Number of households with income > $200k:| Stonewall: | 0.0% (0) |
| Texas: | 5.1% (189,259) |
Aggregate household income in Stonewall in 2022: $5,807,390
Median per capita income in Stonewall in 2022:| Stonewall: | $27,542 |
| State: | $24,862 |
Income statistics for Multirace residents
Median per capita income in Stonewall in 2022:| Stonewall: | $262,660 |
| Texas: | $26,785 |
Change in median per capita income between 2000 and 2022:| Stonewall, Texas: | +108.4% |
| State: | +110.9% |
Income statistics for other residents
Number of households with income < $10k:| Stonewall: | 0.0% (0) |
| Texas: | 5.9% (54,162) |
Number of households with income $10k - 20k:| Stonewall: | 0.0% (0) |
| State: | 6.8% (62,891) |
Number of households with income $20k - 30k:| Stonewall: | 0.0% (0) |
| State: | 10.6% (97,294) |
Number of households with income $30k - 40k:| Stonewall: | 0.0% (0) |
| State: | 10.8% (99,670) |
Number of households with income $40k - 50k:| Stonewall: | 0.0% (0) |
| Texas: | 9.3% (85,548) |
Number of households with income $50k - 60k:| Stonewall: | 0.0% (0) |
| State: | 9.0% (82,757) |
Number of households with income $60k - 75k:| Stonewall: | 0.0% (0) |
| State: | 10.9% (100,326) |
Number of households with income $75k - 100k:| Stonewall: | 0.0% (0) |
| State: | 14.0% (128,767) |
Number of households with income $100k - 125k:| Stonewall: | 0.0% (0) |
| State: | 8.2% (75,218) |
Number of households with income $125k - 150k:| Stonewall: | 0.0% (0) |
| State: | 4.8% (44,223) |
Number of households with income $150k - 200k:| Stonewall: | 100.0% (17) |
| Texas: | 5.6% (51,376) |
Number of households with income > $200k:| Stonewall: | 0.0% (0) |
| State: | 4.0% (36,393) |
Aggregate household income in Stonewall in 2022: $18,515,224
Median per capita income in Stonewall in 2022:| Stonewall: | $40,937 |
| State: | $23,899 |
Change in median per capita income between 2000 and 2022:| Stonewall, Texas: | +141.8% |
| State: | +135.2% |