The median household income in Sun Valley, NV in 2022 was $70,238, which was 3.0% less than the median annual income of $72,333 across the entire state of Nevada. Compared to the median income of $41,346 in 2000 this represents an increase of 41.1%. The per capita income in 2022 was $26,225, which means an increase of 42.2% compared to 2000 when it was $15,171.
Whole page based on the data from 2000 / 2022 when the population of Sun Valley, Nevada was 19,461 / 23,246
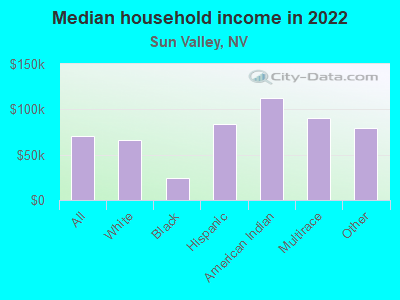
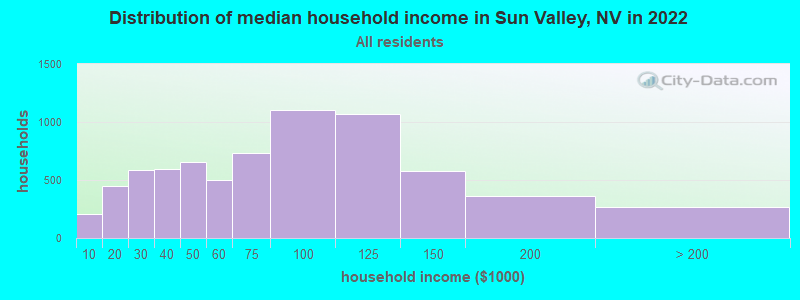
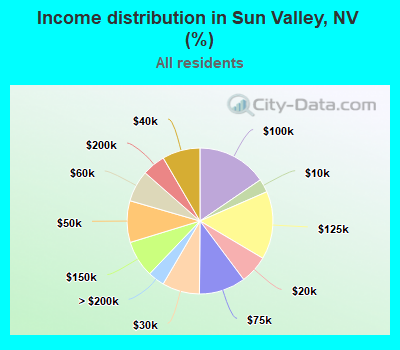
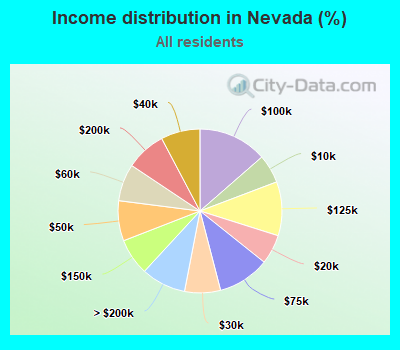
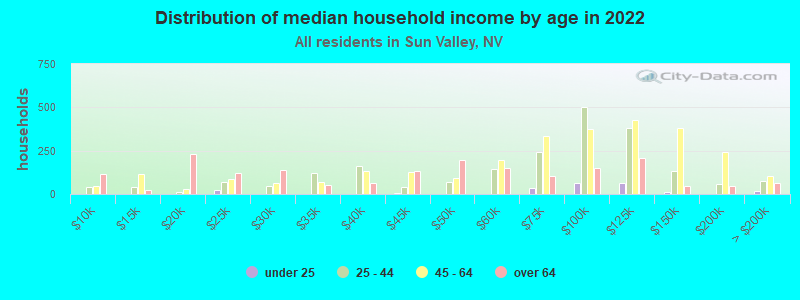
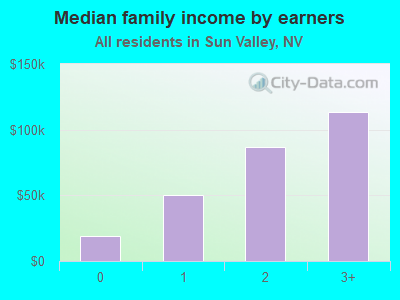
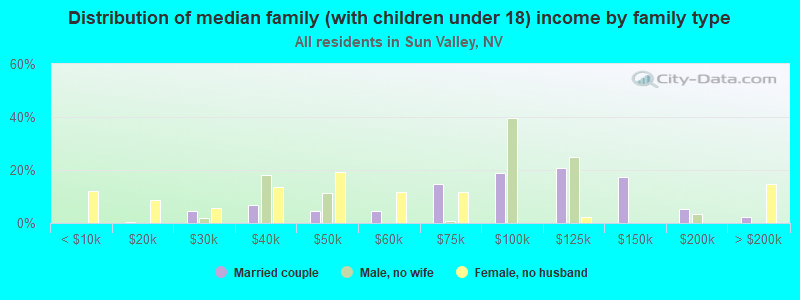
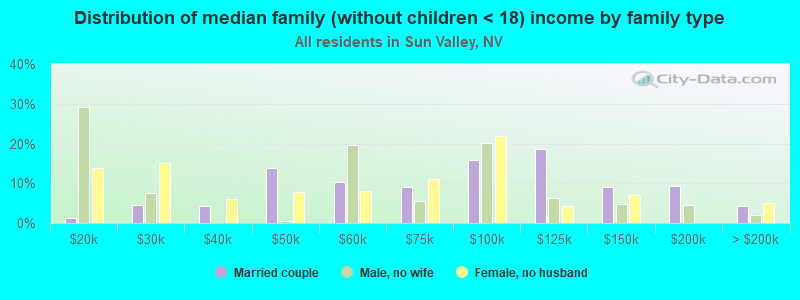
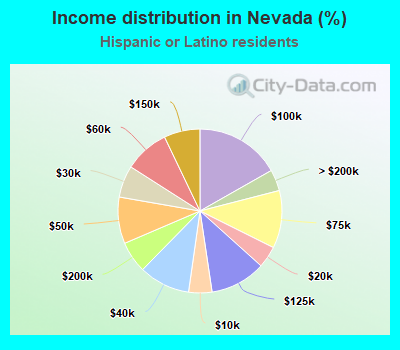
Income statistics for all residents
Median household income in Sun Valley, NV in 2022:
Sun Valley:
$70,238
State:
$72,333
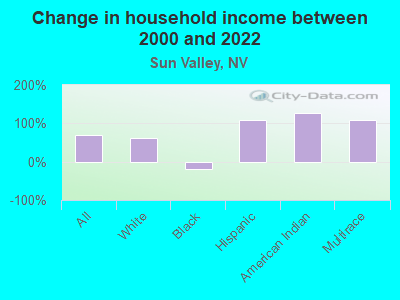
Change in median household income between 2000 and 2022:
Sun Valley, Nevada:
+69.9%
Nevada:
+62.3%
Number of households with income < $10k:
Sun Valley:
3.0% (210)
State:
5.6% (67,608)
Number of households with income $10k - 20k:
Sun Valley:
6.3% (445)
State:
5.8% (69,869)
Number of households with income $20k - 30k:
Sun Valley:
8.3% (590)
Nevada:
7.1% (84,856)
Number of households with income $30k - 40k:
Sun Valley:
8.4% (597)
State:
7.7% (92,600)
Number of households with income $40k - 50k:
Sun Valley:
9.2% (656)
Nevada:
7.9% (94,898)
Number of households with income $50k - 60k:
Sun Valley:
7.0% (497)
State:
7.3% (88,037)
Number of households with income $60k - 75k:
Sun Valley:
10.3% (735)
State:
10.2% (122,705)
Number of households with income $75k - 100k:
Sun Valley:
15.5% (1,101)
State:
13.6% (162,870)
Number of households with income $100k - 125k:
Sun Valley:
15.1% (1,073)
State:
10.7% (127,735)
Number of households with income $125k - 150k:
Sun Valley:
8.1% (578)
State:
7.3% (86,891)
Number of households with income $150k - 200k:
Sun Valley:
5.1% (364)
Nevada:
7.9% (94,679)
Number of households with income > $200k:
Sun Valley:
3.7% (263)
Nevada:
8.8% (105,608)
Aggregate household income in Sun Valley in 2022: $601,049,330
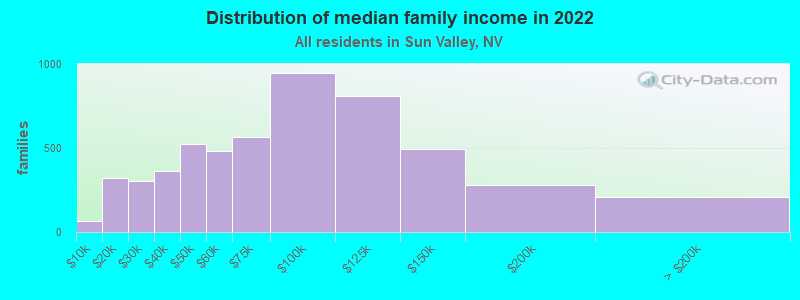
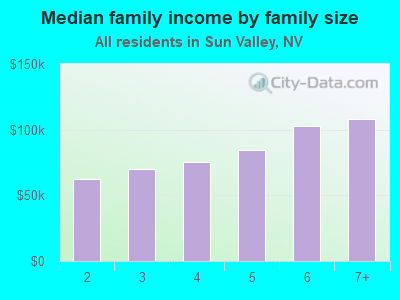
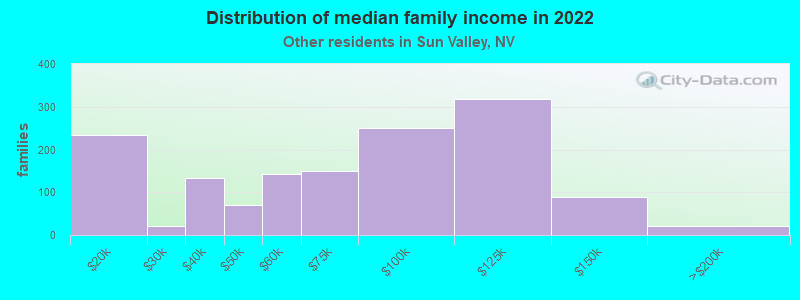
Median family income in Sun Valley in 2022:
Sun Valley:
$72,274
State:
$85,593
Number of families with income < $10k:
Sun Valley:
1.3% (67)
Nevada:
3.8% (29,474)
Number of families with income $10k - 20k:
Sun Valley:
6.0% (321)
Nevada:
3.6% (27,496)
Number of families with income $20k - 30k:
Sun Valley:
5.7% (305)
State:
4.9% (38,200)
Number of families with income $30k - 40k:
Sun Valley:
6.8% (362)
State:
6.2% (48,328)
Number of families with income $40k - 50k:
Sun Valley:
9.7% (522)
State:
7.4% (57,137)
Number of families with income $50k - 60k:
Sun Valley:
9.0% (481)
State:
6.7% (52,099)
Number of families with income $60k - 75k:
Sun Valley:
10.5% (563)
Nevada:
10.3% (79,628)
Number of families with income $75k - 100k:
Sun Valley:
17.6% (945)
Nevada:
15.3% (118,105)
Number of families with income $100k - 125k:
Sun Valley:
15.1% (808)
State:
12.4% (96,131)
Number of families with income $125k - 150k:
Sun Valley:
9.2% (494)
State:
8.7% (67,275)
Number of families with income $150k - 200k:
Sun Valley:
5.3% (282)
Nevada:
9.7% (74,888)
Number of families with income > $200k:
Sun Valley:
3.9% (210)
Nevada:
11.0% (84,905)
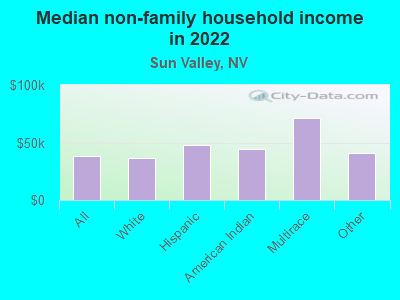
Median non-family income in Sun Valley in 2022:
Sun Valley:
$38,075
Nevada:
$46,176
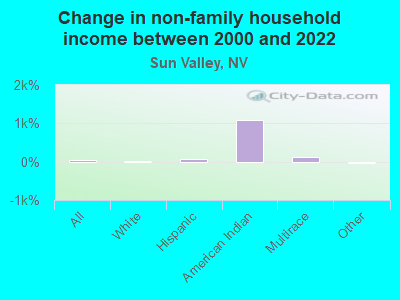
Change in median non-family income between 2000 and 2022:
Sun Valley, Nevada:
+32.4%
State:
+53.5%
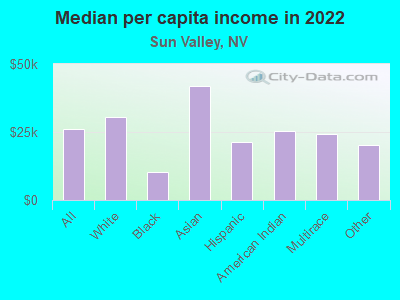
Median per capita income in Sun Valley in 2022:
Sun Valley:
$26,225
Nevada:
$38,183
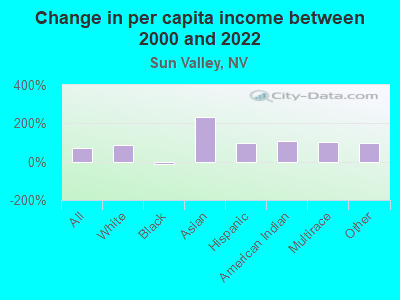
Change in median per capita income between 2000 and 2022:
Sun Valley, Nevada:
+72.9%
State:
+73.6%
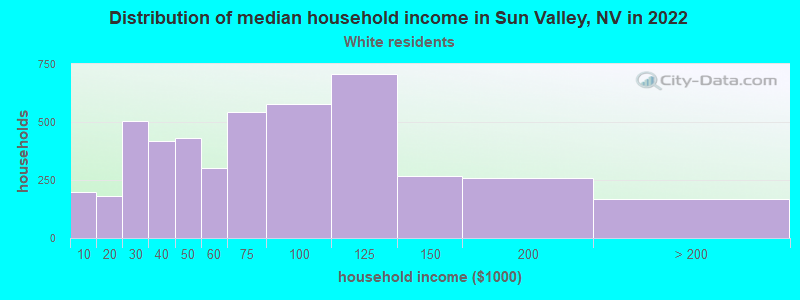
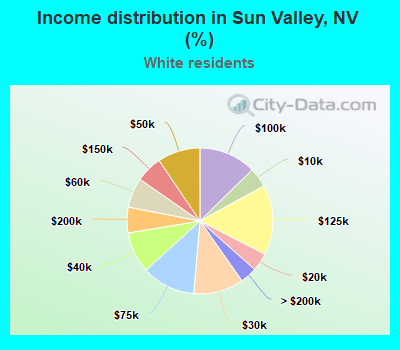
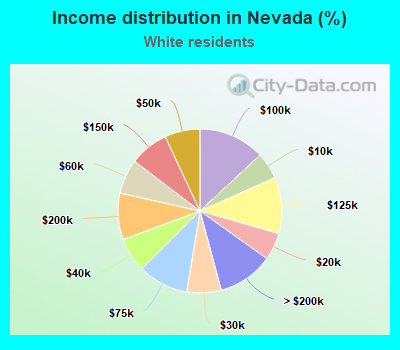
Income statistics for White residents
Median household income in Sun Valley, NV in 2022:
Sun Valley:
$65,847
State:
$78,201
Change in median household income between 2000 and 2022:
Sun Valley, Nevada:
+61.8%
Nevada:
+68.9%
Number of households with income < $10k:
Sun Valley:
4.4% (199)
State:
5.3% (36,449)
Number of households with income $10k - 20k:
Sun Valley:
4.0% (183)
Nevada:
5.4% (37,351)
Number of households with income $20k - 30k:
Sun Valley:
11.1% (506)
State:
6.8% (46,880)
Number of households with income $30k - 40k:
Sun Valley:
9.1% (416)
State:
6.8% (46,939)
Number of households with income $40k - 50k:
Sun Valley:
9.5% (431)
Nevada:
7.0% (48,126)
Number of households with income $50k - 60k:
Sun Valley:
6.6% (302)
Nevada:
6.9% (47,402)
Number of households with income $60k - 75k:
Sun Valley:
11.9% (541)
State:
10.0% (68,993)
Number of households with income $75k - 100k:
Sun Valley:
12.7% (577)
State:
13.1% (90,439)
Number of households with income $100k - 125k:
Sun Valley:
15.5% (707)
Nevada:
11.1% (77,026)
Number of households with income $125k - 150k:
Sun Valley:
5.9% (267)
Nevada:
7.7% (53,064)
Number of households with income $150k - 200k:
Sun Valley:
5.7% (259)
State:
9.2% (63,350)
Number of households with income > $200k:
Sun Valley:
3.7% (170)
State:
11.0% (75,795)
Aggregate household income in Sun Valley in 2022: $375,307,588
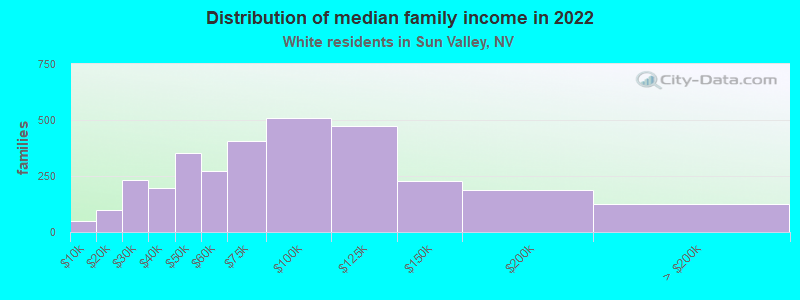
Median family income in Sun Valley in 2022:
Sun Valley:
$71,435
State:
$96,356
Number of families with income < $10k:
Sun Valley:
1.5% (48)
State:
3.2% (13,462)
Number of families with income $10k - 20k:
Sun Valley:
3.1% (99)
State:
2.8% (11,864)
Number of families with income $20k - 30k:
Sun Valley:
7.5% (234)
State:
4.1% (17,424)
Number of families with income $30k - 40k:
Sun Valley:
6.3% (196)
State:
4.9% (21,005)
Number of families with income $40k - 50k:
Sun Valley:
11.3% (353)
State:
6.2% (26,302)
Number of families with income $50k - 60k:
Sun Valley:
8.7% (272)
Nevada:
6.1% (26,174)
Number of families with income $60k - 75k:
Sun Valley:
12.9% (405)
State:
9.7% (41,339)
Number of families with income $75k - 100k:
Sun Valley:
16.2% (507)
State:
14.9% (63,685)
Number of families with income $100k - 125k:
Sun Valley:
15.2% (475)
State:
13.1% (56,000)
Number of families with income $125k - 150k:
Sun Valley:
7.3% (228)
State:
9.3% (39,853)
Number of families with income $150k - 200k:
Sun Valley:
6.1% (189)
State:
11.6% (49,473)
Number of families with income > $200k:
Sun Valley:
3.9% (123)
State:
14.1% (60,154)
Median non-family income in Sun Valley in 2022:
Sun Valley:
$36,600
Nevada:
$49,909
Change in median non-family income between 2000 and 2022:
Sun Valley, Nevada:
+27.4%
Nevada:
+62.2%
Median per capita income in Sun Valley in 2022:
Sun Valley:
$30,500
State:
$47,995
Change in median per capita income between 2000 and 2022:
Sun Valley, Nevada:
+89.4%
State:
+98.1%
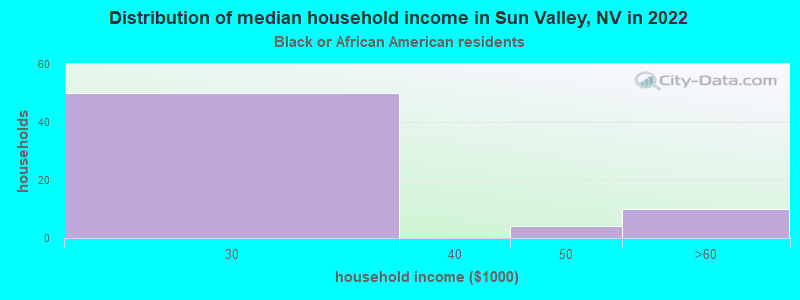
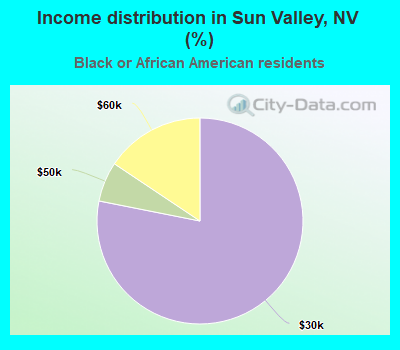
Income statistics for Black or African American residents
Median household income in Sun Valley, NV in 2022:
Sun Valley:
$24,599
State:
$49,549
Change in median household income between 2000 and 2022:: -19.7%
Sun Valley, Nevada:
-19.7%
Nevada:
+47.3%
Number of households with income < $10k:
Sun Valley:
0.0% (0)
State:
10.1% (11,664)
Number of households with income $10k - 20k:
Sun Valley:
0.0% (0)
Nevada:
9.5% (11,045)
Number of households with income $20k - 30k:
Sun Valley:
78.1% (50)
Nevada:
10.9% (12,647)
Number of households with income $30k - 40k:
Sun Valley:
0.0% (0)
State:
9.9% (11,494)
Number of households with income $40k - 50k:
Sun Valley:
6.2% (4)
State:
10.1% (11,683)
Number of households with income $50k - 60k:
Sun Valley:
15.6% (10)
State:
8.1% (9,366)
Number of households with income $60k - 75k:
Sun Valley:
0.0% (0)
State:
10.1% (11,759)
Number of households with income $75k - 100k:
Sun Valley:
0.0% (0)
Nevada:
11.6% (13,424)
Number of households with income $100k - 125k:
Sun Valley:
0.0% (0)
Nevada:
7.3% (8,480)
Number of households with income $125k - 150k:
Sun Valley:
0.0% (0)
Nevada:
4.4% (5,098)
Number of households with income $150k - 200k:
Sun Valley:
0.0% (0)
State:
3.8% (4,417)
Number of households with income > $200k:
Sun Valley:
0.0% (0)
State:
4.3% (4,965)
Aggregate household income in Sun Valley in 2022: $1,850,545
Median per capita income in Sun Valley in 2022:
Sun Valley:
$10,153
State:
$28,788
Change in median per capita income between 2000 and 2022:: -12.9%
Sun Valley, Nevada:
-12.9%
State:
+72.3%
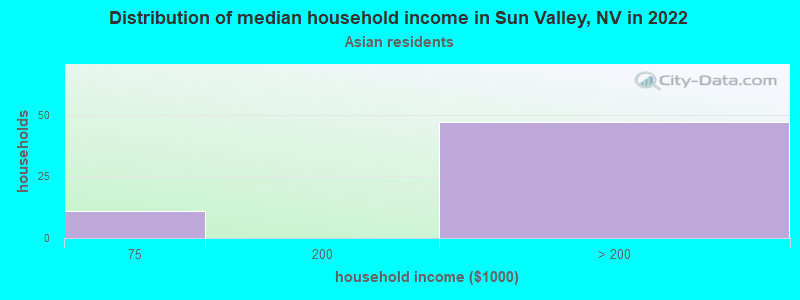
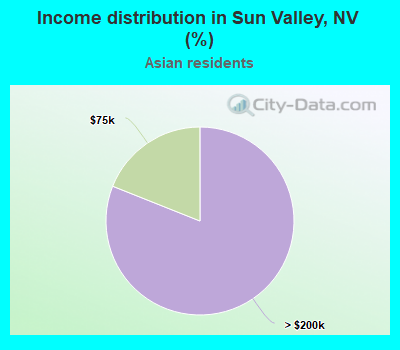
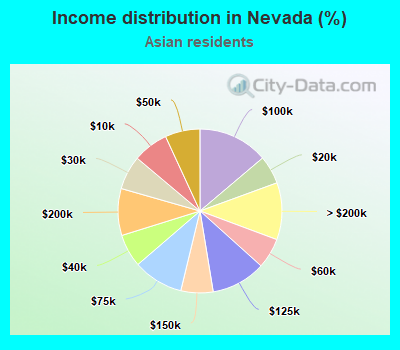
Income statistics for Asian residents
Number of households with income < $10k:
Sun Valley:
0.0% (0)
State:
7.0% (7,099)
Number of households with income $10k - 20k:
Sun Valley:
0.0% (0)
Nevada:
5.6% (5,682)
Number of households with income $20k - 30k:
Sun Valley:
0.0% (0)
State:
6.7% (6,820)
Number of households with income $30k - 40k:
Sun Valley:
0.0% (0)
Nevada:
6.5% (6,583)
Number of households with income $40k - 50k:
Sun Valley:
0.0% (0)
Nevada:
6.9% (6,984)
Number of households with income $50k - 60k:
Sun Valley:
0.0% (0)
Nevada:
6.0% (6,068)
Number of households with income $60k - 75k:
Sun Valley:
19.0% (11)
Nevada:
9.9% (10,078)
Number of households with income $75k - 100k:
Sun Valley:
0.0% (0)
State:
13.8% (14,050)
Number of households with income $100k - 125k:
Sun Valley:
0.0% (0)
State:
10.8% (10,934)
Number of households with income $125k - 150k:
Sun Valley:
0.0% (0)
Nevada:
6.4% (6,456)
Number of households with income $150k - 200k:
Sun Valley:
0.0% (0)
Nevada:
9.2% (9,397)
Number of households with income > $200k:
Sun Valley:
81.0% (47)
State:
11.3% (11,447)
Aggregate household income in Sun Valley in 2022: $13,709,079
Median per capita income in Sun Valley in 2022:
Sun Valley:
$41,806
State:
$41,086
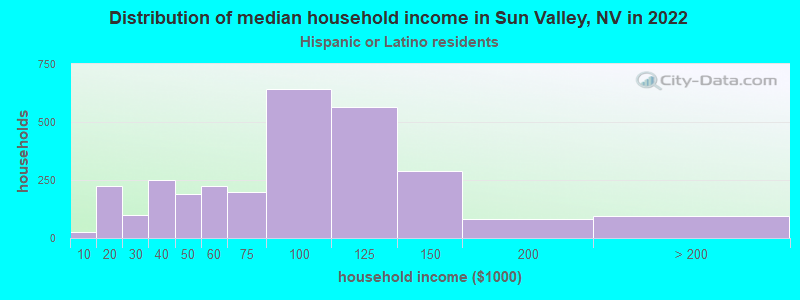
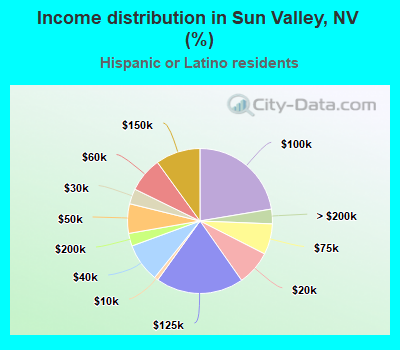
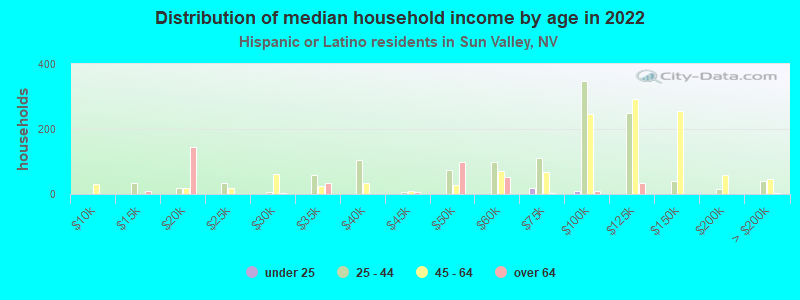
Income statistics for Hispanic or Latino residents
Median household income in Sun Valley, NV in 2022:
Sun Valley:
$83,704
State:
$68,581
Change in median household income between 2000 and 2022:
Sun Valley, Nevada:
+110.2%
State:
+80.3%
Number of households with income < $10k:
Sun Valley:
0.9% (25)
State:
4.6% (12,224)
Number of households with income $10k - 20k:
Sun Valley:
7.8% (223)
State:
4.3% (11,419)
Number of households with income $20k - 30k:
Sun Valley:
3.4% (98)
Nevada:
6.3% (16,728)
Number of households with income $30k - 40k:
Sun Valley:
8.6% (248)
State:
10.1% (26,750)
Number of households with income $40k - 50k:
Sun Valley:
6.6% (189)
State:
9.2% (24,344)
Number of households with income $50k - 60k:
Sun Valley:
7.8% (223)
State:
8.8% (23,471)
Number of households with income $60k - 75k:
Sun Valley:
6.9% (197)
Nevada:
11.4% (30,149)
Number of households with income $75k - 100k:
Sun Valley:
22.4% (643)
State:
16.8% (44,550)
Number of households with income $100k - 125k:
Sun Valley:
19.6% (564)
Nevada:
11.0% (29,133)
Number of households with income $125k - 150k:
Sun Valley:
10.0% (287)
State:
7.1% (18,850)
Number of households with income $150k - 200k:
Sun Valley:
2.9% (82)
Nevada:
6.2% (16,523)
Number of households with income > $200k:
Sun Valley:
3.3% (94)
State:
4.2% (11,154)
Aggregate household income in Sun Valley in 2022: $242,420,126
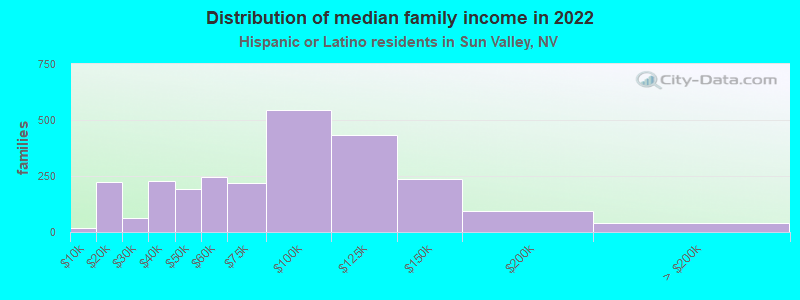
Median family income in Sun Valley in 2022:
Sun Valley:
$79,746
State:
$72,789
Number of families with income < $10k:
Sun Valley:
0.6% (16)
Nevada:
4.2% (8,462)
Number of families with income $10k - 20k:
Sun Valley:
8.9% (225)
State:
3.4% (6,823)
Number of families with income $20k - 30k:
Sun Valley:
2.5% (64)
State:
5.7% (11,542)
Number of families with income $30k - 40k:
Sun Valley:
9.0% (227)
Nevada:
8.8% (17,635)
Number of families with income $40k - 50k:
Sun Valley:
7.5% (190)
State:
9.1% (18,242)
Number of families with income $50k - 60k:
Sun Valley:
9.7% (246)
Nevada:
8.8% (17,626)
Number of families with income $60k - 75k:
Sun Valley:
8.6% (217)
State:
12.1% (24,335)
Number of families with income $75k - 100k:
Sun Valley:
21.5% (544)
Nevada:
17.9% (35,984)
Number of families with income $100k - 125k:
Sun Valley:
17.1% (432)
State:
10.8% (21,730)
Number of families with income $125k - 150k:
Sun Valley:
9.3% (235)
State:
7.8% (15,764)
Number of families with income $150k - 200k:
Sun Valley:
3.7% (94)
Nevada:
6.6% (13,251)
Number of families with income > $200k:
Sun Valley:
1.7% (42)
State:
4.9% (9,843)
Median non-family income in Sun Valley in 2022:
Sun Valley:
$48,259
State:
$44,232
Change in median non-family income between 2000 and 2022:
Sun Valley, Nevada:
+58.4%
State:
+66.8%
Median per capita income in Sun Valley in 2022:
Sun Valley:
$21,218
Nevada:
$24,350
Change in median per capita income between 2000 and 2022:
Sun Valley, Nevada:
+97.0%
Nevada:
+96.3%
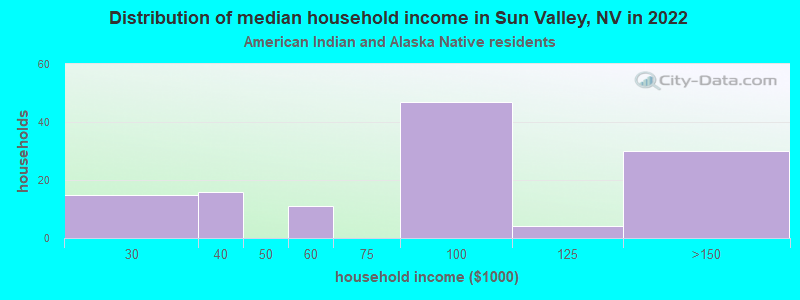
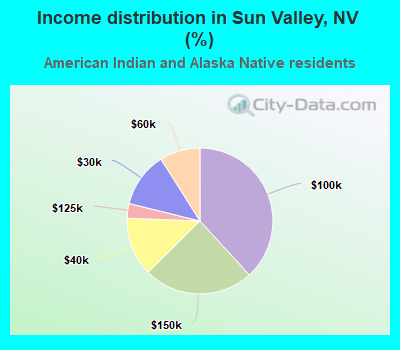
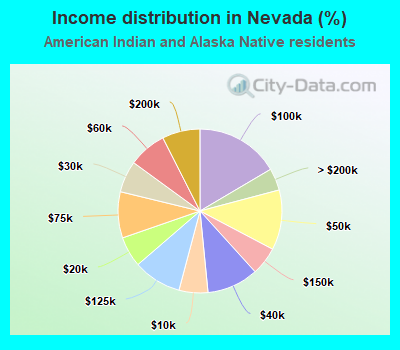
Income statistics for American Indian and Alaska Native residents
Median household income in Sun Valley, NV in 2022:
Sun Valley:
$112,371
State:
$64,492
Change in median household income between 2000 and 2022:
Sun Valley, Nevada:
+126.4%
State:
+84.7%
Number of households with income < $10k:
Sun Valley:
0.0% (0)
State:
5.7% (901)
Number of households with income $10k - 20k:
Sun Valley:
0.0% (0)
State:
6.0% (950)
Number of households with income $20k - 30k:
Sun Valley:
12.2% (15)
Nevada:
6.3% (987)
Number of households with income $30k - 40k:
Sun Valley:
13.0% (16)
State:
10.2% (1,603)
Number of households with income $40k - 50k:
Sun Valley:
0.0% (0)
State:
11.8% (1,870)
Number of households with income $50k - 60k:
Sun Valley:
8.9% (11)
State:
7.5% (1,182)
Number of households with income $60k - 75k:
Sun Valley:
0.0% (0)
State:
9.1% (1,436)
Number of households with income $75k - 100k:
Sun Valley:
38.2% (47)
State:
16.5% (2,607)
Number of households with income $100k - 125k:
Sun Valley:
3.3% (4)
Nevada:
9.5% (1,505)
Number of households with income $125k - 150k:
Sun Valley:
24.4% (30)
State:
5.6% (879)
Number of households with income $150k - 200k:
Sun Valley:
0.0% (0)
State:
7.5% (1,180)
Number of households with income > $200k:
Sun Valley:
0.0% (0)
Nevada:
4.4% (689)
Aggregate household income in Sun Valley in 2022: $11,020,897
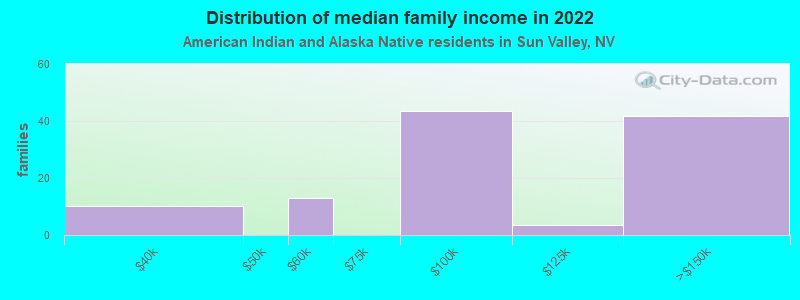
Median family income in Sun Valley in 2022:
Sun Valley:
$102,259
State:
$71,652
Number of families with income $30k - 40k:
Sun Valley:
9.1% (10)
State:
10.2% (1,062)
Number of families with income $50k - 60k:
Sun Valley:
11.6% (13)
Nevada:
8.3% (871)
Number of families with income $75k - 100k:
Sun Valley:
39.0% (44)
State:
16.7% (1,742)
Number of families with income $100k - 125k:
Sun Valley:
3.0% (3)
State:
9.8% (1,025)
Number of families with income $125k - 150k:
Sun Valley:
37.3% (42)
State:
7.1% (745)
Median non-family income in Sun Valley in 2022:
Sun Valley:
$44,452
State:
$42,455
Median per capita income in Sun Valley in 2022:
Sun Valley:
$25,502
Nevada:
$25,065
Change in median per capita income between 2000 and 2022:
Sun Valley, Nevada:
+105.9%
State:
+62.9%
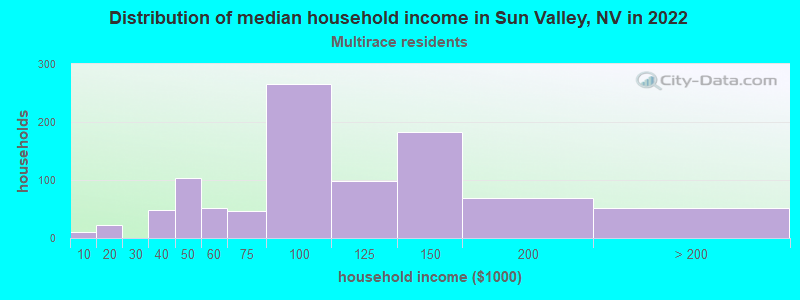
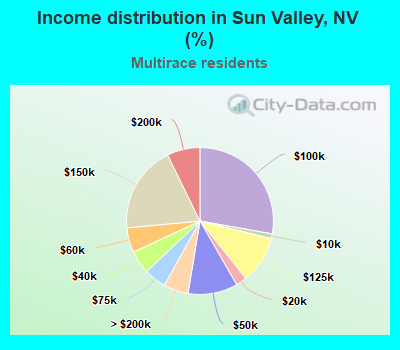
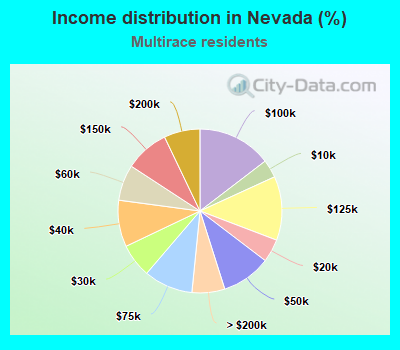
Income statistics for Multirace residents
Median household income in Sun Valley, NV in 2022:
Sun Valley:
$90,575
Nevada:
$74,091
Change in median household income between 2000 and 2022:
Sun Valley, Nevada:
+107.9%
State:
+87.5%
Number of households with income < $10k:
Sun Valley:
1.1% (10)
State:
3.6% (5,458)
Number of households with income $10k - 20k:
Sun Valley:
2.4% (23)
State:
4.6% (6,994)
Number of households with income $20k - 30k:
Sun Valley:
0.0% (0)
Nevada:
6.6% (10,153)
Number of households with income $30k - 40k:
Sun Valley:
5.1% (49)
State:
9.2% (14,065)
Number of households with income $40k - 50k:
Sun Valley:
10.9% (104)
State:
9.7% (14,888)
Number of households with income $50k - 60k:
Sun Valley:
5.5% (52)
Nevada:
7.1% (10,814)
Number of households with income $60k - 75k:
Sun Valley:
4.8% (46)
State:
9.7% (14,785)
Number of households with income $75k - 100k:
Sun Valley:
27.8% (265)
State:
14.6% (22,312)
Number of households with income $100k - 125k:
Sun Valley:
10.4% (99)
Nevada:
12.6% (19,262)
Number of households with income $125k - 150k:
Sun Valley:
19.2% (183)
Nevada:
8.7% (13,275)
Number of households with income $150k - 200k:
Sun Valley:
7.2% (69)
State:
7.1% (10,851)
Number of households with income > $200k:
Sun Valley:
5.5% (52)
State:
6.5% (9,903)
Aggregate household income in Sun Valley in 2022: $95,963,599
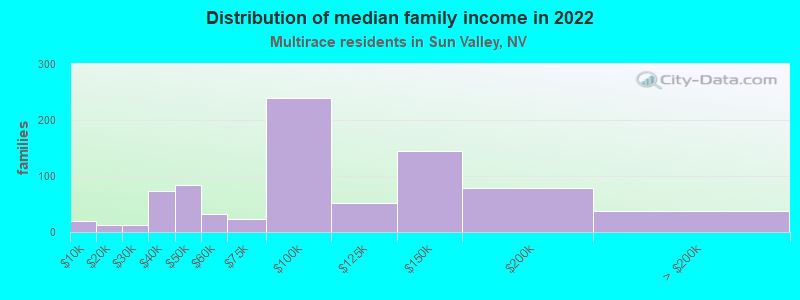
Median family income in Sun Valley in 2022:
Sun Valley:
$88,590
State:
$79,013
Number of families with income < $10k:
Sun Valley:
2.3% (19)
State:
2.8% (3,068)
Number of families with income $10k - 20k:
Sun Valley:
1.5% (12)
State:
3.2% (3,527)
Number of families with income $20k - 30k:
Sun Valley:
1.7% (13)
Nevada:
6.0% (6,593)
Number of families with income $30k - 40k:
Sun Valley:
9.2% (74)
Nevada:
6.6% (7,240)
Number of families with income $40k - 50k:
Sun Valley:
10.4% (84)
State:
9.1% (9,970)
Number of families with income $50k - 60k:
Sun Valley:
4.1% (33)
Nevada:
8.1% (8,868)
Number of families with income $60k - 75k:
Sun Valley:
2.8% (23)
Nevada:
10.9% (11,869)
Number of families with income $75k - 100k:
Sun Valley:
29.7% (240)
State:
14.4% (15,706)
Number of families with income $100k - 125k:
Sun Valley:
6.3% (51)
Nevada:
12.8% (13,988)
Number of families with income $125k - 150k:
Sun Valley:
17.8% (144)
State:
9.5% (10,430)
Number of families with income $150k - 200k:
Sun Valley:
9.6% (78)
State:
8.4% (9,209)
Number of families with income > $200k:
Sun Valley:
4.6% (37)
Nevada:
8.1% (8,871)
Median non-family income in Sun Valley in 2022:
Sun Valley:
$71,504
State:
$46,680
Change in median non-family income between 2000 and 2022:
Sun Valley, Nevada:
+130.0%
State:
+66.3%
Median per capita income in Sun Valley in 2022:
Sun Valley:
$24,177
Nevada:
$26,832
Change in median per capita income between 2000 and 2022:
Sun Valley, Nevada:
+101.6%
Nevada:
+98.9%
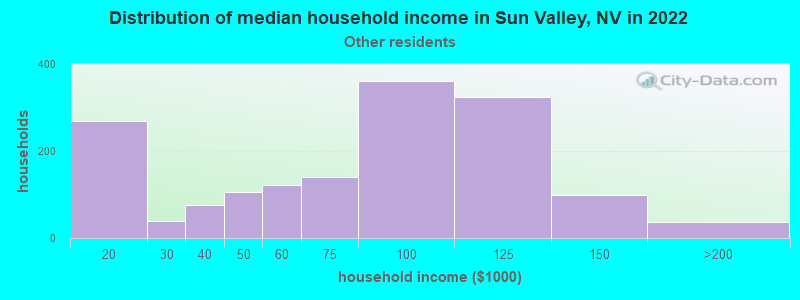
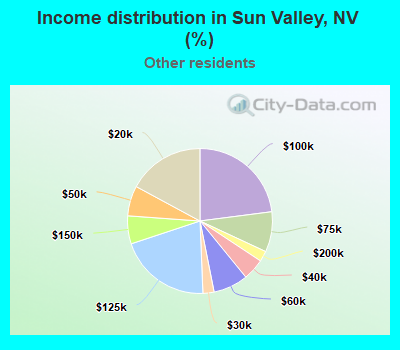
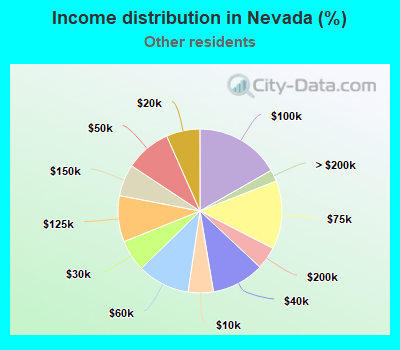
Income statistics for other residents
Median household income in Sun Valley, NV in 2022:
Sun Valley:
$79,569
State:
$62,021
Number of households with income < $10k:
Sun Valley:
0.0% (0)
Nevada:
5.0% (5,632)
Number of households with income $10k - 20k:
Sun Valley:
17.1% (269)
State:
6.6% (7,517)
Number of households with income $20k - 30k:
Sun Valley:
2.5% (39)
State:
6.2% (7,053)
Number of households with income $30k - 40k:
Sun Valley:
4.8% (76)
Nevada:
10.4% (11,739)
Number of households with income $40k - 50k:
Sun Valley:
6.7% (106)
Nevada:
9.1% (10,276)
Number of households with income $50k - 60k:
Sun Valley:
7.8% (122)
State:
10.3% (11,711)
Number of households with income $60k - 75k:
Sun Valley:
9.0% (141)
State:
13.5% (15,261)
Number of households with income $75k - 100k:
Sun Valley:
23.0% (361)
State:
16.8% (18,986)
Number of households with income $100k - 125k:
Sun Valley:
20.5% (323)
Nevada:
9.1% (10,333)
Number of households with income $125k - 150k:
Sun Valley:
6.2% (98)
State:
6.3% (7,104)
Number of households with income $150k - 200k:
Sun Valley:
2.4% (37)
Nevada:
4.5% (5,061)
Number of households with income > $200k:
Sun Valley:
0.0% (0)
State:
2.3% (2,619)
Aggregate household income in Sun Valley in 2022: $120,511,379
Median family income in Sun Valley in 2022:
Sun Valley:
$75,116
State:
$66,209
Number of families with income $10k - 20k:
Sun Valley:
16.3% (233)
State:
5.1% (4,452)
Number of families with income $20k - 30k:
Sun Valley:
1.5% (22)
State:
5.3% (4,626)
Number of families with income $30k - 40k:
Sun Valley:
9.3% (133)
State:
10.5% (9,093)
Number of families with income $40k - 50k:
Sun Valley:
4.9% (70)
State:
8.8% (7,610)
Number of families with income $50k - 60k:
Sun Valley:
10.0% (142)
Nevada:
8.3% (7,162)
Number of families with income $60k - 75k:
Sun Valley:
10.4% (149)
State:
14.2% (12,301)
Number of families with income $75k - 100k:
Sun Valley:
17.5% (250)
State:
18.8% (16,302)
Number of families with income $100k - 125k:
Sun Valley:
22.2% (317)
State:
10.0% (8,709)
Number of families with income $125k - 150k:
Sun Valley:
6.3% (89)
State:
6.9% (5,978)
Number of families with income $150k - 200k:
Sun Valley:
1.5% (21)
Nevada:
4.4% (3,850)
Median non-family income in Sun Valley in 2022:
Sun Valley:
$41,055
State:
$42,277
Change in median non-family income between 2000 and 2022:: -46.9%
Sun Valley, Nevada:
-46.9%
State:
+54.2%
Median per capita income in Sun Valley in 2022:
Sun Valley:
$20,041
Nevada:
$22,891
Change in median per capita income between 2000 and 2022:
Sun Valley, Nevada:
+97.8%
State:
+93.2%
Discuss Sun Valley, Nevada (NV) on our hugely popular Nevada forum.