The median household income in Toms Brook, VA in 2022 was $79,617, which was 7.9% less than the median annual income of $85,873 across the entire state of Virginia. Compared to the median income of $38,214 in 2000 this represents an increase of 52.0%. The per capita income in 2022 was $27,380, which means an increase of 39.0% compared to 2000 when it was $16,712.
Whole page based on the data from 2000 / 2022 when the population of Toms Brook, Virginia was 255 / 365
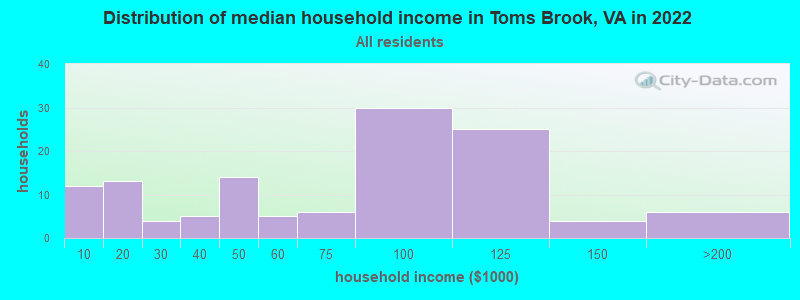
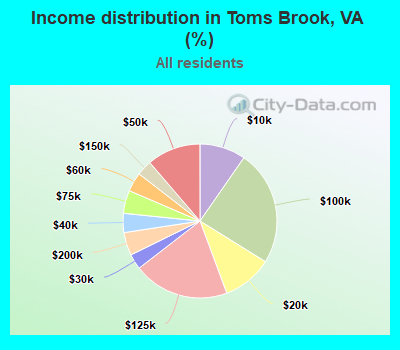
Income statistics for all residents
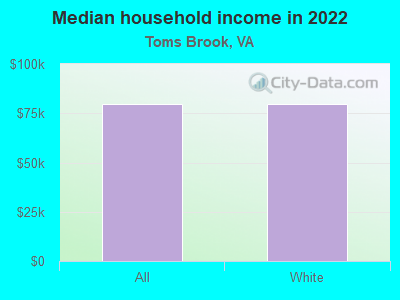
Median household income in Toms Brook, VA in 2022:
Toms Brook:
$79,617
Virginia:
$85,873
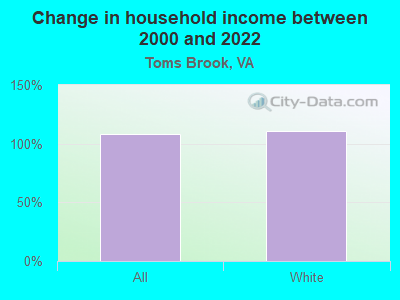
Change in median household income between 2000 and 2022:
Toms Brook, Virginia:
+108.3%
State:
+84.0%
Number of households with income < $10k:
Toms Brook:
9.7% (12)
State:
4.9% (165,315)
Number of households with income $10k - 20k:
Toms Brook:
10.5% (13)
State:
5.9% (199,380)
Number of households with income $20k - 30k:
Toms Brook:
3.2% (4)
State:
6.0% (202,243)
Number of households with income $30k - 40k:
Toms Brook:
4.0% (5)
Virginia:
6.1% (205,967)
Number of households with income $40k - 50k:
Toms Brook:
11.3% (14)
Virginia:
6.4% (215,648)
Number of households with income $50k - 60k:
Toms Brook:
4.0% (5)
Virginia:
6.2% (210,516)
Number of households with income $60k - 75k:
Toms Brook:
4.8% (6)
State:
8.6% (292,112)
Number of households with income $75k - 100k:
Toms Brook:
24.2% (30)
State:
12.2% (412,198)
Number of households with income $100k - 125k:
Toms Brook:
20.2% (25)
State:
10.3% (348,998)
Number of households with income $125k - 150k:
Toms Brook:
3.2% (4)
State:
7.7% (261,236)
Number of households with income $150k - 200k:
Toms Brook:
4.8% (6)
Virginia:
10.3% (347,282)
Number of households with income > $200k:
Toms Brook:
0.0% (0)
Virginia:
15.4% (519,712)
Aggregate household income in Toms Brook in 2022: $8,585,052
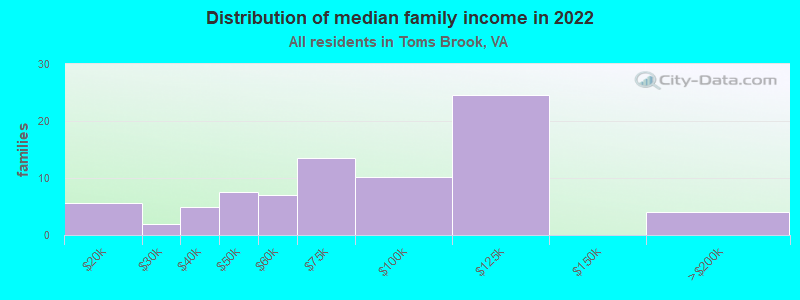
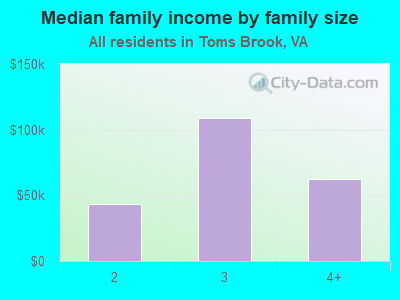
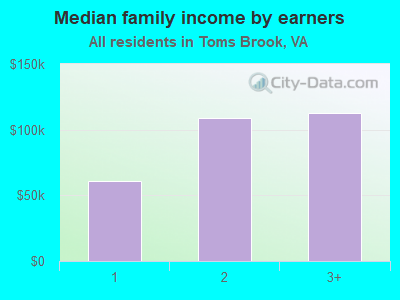
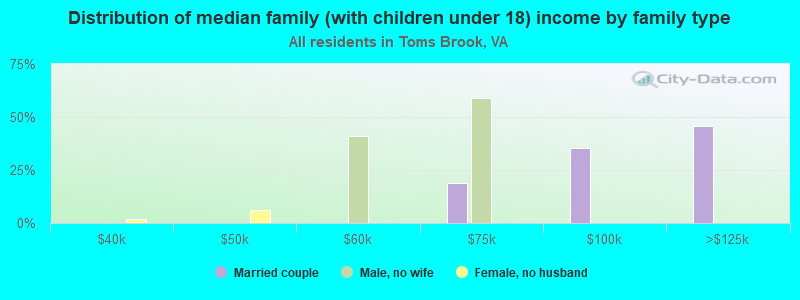
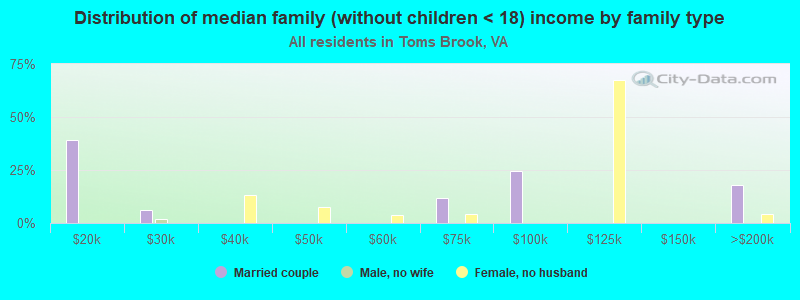
Median family income in Toms Brook in 2022:
Toms Brook:
$74,303
State:
$107,101
Number of families with income $10k - 20k:
Toms Brook:
7.0% (6)
State:
3.3% (71,807)
Number of families with income $20k - 30k:
Toms Brook:
2.5% (2)
Virginia:
4.0% (87,860)
Number of families with income $30k - 40k:
Toms Brook:
6.2% (5)
State:
4.7% (103,002)
Number of families with income $40k - 50k:
Toms Brook:
9.5% (7)
Virginia:
5.4% (118,579)
Number of families with income $50k - 60k:
Toms Brook:
8.8% (7)
Virginia:
5.5% (120,924)
Number of families with income $60k - 75k:
Toms Brook:
17.0% (13)
Virginia:
8.2% (180,564)
Number of families with income $75k - 100k:
Toms Brook:
12.8% (10)
Virginia:
12.6% (277,221)
Number of families with income $100k - 125k:
Toms Brook:
31.1% (25)
State:
11.3% (248,485)
Number of families with income $150k - 200k:
Toms Brook:
5.2% (4)
State:
12.7% (278,323)
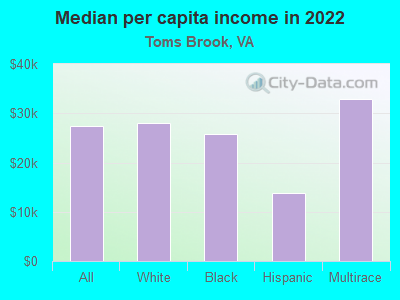
Median per capita income in Toms Brook in 2022:
Toms Brook:
$27,381
State:
$47,199
Change in median per capita income between 2000 and 2022:
Toms Brook, Virginia:
+63.8%
State:
+96.9%
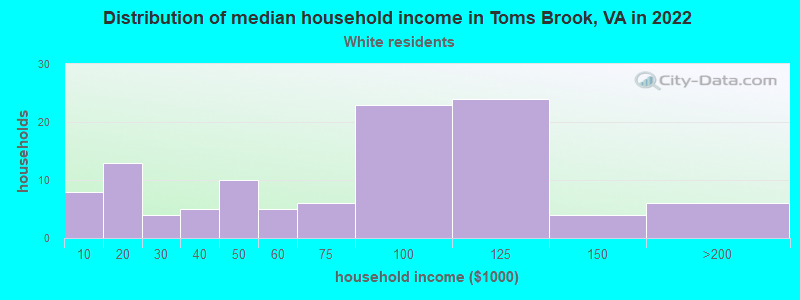
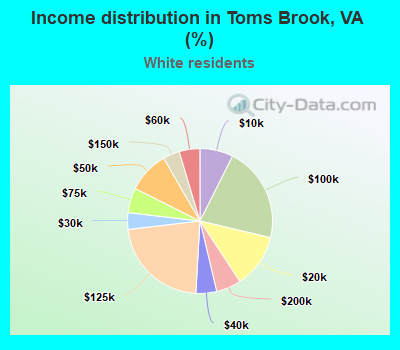
Income statistics for White residents
Median household income in Toms Brook, VA in 2022:
Toms Brook:
$79,718
State:
$91,924
Change in median household income between 2000 and 2022:
Toms Brook, Virginia:
+110.6%
Virginia:
+81.9%
Number of households with income < $10k:
Toms Brook:
7.4% (8)
State:
4.1% (90,549)
Number of households with income $10k - 20k:
Toms Brook:
12.0% (13)
State:
5.2% (114,324)
Number of households with income $20k - 30k:
Toms Brook:
3.7% (4)
Virginia:
5.7% (125,676)
Number of households with income $30k - 40k:
Toms Brook:
4.6% (5)
State:
5.5% (121,220)
Number of households with income $40k - 50k:
Toms Brook:
9.3% (10)
Virginia:
6.0% (133,011)
Number of households with income $50k - 60k:
Toms Brook:
4.6% (5)
Virginia:
6.2% (136,856)
Number of households with income $60k - 75k:
Toms Brook:
5.6% (6)
Virginia:
8.4% (186,094)
Number of households with income $75k - 100k:
Toms Brook:
21.3% (23)
State:
12.5% (277,077)
Number of households with income $100k - 125k:
Toms Brook:
22.2% (24)
State:
10.8% (237,562)
Number of households with income $125k - 150k:
Toms Brook:
3.7% (4)
Virginia:
8.0% (177,532)
Number of households with income $150k - 200k:
Toms Brook:
5.6% (6)
State:
11.0% (242,106)
Number of households with income > $200k:
Toms Brook:
0.0% (0)
State:
16.6% (366,064)
Aggregate household income in Toms Brook in 2022: $7,598,034
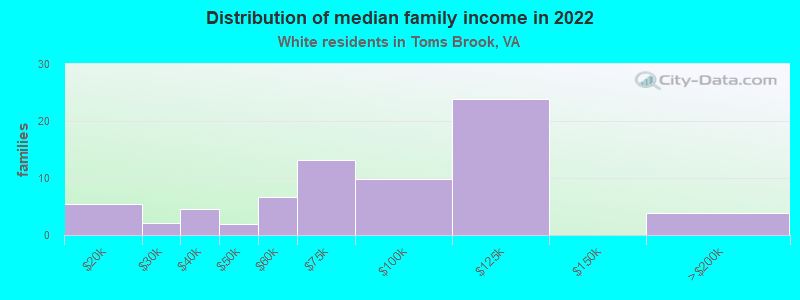
Median family income in Toms Brook in 2022:
Toms Brook:
$86,962
Virginia:
$114,708
Number of families with income $10k - 20k:
Toms Brook:
7.6% (5)
State:
2.5% (35,529)
Number of families with income $20k - 30k:
Toms Brook:
2.8% (2)
Virginia:
3.5% (49,027)
Number of families with income $30k - 40k:
Toms Brook:
6.3% (4)
Virginia:
3.8% (53,514)
Number of families with income $40k - 50k:
Toms Brook:
2.7% (2)
Virginia:
4.7% (66,206)
Number of families with income $50k - 60k:
Toms Brook:
9.4% (7)
State:
5.2% (74,438)
Number of families with income $60k - 75k:
Toms Brook:
18.5% (13)
State:
8.2% (116,265)
Number of families with income $75k - 100k:
Toms Brook:
13.9% (10)
State:
12.9% (183,581)
Number of families with income $100k - 125k:
Toms Brook:
33.3% (24)
State:
11.9% (168,950)
Number of families with income $150k - 200k:
Toms Brook:
5.5% (4)
State:
13.8% (195,800)
Median per capita income in Toms Brook in 2022:
Toms Brook:
$27,936
Virginia:
$53,456
Change in median per capita income between 2000 and 2022:
Toms Brook, Virginia:
+68.0%
Virginia:
+99.2%
Income statistics for Black or African American residents
Aggregate household income in Toms Brook in 2022: $630,508
Median per capita income in Toms Brook in 2022:
Toms Brook:
$25,826
State:
$34,599
Change in median per capita income between 2000 and 2022:: -19.3%
Toms Brook, Virginia:
-19.3%
State:
+119.8%
Income statistics for Hispanic or Latino residents
Aggregate household income in Toms Brook in 2022: $1,011,967
Median per capita income in Toms Brook in 2022:
Toms Brook:
$13,821
Virginia:
$32,277
Income statistics for Multirace residents
Median per capita income in Toms Brook in 2022:
Toms Brook:
$32,891
Virginia:
$34,385
Change in median per capita income between 2000 and 2022:
Toms Brook, Virginia:
+137.8%
State:
+130.2%
Discuss Toms Brook, Virginia (VA) on our hugely popular Virginia forum.