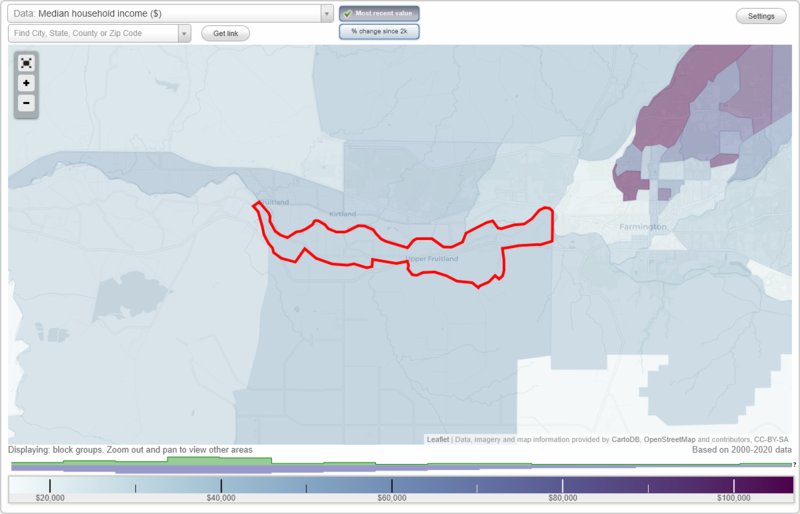
The median household income in Upper Fruitland, NM in 2022 was $37,771, which was 58.1% less than the median annual income of $59,726 across the entire state of New Mexico. Compared to the median income of $25,096 in 2000 this represents an increase of 33.6%. The per capita income in 2022 was $19,877, which means an increase of 53.5% compared to 2000 when it was $9,246.
Whole page based on the data from 2000 / 2022 when the population of Upper Fruitland, New Mexico was 1,664 / 1,516
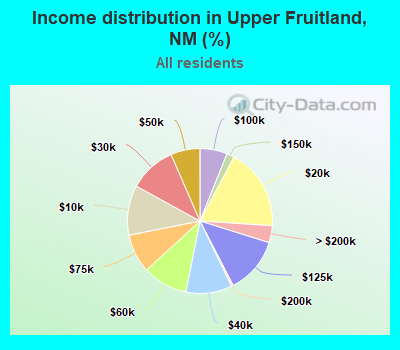
Income statistics for all residents
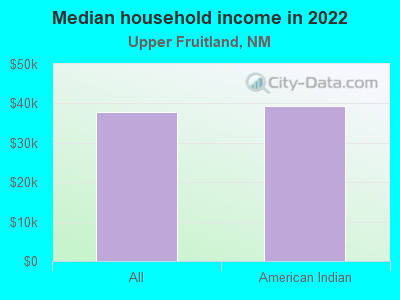
Median household income in Upper Fruitland, NM in 2022:
Upper Fruitland:
$37,772
State:
$59,726
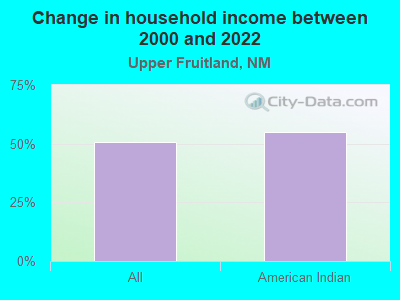
Change in median household income between 2000 and 2022:
Upper Fruitland, New Mexico:
+50.5%
State:
+75.0%
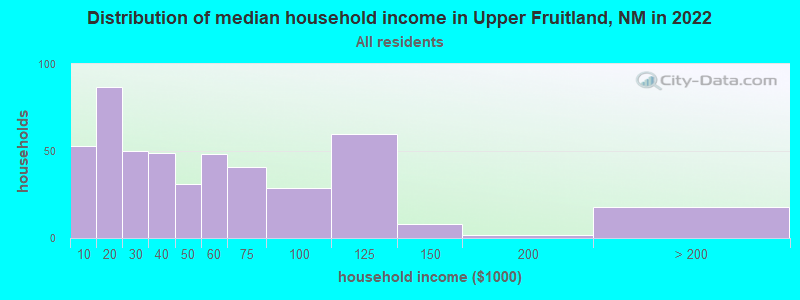
Number of households with income < $10k:
Upper Fruitland:
11.1% (53)
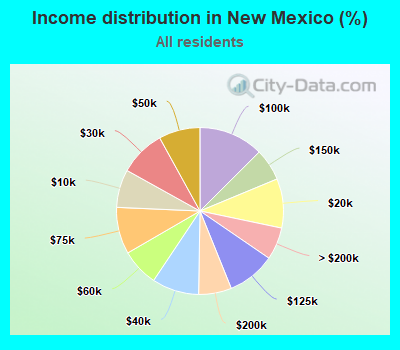
New Mexico:
7.4% (62,451)
Number of households with income $10k - 20k:
Upper Fruitland:
18.3% (87)
State:
9.5% (80,886)
Number of households with income $20k - 30k:
Upper Fruitland:
10.5% (50)
State:
8.9% (75,578)
Number of households with income $30k - 40k:
Upper Fruitland:
10.3% (49)
New Mexico:
9.1% (77,319)
Number of households with income $40k - 50k:
Upper Fruitland:
6.5% (31)
State:
8.0% (67,979)
Number of households with income $50k - 60k:
Upper Fruitland:
10.1% (48)
State:
7.2% (61,477)
Number of households with income $60k - 75k:
Upper Fruitland:
8.6% (41)
New Mexico:
9.1% (77,047)
Number of households with income $75k - 100k:
Upper Fruitland:
6.1% (29)
New Mexico:
12.5% (106,292)
Number of households with income $100k - 125k:
Upper Fruitland:
12.6% (60)
State:
9.3% (79,200)
Number of households with income $125k - 150k:
Upper Fruitland:
1.7% (8)
State:
6.2% (52,769)
Number of households with income $150k - 200k:
Upper Fruitland:
0.4% (2)
New Mexico:
6.4% (54,020)
Number of households with income > $200k:
Upper Fruitland:
3.8% (18)
New Mexico:
6.3% (53,200)
Aggregate household income in Upper Fruitland in 2022: $24,568,151
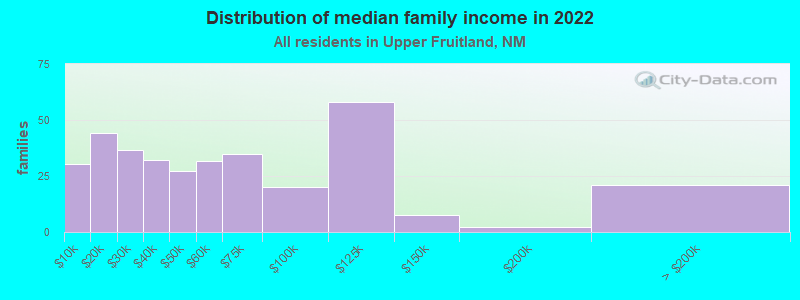
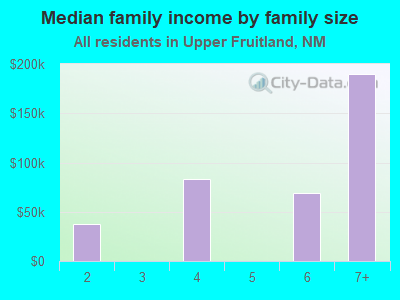
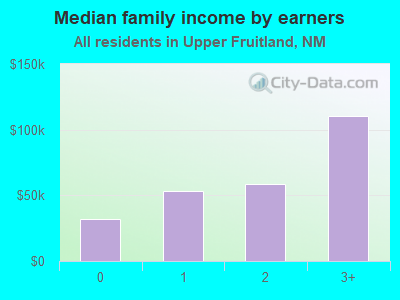
Median family income in Upper Fruitland in 2022:
Upper Fruitland:
$46,395
New Mexico:
$74,341
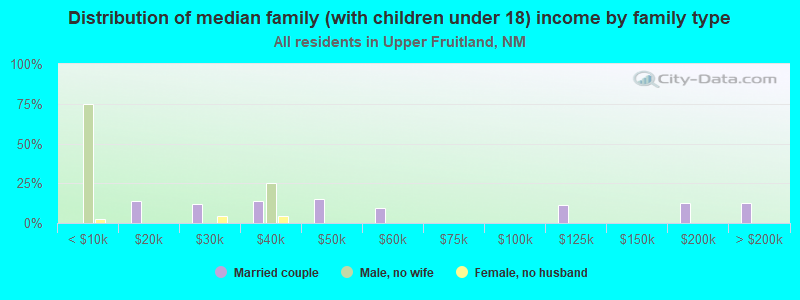
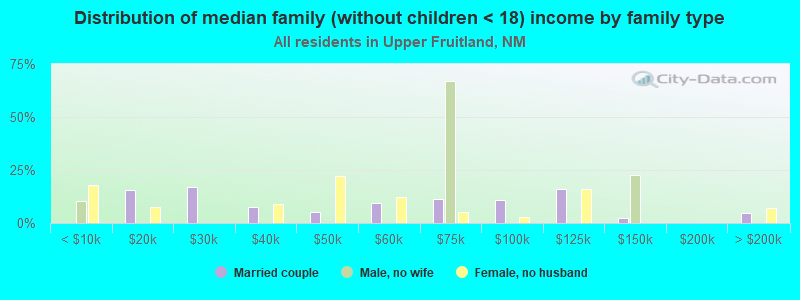
Number of families with income < $10k:
Upper Fruitland:
8.8% (30)
New Mexico:
4.5% (23,191)
Number of families with income $10k - 20k:
Upper Fruitland:
12.8% (44)
New Mexico:
5.6% (28,861)
Number of families with income $20k - 30k:
Upper Fruitland:
10.6% (37)
State:
6.8% (35,308)
Number of families with income $30k - 40k:
Upper Fruitland:
9.3% (32)
State:
8.4% (43,204)
Number of families with income $40k - 50k:
Upper Fruitland:
7.8% (27)
State:
8.2% (42,398)
Number of families with income $50k - 60k:
Upper Fruitland:
9.2% (32)
New Mexico:
7.2% (37,358)
Number of families with income $60k - 75k:
Upper Fruitland:
10.1% (35)
State:
9.7% (50,331)
Number of families with income $75k - 100k:
Upper Fruitland:
5.8% (20)
State:
14.1% (72,803)
Number of families with income $100k - 125k:
Upper Fruitland:
16.7% (58)
New Mexico:
10.7% (55,058)
Number of families with income $125k - 150k:
Upper Fruitland:
2.1% (7)
New Mexico:
7.9% (40,847)
Number of families with income $150k - 200k:
Upper Fruitland:
0.7% (2)
State:
8.5% (44,144)
Number of families with income > $200k:
Upper Fruitland:
6.1% (21)
New Mexico:
8.3% (42,961)
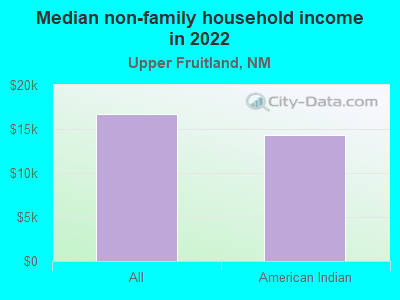
Median non-family income in Upper Fruitland in 2022:
Upper Fruitland:
$16,706
State:
$36,532
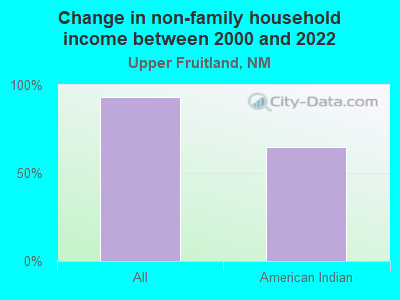
Change in median non-family income between 2000 and 2022:
Upper Fruitland, New Mexico:
+93.0%
State:
+67.6%
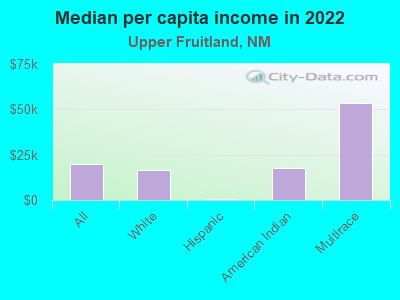
Median per capita income in Upper Fruitland in 2022:
Upper Fruitland:
$19,877
State:
$33,916
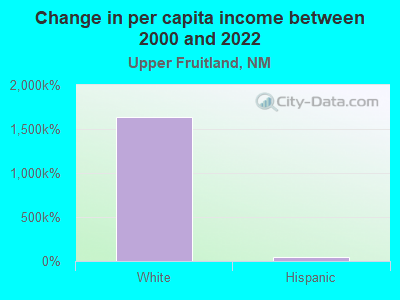
Change in median per capita income between 2000 and 2022:
Upper Fruitland, New Mexico:
+115.0%
New Mexico:
+96.5%
Income statistics for White residents
Aggregate household income in Upper Fruitland in 2022: $365,912
Median per capita income in Upper Fruitland in 2022:
Upper Fruitland:
$16,317
State:
$42,438
Income statistics for Hispanic or Latino residents
Number of households with income < $10k:
Upper Fruitland:
0.0% (0)
New Mexico:
7.7% (28,825)
Number of households with income $10k - 20k:
Upper Fruitland:
0.0% (0)
State:
11.3% (42,162)
Number of households with income $20k - 30k:
Upper Fruitland:
100.0% (15)
State:
10.3% (38,397)
Number of households with income $30k - 40k:
Upper Fruitland:
0.0% (0)
State:
10.0% (37,425)
Number of households with income $40k - 50k:
Upper Fruitland:
0.0% (0)
State:
8.8% (32,925)
Number of households with income $50k - 60k:
Upper Fruitland:
0.0% (0)
State:
8.2% (30,606)
Number of households with income $60k - 75k:
Upper Fruitland:
0.0% (0)
New Mexico:
8.6% (32,270)
Number of households with income $75k - 100k:
Upper Fruitland:
0.0% (0)
New Mexico:
13.3% (49,793)
Number of households with income $100k - 125k:
Upper Fruitland:
0.0% (0)
State:
8.1% (30,306)
Number of households with income $125k - 150k:
Upper Fruitland:
0.0% (0)
New Mexico:
5.3% (19,926)
Number of households with income $150k - 200k:
Upper Fruitland:
0.0% (0)
New Mexico:
4.9% (18,186)
Number of households with income > $200k:
Upper Fruitland:
0.0% (0)
New Mexico:
3.6% (13,321)
Aggregate household income in Upper Fruitland in 2022: $273,427
Median per capita income in Upper Fruitland in 2022:
Upper Fruitland:
$451
State:
$25,400
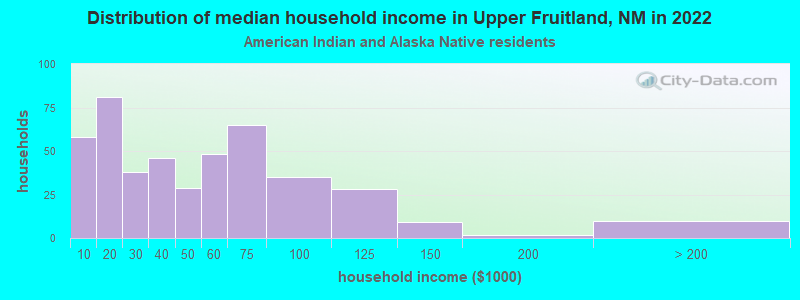
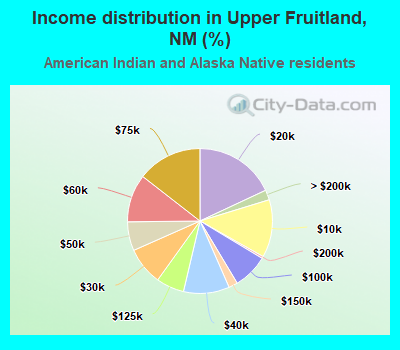
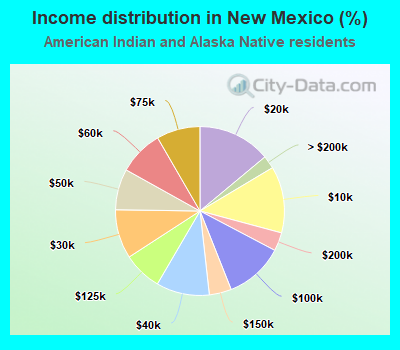
Income statistics for American Indian and Alaska Native residents
Median household income in Upper Fruitland, NM in 2022:
Upper Fruitland:
$39,320
New Mexico:
$43,317
Change in median household income between 2000 and 2022:
Upper Fruitland, New Mexico:
+54.9%
State:
+84.8%
Number of households with income < $10k:
Upper Fruitland:
12.9% (58)
State:
12.8% (7,750)
Number of households with income $10k - 20k:
Upper Fruitland:
18.0% (81)
New Mexico:
14.0% (8,481)
Number of households with income $20k - 30k:
Upper Fruitland:
8.5% (38)
New Mexico:
9.4% (5,714)
Number of households with income $30k - 40k:
Upper Fruitland:
10.2% (46)
State:
10.2% (6,190)
Number of households with income $40k - 50k:
Upper Fruitland:
6.5% (29)
New Mexico:
7.8% (4,765)
Number of households with income $50k - 60k:
Upper Fruitland:
10.7% (48)
State:
8.6% (5,205)
Number of households with income $60k - 75k:
Upper Fruitland:
14.5% (65)
State:
8.3% (5,073)
Number of households with income $75k - 100k:
Upper Fruitland:
7.8% (35)
State:
11.3% (6,847)
Number of households with income $100k - 125k:
Upper Fruitland:
6.2% (28)
State:
7.4% (4,504)
Number of households with income $125k - 150k:
Upper Fruitland:
2.0% (9)
State:
4.3% (2,588)
Number of households with income $150k - 200k:
Upper Fruitland:
0.4% (2)
State:
3.5% (2,146)
Number of households with income > $200k:
Upper Fruitland:
2.2% (10)
New Mexico:
2.5% (1,505)
Aggregate household income in Upper Fruitland in 2022: $22,816,752
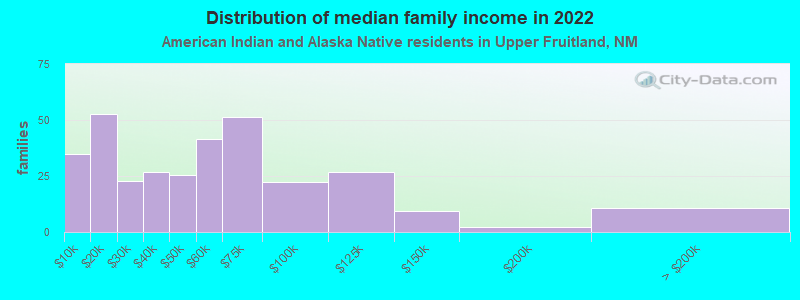
Median family income in Upper Fruitland in 2022:
Upper Fruitland:
$48,439
State:
$49,129
Number of families with income < $10k:
Upper Fruitland:
10.6% (35)
New Mexico:
11.3% (4,576)
Number of families with income $10k - 20k:
Upper Fruitland:
16.1% (52)
New Mexico:
11.6% (4,691)
Number of families with income $20k - 30k:
Upper Fruitland:
6.9% (23)
New Mexico:
9.1% (3,695)
Number of families with income $30k - 40k:
Upper Fruitland:
8.2% (27)
New Mexico:
10.8% (4,383)
Number of families with income $40k - 50k:
Upper Fruitland:
7.8% (25)
New Mexico:
8.3% (3,364)
Number of families with income $50k - 60k:
Upper Fruitland:
12.7% (42)
New Mexico:
10.8% (4,377)
Number of families with income $60k - 75k:
Upper Fruitland:
15.8% (52)
State:
9.4% (3,798)
Number of families with income $75k - 100k:
Upper Fruitland:
6.9% (22)
New Mexico:
9.0% (3,641)
Number of families with income $100k - 125k:
Upper Fruitland:
8.2% (27)
State:
7.4% (3,012)
Number of families with income $125k - 150k:
Upper Fruitland:
2.9% (9)
State:
4.6% (1,864)
Number of families with income $150k - 200k:
Upper Fruitland:
0.7% (2)
State:
4.5% (1,810)
Number of families with income > $200k:
Upper Fruitland:
3.3% (11)
New Mexico:
3.4% (1,389)
Median non-family income in Upper Fruitland in 2022:
Upper Fruitland:
$14,274
New Mexico:
$27,367
Change in median non-family income between 2000 and 2022:
Upper Fruitland, New Mexico:
+64.9%
State:
+143.4%
Median per capita income in Upper Fruitland in 2022:
Upper Fruitland:
$17,697
State:
$20,119
Change in median per capita income between 2000 and 2022:
Upper Fruitland, New Mexico:
+89.8%
New Mexico:
+131.8%
Income statistics for Multirace residents
Number of households with income < $10k:
Upper Fruitland:
0.0% (0)
New Mexico:
6.5% (12,332)
Number of households with income $10k - 20k:
Upper Fruitland:
0.0% (0)
State:
10.6% (19,977)
Number of households with income $20k - 30k:
Upper Fruitland:
0.0% (0)
State:
10.3% (19,459)
Number of households with income $30k - 40k:
Upper Fruitland:
0.0% (0)
State:
8.8% (16,721)
Number of households with income $40k - 50k:
Upper Fruitland:
0.0% (0)
New Mexico:
7.4% (14,003)
Number of households with income $50k - 60k:
Upper Fruitland:
0.0% (0)
State:
9.0% (16,994)
Number of households with income $60k - 75k:
Upper Fruitland:
0.0% (0)
New Mexico:
8.9% (16,866)
Number of households with income $75k - 100k:
Upper Fruitland:
0.0% (0)
State:
13.5% (25,577)
Number of households with income $100k - 125k:
Upper Fruitland:
100.0% (45)
State:
8.9% (16,792)
Number of households with income $125k - 150k:
Upper Fruitland:
0.0% (0)
State:
5.6% (10,584)
Number of households with income $150k - 200k:
Upper Fruitland:
0.0% (0)
State:
5.7% (10,849)
Number of households with income > $200k:
Upper Fruitland:
0.0% (0)
State:
4.8% (9,158)
Aggregate household income in Upper Fruitland in 2022: $434,925
Median per capita income in Upper Fruitland in 2022:
Upper Fruitland:
$53,499
State:
$28,327
Discuss Upper Fruitland, New Mexico (NM) on our hugely popular New Mexico forum.