Van Buren, New York (NY) income map, earnings map, and wages data
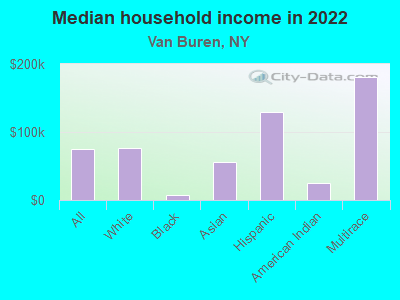
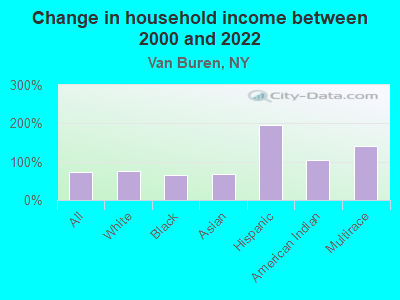
The median household income in Van Buren, NY in 2022 was $74,713, which was 6.5% less than the median annual income of $79,557 across the entire state of New York. Compared to the median income of $43,003 in 2000 this represents an increase of 42.4%. The per capita income in 2022 was $39,177, which means an increase of 46.4% compared to 2000 when it was $20,997.
Income statistics for all residents
Median household income in Van Buren, NY in 2022:| Van Buren: | $74,714 |
| New York: | $79,557 |
Change in median household income between 2000 and 2022:| Van Buren, New York: | +73.7% |
| New York: | +83.3% |
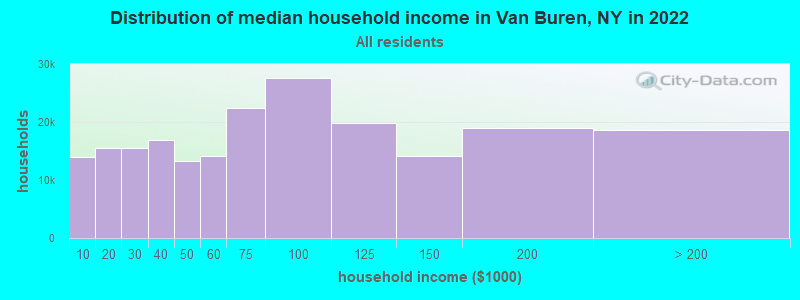
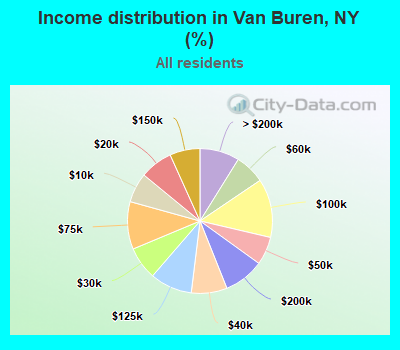
Number of households with income < $10k:| Van Buren: | 6.6% (13,951) |
| State: | 6.8% (527,598) |
Number of households with income $10k - 20k:| Van Buren: | 7.3% (15,453) |
| New York: | 7.4% (574,940) |
Number of households with income $20k - 30k:| Van Buren: | 7.4% (15,524) |
| New York: | 6.7% (517,718) |
Number of households with income $30k - 40k:| Van Buren: | 8.0% (16,835) |
| State: | 6.5% (506,674) |
Number of households with income $40k - 50k:| Van Buren: | 6.3% (13,250) |
| State: | 6.1% (470,439) |
Number of households with income $50k - 60k:| Van Buren: | 6.7% (14,114) |
| New York: | 5.8% (454,042) |
Number of households with income $60k - 75k:| Van Buren: | 10.6% (22,399) |
| New York: | 8.5% (657,508) |
Number of households with income $75k - 100k:| Van Buren: | 13.1% (27,670) |
| State: | 11.6% (899,824) |
Number of households with income $100k - 125k:| Van Buren: | 9.4% (19,839) |
| State: | 9.3% (723,825) |
Number of households with income $125k - 150k:| Van Buren: | 6.7% (14,199) |
| State: | 7.1% (552,420) |
Number of households with income $150k - 200k:| Van Buren: | 9.0% (19,005) |
| State: | 9.4% (727,051) |
Number of households with income > $200k:| Van Buren: | 8.9% (18,675) |
| State: | 15.0% (1,162,269) |
Aggregate household income in Van Buren in 2022: $2,279,606,909
Median family income in Van Buren in 2022:| Van Buren: | $92,056 |
| State: | $99,066 |
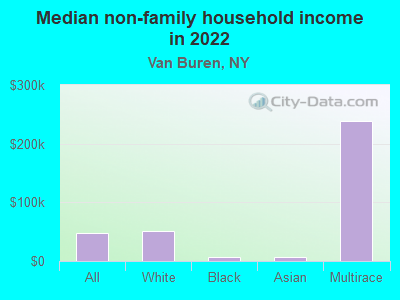
Median non-family income in Van Buren in 2022:| Van Buren: | $48,380 |
| State: | $50,181 |
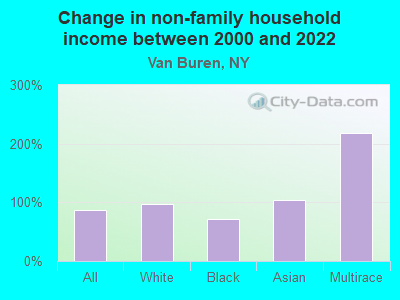
Change in median non-family income between 2000 and 2022:| Van Buren, New York: | +87.2% |
| State: | +85.4% |
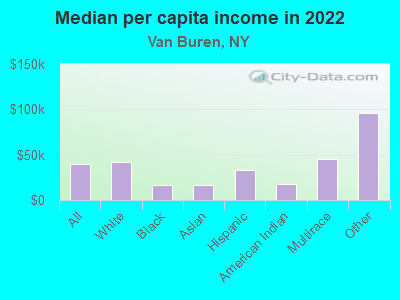
Median per capita income in Van Buren in 2022:| Van Buren: | $39,177 |
| State: | $47,421 |
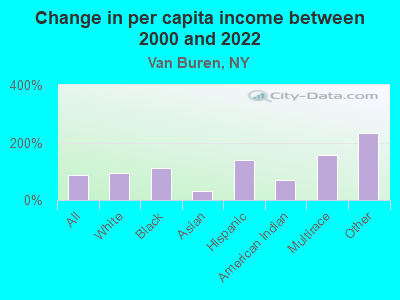
Change in median per capita income between 2000 and 2022:| Van Buren, New York: | +86.6% |
| New York: | +102.7% |
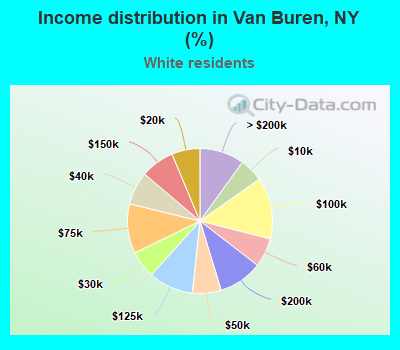
Income statistics for White residents
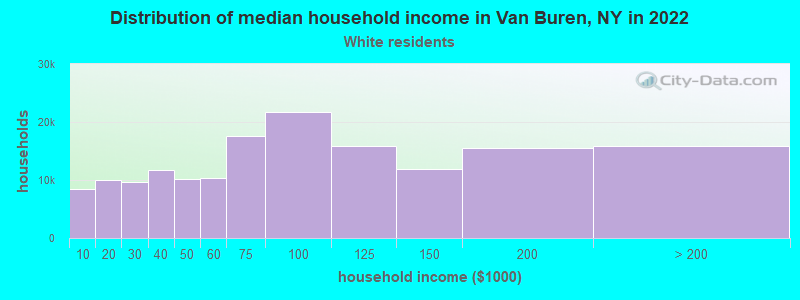
Median household income in Van Buren, NY in 2022:| Van Buren: | $75,823 |
| State: | $89,408 |
Change in median household income between 2000 and 2022:| Van Buren, New York: | +75.2% |
| New York: | +85.5% |
Number of households with income < $10k:| Van Buren: | 5.3% (8,366) |
| State: | 4.8% (225,550) |
Number of households with income $10k - 20k:| Van Buren: | 6.3% (9,979) |
| New York: | 6.1% (289,425) |
Number of households with income $20k - 30k:| Van Buren: | 6.1% (9,654) |
| State: | 5.9% (280,254) |
Number of households with income $30k - 40k:| Van Buren: | 7.4% (11,665) |
| State: | 6.1% (288,263) |
Number of households with income $40k - 50k:| Van Buren: | 6.4% (10,177) |
| State: | 5.9% (278,079) |
Number of households with income $50k - 60k:| Van Buren: | 6.5% (10,266) |
| New York: | 5.7% (267,554) |
Number of households with income $60k - 75k:| Van Buren: | 11.1% (17,542) |
| State: | 8.4% (398,344) |
Number of households with income $75k - 100k:| Van Buren: | 13.7% (21,784) |
| New York: | 11.8% (554,841) |
Number of households with income $100k - 125k:| Van Buren: | 10.0% (15,793) |
| State: | 10.0% (469,794) |
Number of households with income $125k - 150k:| Van Buren: | 7.5% (11,902) |
| State: | 7.6% (360,467) |
Number of households with income $150k - 200k:| Van Buren: | 9.8% (15,548) |
| State: | 10.1% (477,078) |
Number of households with income > $200k:| Van Buren: | 10.0% (15,797) |
| State: | 17.6% (829,233) |
Aggregate household income in Van Buren in 2022: $1,911,455,940
Median family income in Van Buren in 2022:| Van Buren: | $94,222 |
| State: | $115,170 |
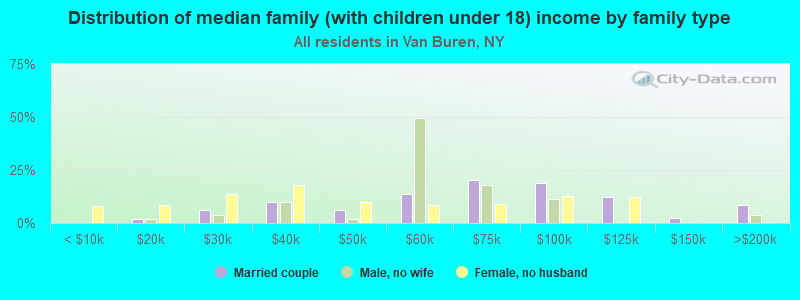
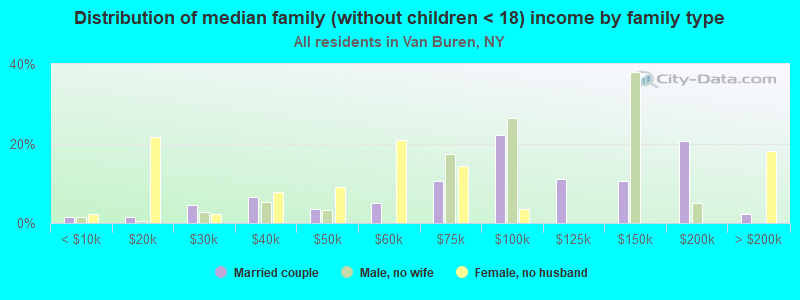
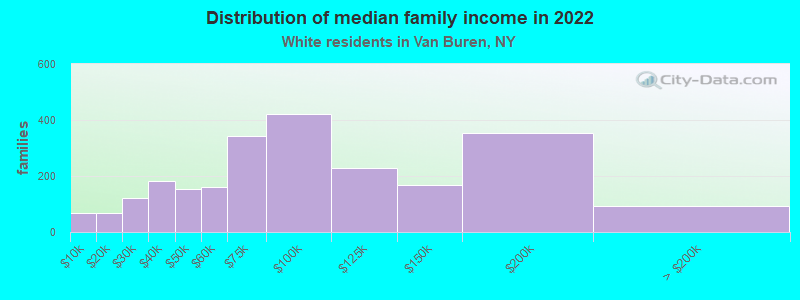
Number of families with income < $10k:| Van Buren: | 2.8% (67) |
| State: | 2.5% (68,851) |
Number of families with income $10k - 20k:| Van Buren: | 2.9% (69) |
| State: | 3.0% (83,127) |
Number of families with income $20k - 30k:| Van Buren: | 5.1% (120) |
| New York: | 3.5% (97,578) |
Number of families with income $30k - 40k:| Van Buren: | 7.8% (183) |
| New York: | 4.1% (114,108) |
Number of families with income $40k - 50k:| Van Buren: | 6.5% (154) |
| State: | 4.7% (130,902) |
Number of families with income $50k - 60k:| Van Buren: | 6.9% (162) |
| New York: | 4.9% (135,118) |
Number of families with income $60k - 75k:| Van Buren: | 14.5% (342) |
| State: | 7.8% (216,254) |
Number of families with income $75k - 100k:| Van Buren: | 17.9% (423) |
| State: | 12.4% (342,382) |
Number of families with income $100k - 125k:| Van Buren: | 9.7% (230) |
| New York: | 11.4% (314,917) |
Number of families with income $125k - 150k:| Van Buren: | 7.1% (168) |
| State: | 9.4% (260,489) |
Number of families with income $150k - 200k:| Van Buren: | 14.9% (353) |
| New York: | 13.2% (365,586) |
Number of families with income > $200k:| Van Buren: | 3.9% (92) |
| New York: | 23.2% (642,319) |
Median non-family income in Van Buren in 2022:| Van Buren: | $51,350 |
| New York: | $54,783 |
Change in median non-family income between 2000 and 2022:| Van Buren, New York: | +97.8% |
| State: | +87.9% |
Median per capita income in Van Buren in 2022:| Van Buren: | $41,426 |
| New York: | $57,640 |
Change in median per capita income between 2000 and 2022:| Van Buren, New York: | +95.4% |
| State: | +111.6% |
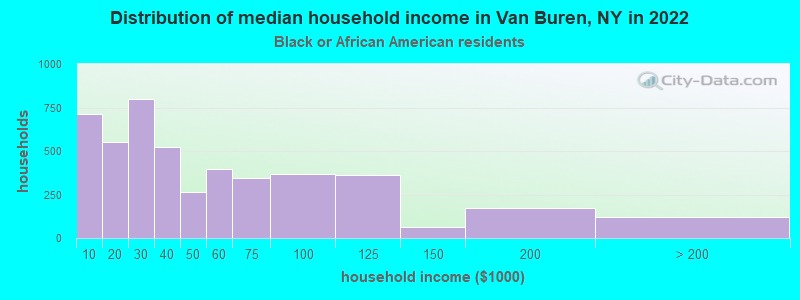
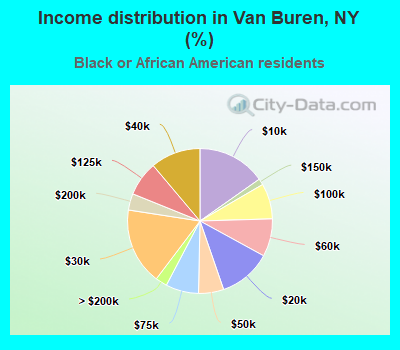
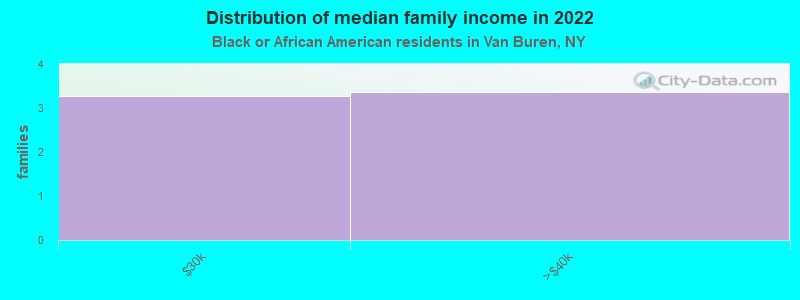
Income statistics for Black or African American residents
Median household income in Van Buren, NY in 2022:| Van Buren: | $7,551 |
| State: | $57,898 |
Change in median household income between 2000 and 2022:| Van Buren, New York: | +64.8% |
| New York: | +84.6% |
Number of households with income < $10k:| Van Buren: | 15.2% (711) |
| New York: | 12.0% (128,500) |
Number of households with income $10k - 20k:| Van Buren: | 11.8% (549) |
| State: | 10.0% (107,541) |
Number of households with income $20k - 30k:| Van Buren: | 17.1% (800) |
| State: | 8.4% (90,192) |
Number of households with income $30k - 40k:| Van Buren: | 11.2% (521) |
| New York: | 7.4% (79,579) |
Number of households with income $40k - 50k:| Van Buren: | 5.6% (262) |
| State: | 6.8% (72,491) |
Number of households with income $50k - 60k:| Van Buren: | 8.4% (394) |
| State: | 6.7% (71,309) |
Number of households with income $60k - 75k:| Van Buren: | 7.4% (344) |
| State: | 8.9% (95,050) |
Number of households with income $75k - 100k:| Van Buren: | 7.9% (370) |
| State: | 11.5% (123,569) |
Number of households with income $100k - 125k:| Van Buren: | 7.7% (361) |
| State: | 8.1% (86,632) |
Number of households with income $125k - 150k:| Van Buren: | 1.4% (65) |
| New York: | 6.0% (64,788) |
Number of households with income $150k - 200k:| Van Buren: | 3.7% (172) |
| New York: | 7.2% (76,644) |
Number of households with income > $200k:| Van Buren: | 2.6% (122) |
| New York: | 7.0% (75,062) |
Aggregate household income in Van Buren in 2022: $1,437,164
Median family income in Van Buren in 2022:| Van Buren: | $74,899 |
| State: | $72,528 |
Median non-family income in Van Buren in 2022:| Van Buren: | $6,421 |
| New York: | $37,265 |
Change in median non-family income between 2000 and 2022:| Van Buren, New York: | +71.2% |
| State: | +81.7% |
Median per capita income in Van Buren in 2022:| Van Buren: | $16,968 |
| State: | $31,947 |
Change in median per capita income between 2000 and 2022:| Van Buren, New York: | +111.1% |
| New York: | +106.1% |
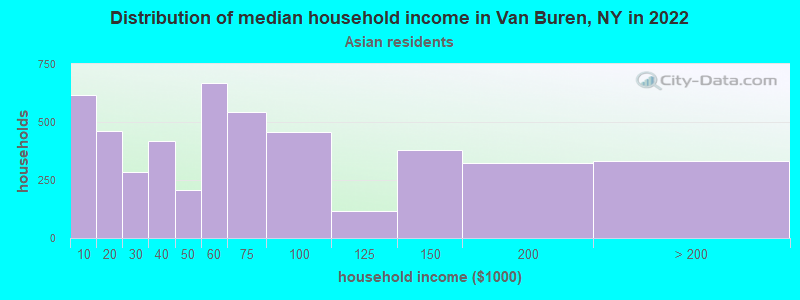
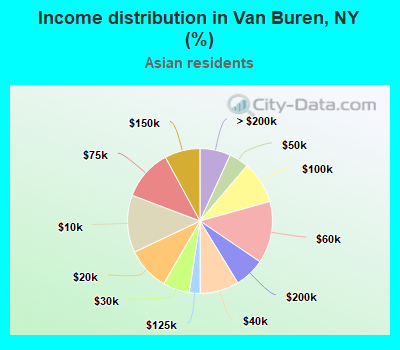
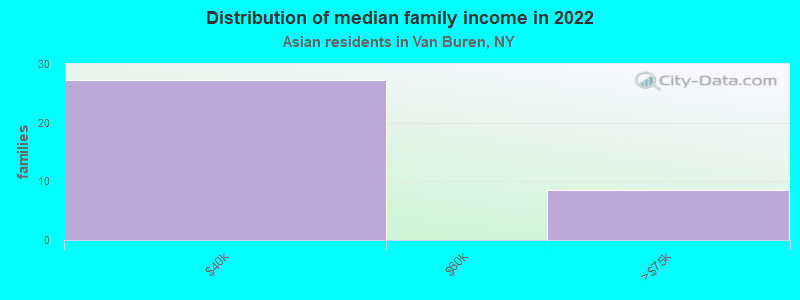
Income statistics for Asian residents
Median household income in Van Buren, NY in 2022:| Van Buren: | $56,383 |
| State: | $89,947 |
Change in median household income between 2000 and 2022:| Van Buren, New York: | +67.4% |
| State: | +98.1% |
Number of households with income < $10k:| Van Buren: | 12.8% (616) |
| New York: | 6.9% (42,537) |
Number of households with income $10k - 20k:| Van Buren: | 9.6% (463) |
| New York: | 7.3% (44,745) |
Number of households with income $20k - 30k:| Van Buren: | 5.9% (286) |
| State: | 6.2% (38,249) |
Number of households with income $30k - 40k:| Van Buren: | 8.7% (418) |
| New York: | 5.5% (33,993) |
Number of households with income $40k - 50k:| Van Buren: | 4.3% (209) |
| New York: | 4.8% (29,795) |
Number of households with income $50k - 60k:| Van Buren: | 13.8% (666) |
| State: | 5.2% (32,100) |
Number of households with income $60k - 75k:| Van Buren: | 11.3% (545) |
| State: | 7.3% (44,615) |
Number of households with income $75k - 100k:| Van Buren: | 9.5% (455) |
| State: | 10.8% (66,687) |
Number of households with income $100k - 125k:| Van Buren: | 2.4% (117) |
| State: | 8.2% (50,233) |
Number of households with income $125k - 150k:| Van Buren: | 7.9% (380) |
| New York: | 7.2% (44,299) |
Number of households with income $150k - 200k:| Van Buren: | 6.8% (325) |
| New York: | 10.4% (63,837) |
Number of households with income > $200k:| Van Buren: | 6.9% (330) |
| State: | 20.1% (123,891) |
Aggregate household income in Van Buren in 2022: $2,514,984
Median family income in Van Buren in 2022:| Van Buren: | $52,190 |
| State: | $98,136 |
Number of families with income $30k - 40k:| Van Buren: | 76.2% (27) |
| New York: | 6.2% (26,994) |
Number of families with income $60k - 75k:| Van Buren: | 23.8% (9) |
| State: | 7.6% (33,120) |
Median non-family income in Van Buren in 2022:| Van Buren: | $7,661 |
| State: | $63,573 |
Change in median non-family income between 2000 and 2022:| Van Buren, New York: | +104.3% |
| State: | +101.1% |
Median per capita income in Van Buren in 2022:| Van Buren: | $17,084 |
| New York: | $46,726 |
Change in median per capita income between 2000 and 2022:| Van Buren, New York: | +29.6% |
| New York: | +126.6% |
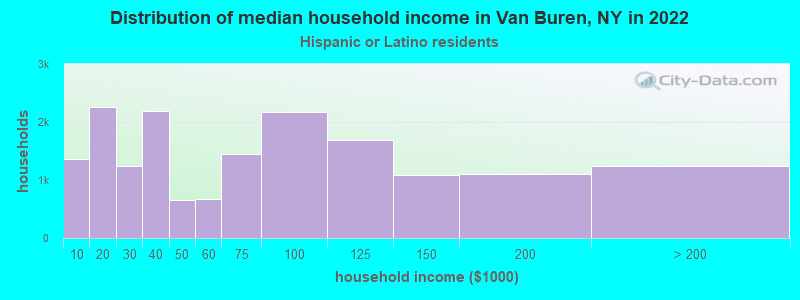
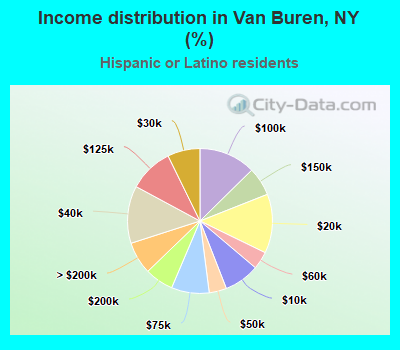
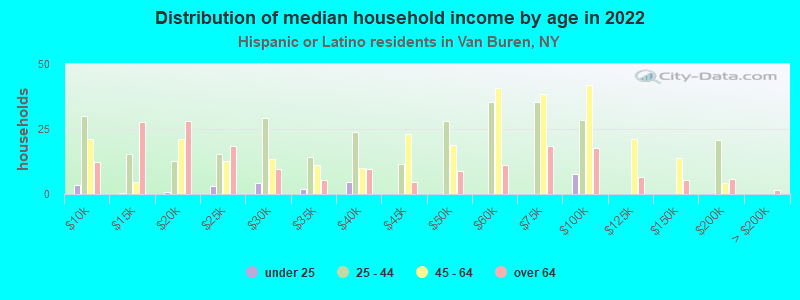
Income statistics for Hispanic or Latino residents
Median household income in Van Buren, NY in 2022:| Van Buren: | $129,657 |
| New York: | $60,468 |
Number of households with income < $10k:| Van Buren: | 7.9% (1,355) |
| New York: | 9.9% (127,185) |
Number of households with income $10k - 20k:| Van Buren: | 13.2% (2,260) |
| State: | 10.7% (136,699) |
Number of households with income $20k - 30k:| Van Buren: | 7.2% (1,240) |
| New York: | 8.1% (102,991) |
Number of households with income $30k - 40k:| Van Buren: | 12.8% (2,194) |
| State: | 7.8% (100,149) |
Number of households with income $40k - 50k:| Van Buren: | 3.9% (663) |
| New York: | 6.9% (87,760) |
Number of households with income $50k - 60k:| Van Buren: | 4.0% (678) |
| New York: | 6.3% (80,968) |
Number of households with income $60k - 75k:| Van Buren: | 8.4% (1,446) |
| New York: | 8.7% (110,631) |
Number of households with income $75k - 100k:| Van Buren: | 12.6% (2,165) |
| State: | 11.2% (142,787) |
Number of households with income $100k - 125k:| Van Buren: | 9.9% (1,694) |
| New York: | 8.2% (104,850) |
Number of households with income $125k - 150k:| Van Buren: | 6.4% (1,089) |
| State: | 6.3% (80,274) |
Number of households with income $150k - 200k:| Van Buren: | 6.4% (1,095) |
| State: | 7.4% (95,117) |
Number of households with income > $200k:| Van Buren: | 7.2% (1,240) |
| State: | 8.6% (109,514) |
Aggregate household income in Van Buren in 2022: $4,697,880
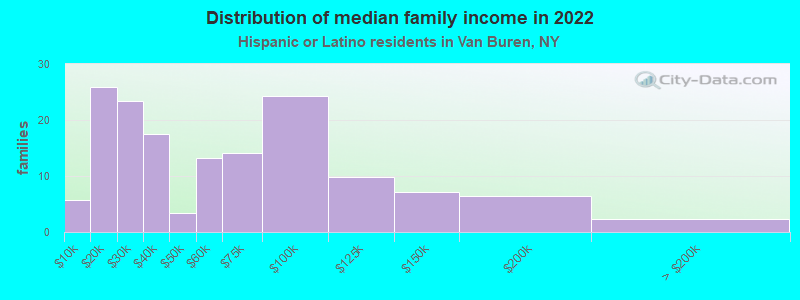
Median family income in Van Buren in 2022:| Van Buren: | $119,828 |
| State: | $68,770 |
Number of families with income < $10k:| Van Buren: | 3.8% (6) |
| State: | 6.9% (58,565) |
Number of families with income $10k - 20k:| Van Buren: | 16.9% (26) |
| State: | 7.0% (59,058) |
Number of families with income $20k - 30k:| Van Buren: | 15.3% (23) |
| New York: | 8.0% (68,048) |
Number of families with income $30k - 40k:| Van Buren: | 11.4% (17) |
| State: | 8.4% (70,668) |
Number of families with income $40k - 50k:| Van Buren: | 2.2% (3) |
| New York: | 7.4% (62,941) |
Number of families with income $50k - 60k:| Van Buren: | 8.6% (13) |
| New York: | 6.6% (55,592) |
Number of families with income $60k - 75k:| Van Buren: | 9.2% (14) |
| New York: | 9.3% (78,564) |
Number of families with income $75k - 100k:| Van Buren: | 15.8% (24) |
| New York: | 12.6% (106,685) |
Number of families with income $100k - 125k:| Van Buren: | 6.5% (10) |
| New York: | 9.4% (79,139) |
Number of families with income $125k - 150k:| Van Buren: | 4.7% (7) |
| New York: | 6.9% (58,255) |
Number of families with income $150k - 200k:| Van Buren: | 4.1% (6) |
| State: | 8.3% (69,877) |
Number of families with income > $200k:| Van Buren: | 1.5% (2) |
| New York: | 9.3% (78,555) |
Median per capita income in Van Buren in 2022:| Van Buren: | $33,471 |
| State: | $29,761 |
Change in median per capita income between 2000 and 2022:| Van Buren, New York: | +138.6% |
| State: | +132.7% |
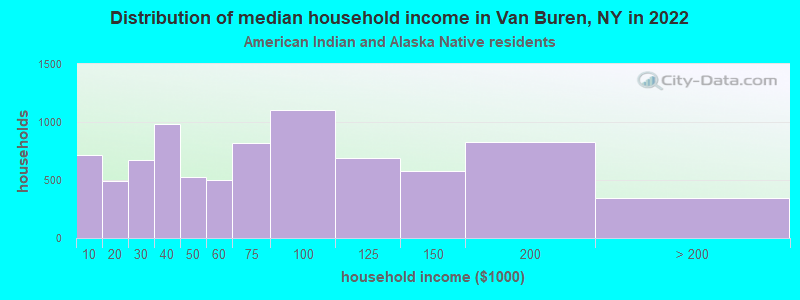
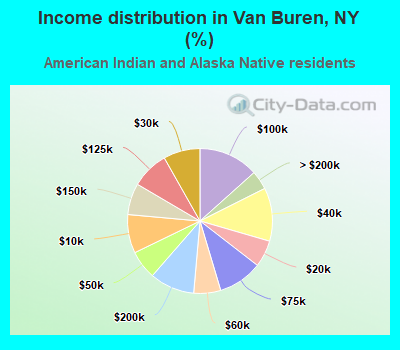
Income statistics for American Indian and Alaska Native residents
Median household income in Van Buren, NY in 2022:| Van Buren: | $24,295 |
| New York: | $63,208 |
Change in median household income between 2000 and 2022:| Van Buren, New York: | +103.9% |
| New York: | +110.1% |
Number of households with income < $10k:| Van Buren: | 8.6% (712) |
| State: | 8.6% (3,559) |
Number of households with income $10k - 20k:| Van Buren: | 6.0% (494) |
| New York: | 5.9% (2,455) |
Number of households with income $20k - 30k:| Van Buren: | 8.2% (676) |
| New York: | 8.2% (3,393) |
Number of households with income $30k - 40k:| Van Buren: | 11.9% (983) |
| State: | 11.9% (4,918) |
Number of households with income $40k - 50k:| Van Buren: | 6.4% (528) |
| State: | 6.5% (2,682) |
Number of households with income $50k - 60k:| Van Buren: | 6.0% (497) |
| State: | 6.1% (2,516) |
Number of households with income $60k - 75k:| Van Buren: | 9.9% (817) |
| State: | 10.0% (4,125) |
Number of households with income $75k - 100k:| Van Buren: | 13.4% (1,105) |
| State: | 13.3% (5,517) |
Number of households with income $100k - 125k:| Van Buren: | 8.4% (690) |
| State: | 8.4% (3,463) |
Number of households with income $125k - 150k:| Van Buren: | 7.0% (580) |
| State: | 7.0% (2,887) |
Number of households with income $150k - 200k:| Van Buren: | 10.0% (827) |
| State: | 9.9% (4,106) |
Number of households with income > $200k:| Van Buren: | 4.2% (349) |
| New York: | 4.2% (1,744) |
Aggregate household income in Van Buren in 2022: $739,055
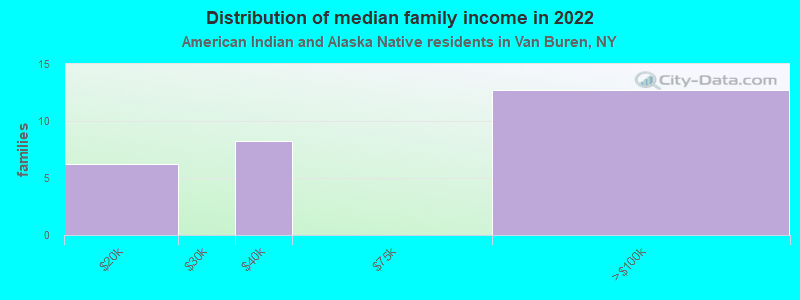
Median family income in Van Buren in 2022:| Van Buren: | $20,654 |
| State: | $69,721 |
Number of families with income $10k - 20k:| Van Buren: | 23.0% (6) |
| State: | 2.6% (761) |
Number of families with income $30k - 40k:| Van Buren: | 30.3% (8) |
| New York: | 12.0% (3,480) |
Number of families with income $75k - 100k:| Van Buren: | 46.7% (13) |
| State: | 14.9% (4,311) |
Median per capita income in Van Buren in 2022:| Van Buren: | $17,609 |
| State: | $25,837 |
Change in median per capita income between 2000 and 2022:| Van Buren, New York: | +67.7% |
| State: | +99.6% |
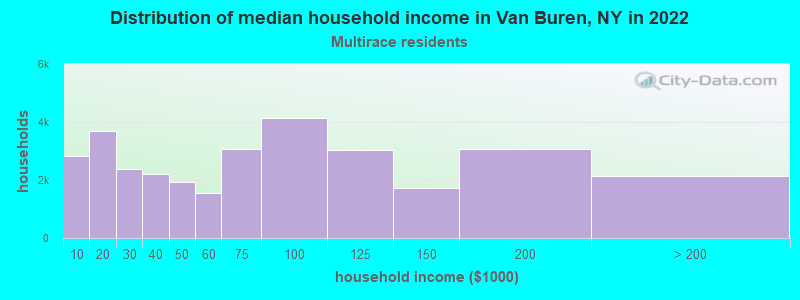
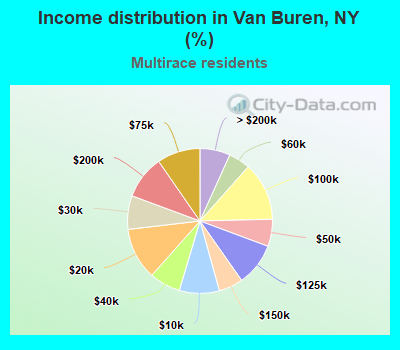
Income statistics for Multirace residents
Median household income in Van Buren, NY in 2022:| Van Buren: | $181,430 |
| New York: | $73,557 |
Change in median household income between 2000 and 2022:| Van Buren, New York: | +141.7% |
| State: | +123.9% |
Number of households with income < $10k:| Van Buren: | 8.9% (2,839) |
| State: | 8.9% (57,924) |
Number of households with income $10k - 20k:| Van Buren: | 11.6% (3,691) |
| State: | 8.7% (56,590) |
Number of households with income $20k - 30k:| Van Buren: | 7.5% (2,389) |
| State: | 7.1% (46,287) |
Number of households with income $30k - 40k:| Van Buren: | 6.9% (2,211) |
| New York: | 6.9% (45,132) |
Number of households with income $40k - 50k:| Van Buren: | 6.1% (1,930) |
| State: | 5.8% (37,946) |
Number of households with income $50k - 60k:| Van Buren: | 4.8% (1,536) |
| State: | 5.6% (36,410) |
Number of households with income $60k - 75k:| Van Buren: | 9.6% (3,069) |
| State: | 7.8% (50,819) |
Number of households with income $75k - 100k:| Van Buren: | 13.0% (4,147) |
| State: | 11.7% (76,024) |
Number of households with income $100k - 125k:| Van Buren: | 9.6% (3,050) |
| New York: | 9.3% (60,635) |
Number of households with income $125k - 150k:| Van Buren: | 5.4% (1,727) |
| New York: | 6.2% (40,533) |
Number of households with income $150k - 200k:| Van Buren: | 9.7% (3,086) |
| State: | 8.6% (56,409) |
Number of households with income > $200k:| Van Buren: | 6.8% (2,152) |
| State: | 13.4% (87,442) |
Aggregate household income in Van Buren in 2022: $7,673,027
Median non-family income in Van Buren in 2022:| Van Buren: | $238,513 |
| State: | $46,403 |
Median per capita income in Van Buren in 2022:| Van Buren: | $44,726 |
| New York: | $36,931 |
Income statistics for other residents
Number of households with income < $10k:| Van Buren: | 11.1% (6) |
| State: | 10.3% (69,252) |
Number of households with income $10k - 20k:| Van Buren: | 9.3% (5) |
| State: | 11.0% (73,890) |
Number of households with income $20k - 30k:| Van Buren: | 7.4% (4) |
| New York: | 8.8% (59,096) |
Number of households with income $30k - 40k:| Van Buren: | 7.4% (4) |
| State: | 8.1% (54,418) |
Number of households with income $40k - 50k:| Van Buren: | 7.4% (4) |
| State: | 7.3% (49,042) |
Number of households with income $50k - 60k:| Van Buren: | 5.6% (3) |
| New York: | 6.5% (43,945) |
Number of households with income $60k - 75k:| Van Buren: | 9.3% (5) |
| New York: | 9.5% (64,087) |
Number of households with income $75k - 100k:| Van Buren: | 11.1% (6) |
| State: | 10.9% (73,094) |
Number of households with income $100k - 125k:| Van Buren: | 9.3% (5) |
| State: | 7.9% (53,055) |
Number of households with income $125k - 150k:| Van Buren: | 5.6% (3) |
| State: | 5.9% (39,446) |
Number of households with income $150k - 200k:| Van Buren: | 9.3% (5) |
| State: | 7.2% (48,653) |
Number of households with income > $200k:| Van Buren: | 7.4% (4) |
| New York: | 6.6% (44,703) |
Aggregate household income in Van Buren in 2022: $1,476,511
Median family income in Van Buren in 2022:| Van Buren: | $208,688 |
| New York: | $63,465 |
Median per capita income in Van Buren in 2022:| Van Buren: | $96,160 |
| State: | $26,975 |