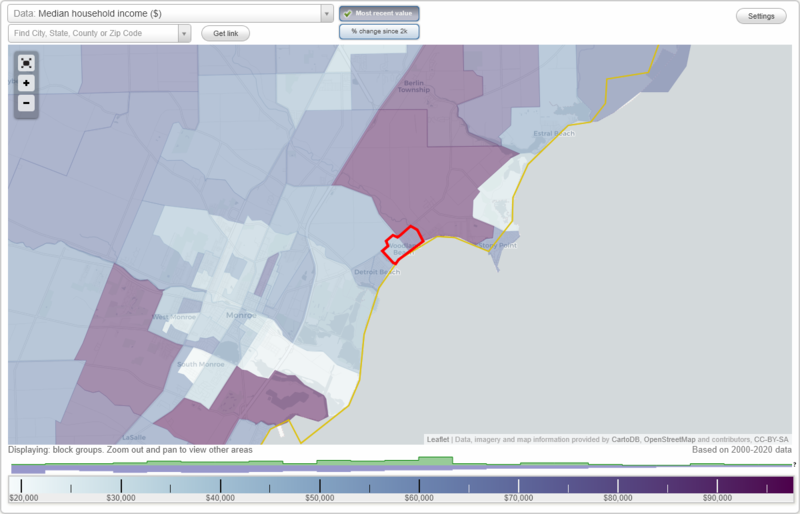
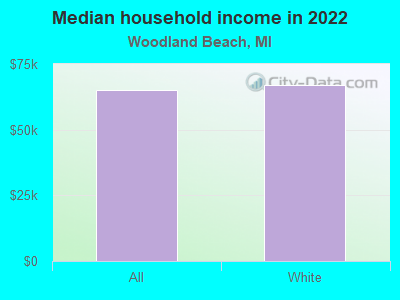
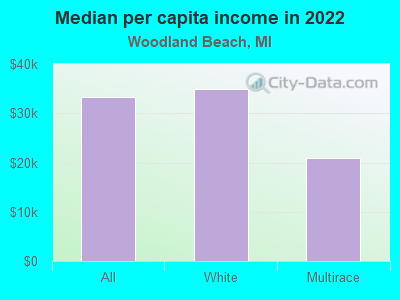
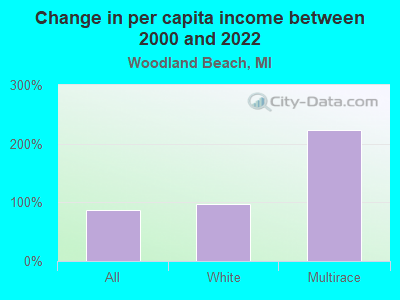
The median household income in Woodland Beach, MI in 2022 was $64,985, which was 3.1% less than the median annual income of $66,986 across the entire state of Michigan. Compared to the median income of $45,417 in 2000 this represents an increase of 30.1%. The per capita income in 2022 was $33,363, which means an increase of 46.6% compared to 2000 when it was $17,824.
Whole page based on the data from 2000 / 2022 when the population of Woodland Beach, Michigan was 2,179 / 2,611
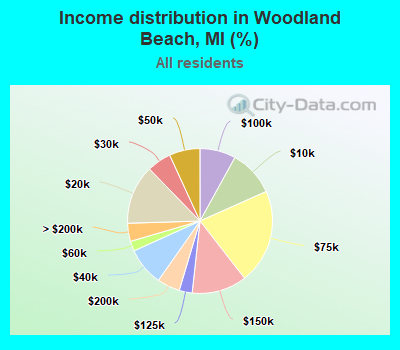
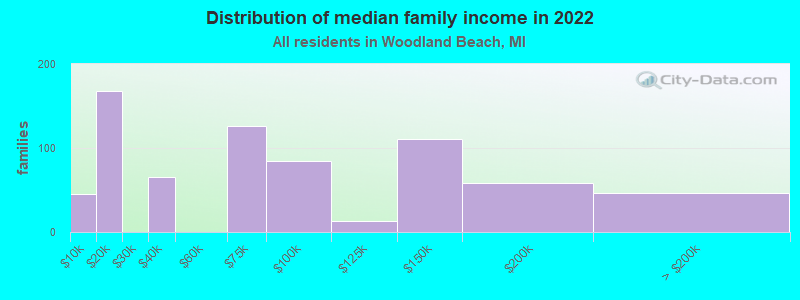
Income statistics for all residents
Median household income in Woodland Beach, MI in 2022:
Woodland Beach:
$64,985
Michigan:
$66,986
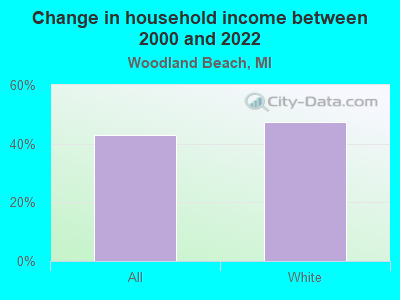
Change in median household income between 2000 and 2022:
Woodland Beach, Michigan:
+43.1%
State:
+50.0%
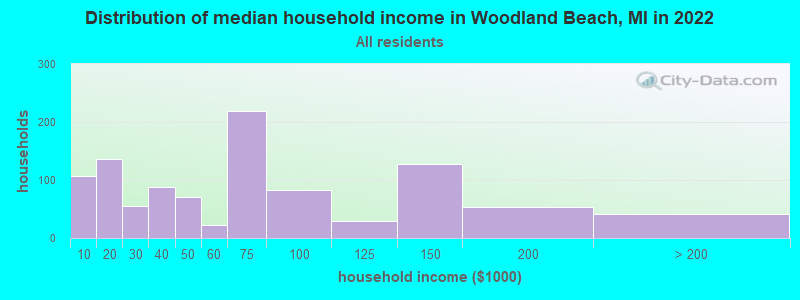
Number of households with income < $10k:
Woodland Beach:
10.3% (107)
State:
5.7% (231,223)
Number of households with income $10k - 20k:
Woodland Beach:
13.2% (137)
Michigan:
7.5% (306,955)
Number of households with income $20k - 30k:
Woodland Beach:
5.4% (56)
State:
7.9% (324,153)
Number of households with income $30k - 40k:
Woodland Beach:
8.5% (88)
State:
8.3% (341,408)
Number of households with income $40k - 50k:
Woodland Beach:
6.9% (71)
Michigan:
7.9% (322,255)
Number of households with income $50k - 60k:
Woodland Beach:
2.2% (23)
State:
7.5% (305,914)
Number of households with income $60k - 75k:
Woodland Beach:
21.1% (219)
State:
10.1% (414,440)
Number of households with income $75k - 100k:
Woodland Beach:
8.0% (83)
Michigan:
13.2% (538,299)
Number of households with income $100k - 125k:
Woodland Beach:
2.9% (30)
State:
9.7% (396,282)
Number of households with income $125k - 150k:
Woodland Beach:
12.3% (127)
Michigan:
6.7% (273,144)
Number of households with income $150k - 200k:
Woodland Beach:
5.1% (53)
State:
7.5% (305,077)
Number of households with income > $200k:
Woodland Beach:
4.1% (42)
State:
8.1% (330,644)
Aggregate household income in Woodland Beach in 2022: $82,118,727
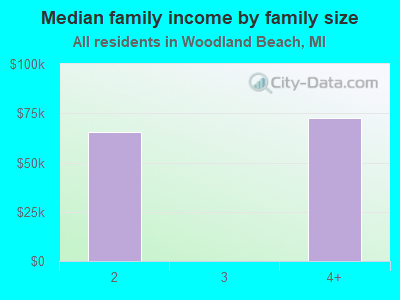
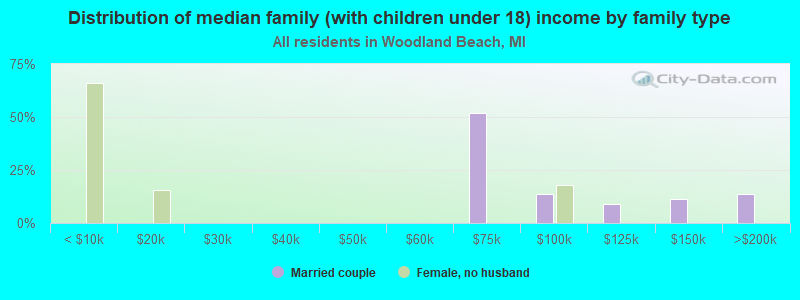
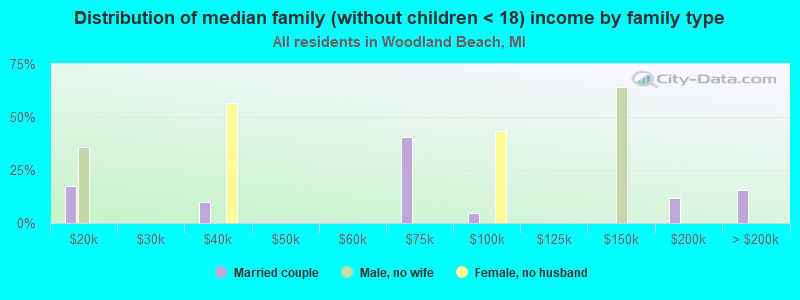
Median family income in Woodland Beach in 2022:
Woodland Beach:
$71,287
State:
$85,865
Number of families with income < $10k:
Woodland Beach:
6.3% (45)
Michigan:
3.5% (89,010)
Number of families with income $10k - 20k:
Woodland Beach:
23.5% (168)
Michigan:
3.9% (100,567)
Number of families with income $30k - 40k:
Woodland Beach:
9.2% (66)
State:
6.4% (163,565)
Number of families with income $60k - 75k:
Woodland Beach:
17.6% (126)
State:
10.3% (263,723)
Number of families with income $75k - 100k:
Woodland Beach:
11.7% (84)
Michigan:
15.0% (383,364)
Number of families with income $100k - 125k:
Woodland Beach:
1.8% (13)
Michigan:
11.8% (301,751)
Number of families with income $125k - 150k:
Woodland Beach:
15.5% (111)
State:
8.6% (220,338)
Number of families with income $150k - 200k:
Woodland Beach:
8.2% (58)
Michigan:
10.2% (259,462)
Number of families with income > $200k:
Woodland Beach:
6.4% (46)
Michigan:
11.3% (287,206)
Median per capita income in Woodland Beach in 2022:
Woodland Beach:
$33,364
Michigan:
$38,151
Change in median per capita income between 2000 and 2022:
Woodland Beach, Michigan:
+87.2%
State:
+72.1%
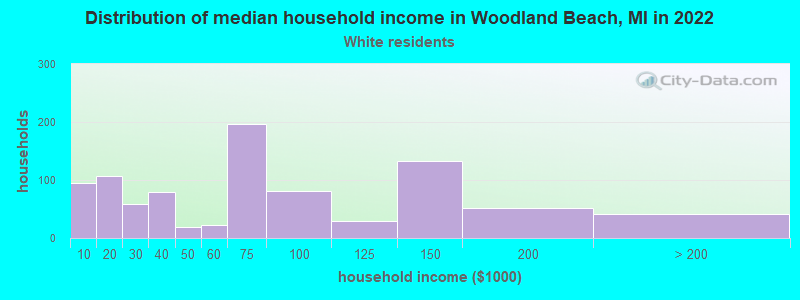
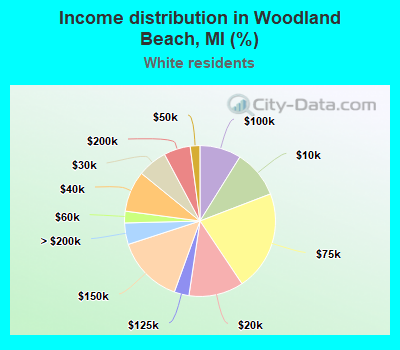
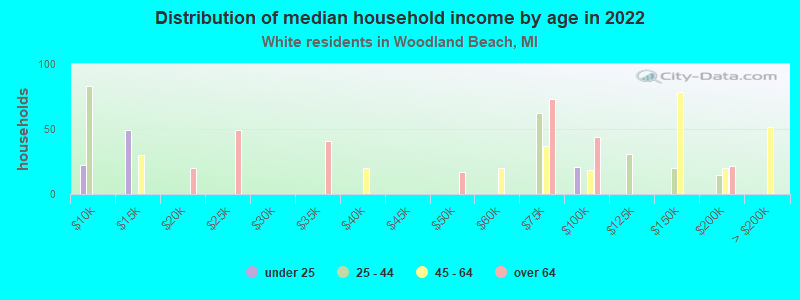
Income statistics for White residents
Median household income in Woodland Beach, MI in 2022:
Woodland Beach:
$66,937
State:
$71,609
Change in median household income between 2000 and 2022:
Woodland Beach, Michigan:
+47.5%
State:
+52.9%
Number of households with income < $10k:
Woodland Beach:
10.3% (94)
Michigan:
4.4% (140,440)
Number of households with income $10k - 20k:
Woodland Beach:
11.7% (107)
State:
6.5% (205,547)
Number of households with income $20k - 30k:
Woodland Beach:
6.4% (58)
State:
7.6% (242,254)
Number of households with income $30k - 40k:
Woodland Beach:
8.8% (80)
State:
8.1% (257,175)
Number of households with income $40k - 50k:
Woodland Beach:
2.1% (19)
State:
7.8% (246,839)
Number of households with income $50k - 60k:
Woodland Beach:
2.5% (23)
State:
7.4% (233,723)
Number of households with income $60k - 75k:
Woodland Beach:
21.5% (196)
State:
10.4% (328,664)
Number of households with income $75k - 100k:
Woodland Beach:
8.9% (81)
Michigan:
13.6% (431,867)
Number of households with income $100k - 125k:
Woodland Beach:
3.2% (29)
State:
10.3% (325,164)
Number of households with income $125k - 150k:
Woodland Beach:
14.5% (132)
Michigan:
7.1% (226,232)
Number of households with income $150k - 200k:
Woodland Beach:
5.7% (52)
Michigan:
8.1% (255,445)
Number of households with income > $200k:
Woodland Beach:
4.6% (42)
State:
8.7% (276,727)
Aggregate household income in Woodland Beach in 2022: $78,541,594
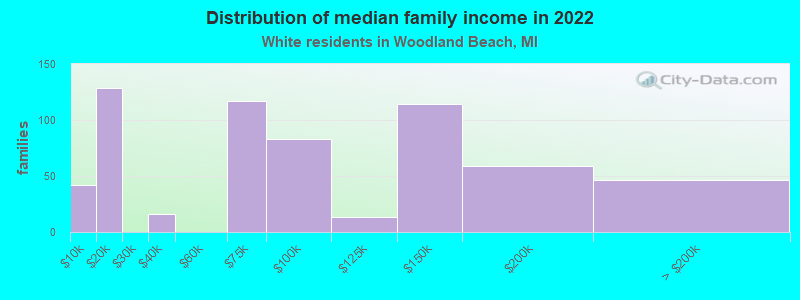
Median family income in Woodland Beach in 2022:
Woodland Beach:
$72,327
State:
$90,317
Number of families with income < $10k:
Woodland Beach:
6.8% (42)
Michigan:
2.5% (49,508)
Number of families with income $10k - 20k:
Woodland Beach:
20.8% (129)
State:
3.2% (64,106)
Number of families with income $30k - 40k:
Woodland Beach:
2.6% (16)
State:
5.9% (117,356)
Number of families with income $60k - 75k:
Woodland Beach:
19.0% (117)
State:
10.5% (209,130)
Number of families with income $75k - 100k:
Woodland Beach:
13.4% (83)
State:
15.5% (309,815)
Number of families with income $100k - 125k:
Woodland Beach:
2.0% (13)
State:
12.4% (248,235)
Number of families with income $125k - 150k:
Woodland Beach:
18.5% (114)
State:
9.2% (182,895)
Number of families with income $150k - 200k:
Woodland Beach:
9.5% (59)
State:
11.0% (218,573)
Number of families with income > $200k:
Woodland Beach:
7.4% (46)
State:
12.0% (239,713)
Median per capita income in Woodland Beach in 2022:
Woodland Beach:
$34,992
Michigan:
$41,514
Change in median per capita income between 2000 and 2022:
Woodland Beach, Michigan:
+97.3%
State:
+75.2%
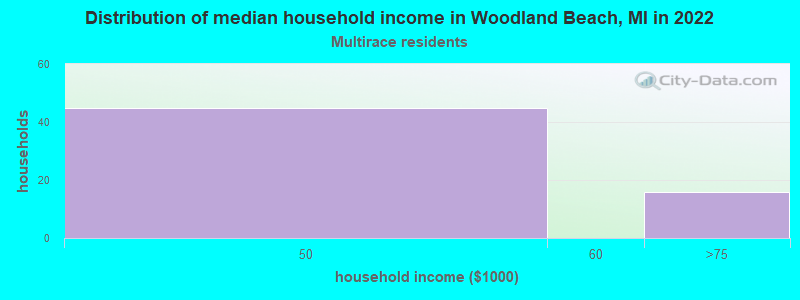
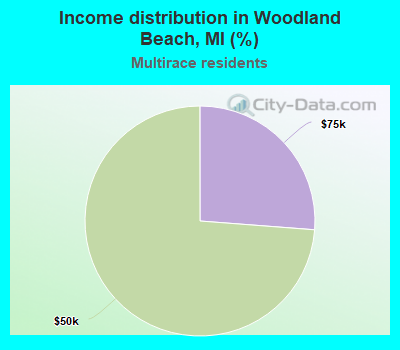
Income statistics for Multirace residents
Number of households with income < $10k:
Woodland Beach:
0.0% (0)
State:
6.1% (12,463)
Number of households with income $10k - 20k:
Woodland Beach:
0.0% (0)
State:
8.7% (17,830)
Number of households with income $20k - 30k:
Woodland Beach:
0.0% (0)
State:
7.6% (15,686)
Number of households with income $30k - 40k:
Woodland Beach:
0.0% (0)
State:
9.5% (19,444)
Number of households with income $40k - 50k:
Woodland Beach:
73.8% (45)
Michigan:
7.5% (15,476)
Number of households with income $50k - 60k:
Woodland Beach:
0.0% (0)
Michigan:
8.1% (16,622)
Number of households with income $60k - 75k:
Woodland Beach:
26.2% (16)
State:
10.6% (21,725)
Number of households with income $75k - 100k:
Woodland Beach:
0.0% (0)
State:
14.4% (29,501)
Number of households with income $100k - 125k:
Woodland Beach:
0.0% (0)
State:
8.9% (18,231)
Number of households with income $125k - 150k:
Woodland Beach:
0.0% (0)
State:
5.8% (11,923)
Number of households with income $150k - 200k:
Woodland Beach:
0.0% (0)
State:
6.8% (13,956)
Number of households with income > $200k:
Woodland Beach:
0.0% (0)
State:
6.2% (12,672)
Aggregate household income in Woodland Beach in 2022: $935,144
Median per capita income in Woodland Beach in 2022:
Woodland Beach:
$20,866
State:
$26,098
Discuss Woodland Beach, Michigan (MI) on our hugely popular Michigan forum.