East Orange, New Jersey Neighborhood Map - Income, House Prices, Occupations, Boundaries
Settings
X

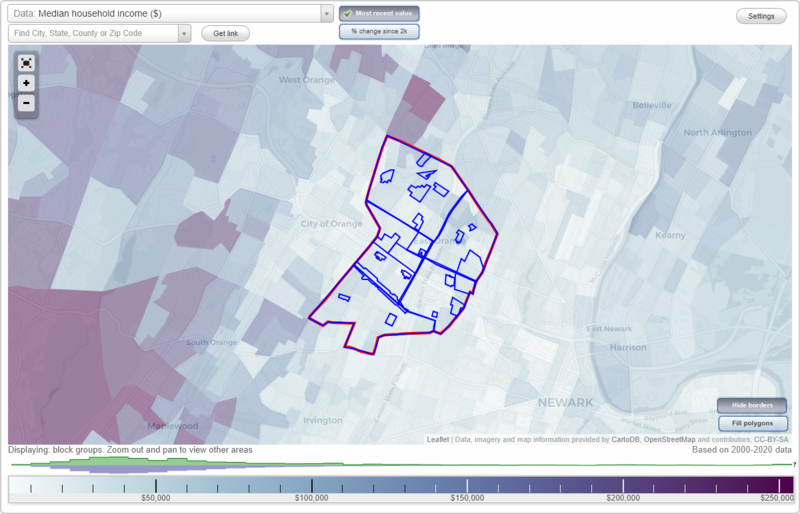
- City boundary
- Neighborhood boundaries
Business Search - 14 Million verified businesses
Neighborhoods:
Arcadian Gardens, Central Avenue, Columbian Playground, East Orange Oval, Elmwood Park, Evergreen / Halsted, Greenwood, Haire Playground, Lower Main Street, Marren's Park, Memorial Park, Muir's Berkeley, Multiplex Concrete, North Walnut Street, Rowley Park, Rutledge, Scottfield Park, Soverel Park, Upsala, Ward 1, Ward 2, Ward 3, Ward 4, Ward 5, Washington Playground, Watsessing County ParkArcadian Gardens neighborhood in East Orange statistics: (Find on map)
Area: 0.027 square miles
Population: 192
Population density:
Median household income in 2021:
Median rent in in 2021:
Male vs Females
Median age
Most popular occupations of males: service occupations (27.7%); transportation occupations (22.8%); healthcare practitioners and technical occupations (21.7%); sales and office occupations (10.8%); material moving occupations (9.2%); production occupations (4.2%); construction, extraction, and maintenance occupations (1.9%)
Most popular occupations of females: service occupations (60.1%); sales and office occupations (36.2%); community and social services occupations (6.8%); healthcare practitioners and technical occupations (5.8%); management occupations (except farmers) (3.3%); education, training, and library occupations (2.7%); business and financial operations occupations (2.4%)
Roads and streets: Sussex Ave; S 15th St.
Arcadian Gardens neighborhood detailed profile
Area: 0.027 square miles
Population: 192
Population density:
| Arcadian Gardens: | 6,988 people per square mile |
| East Orange: | 17,540 people per square mile |
Median household income in 2021:
| Arcadian Gardens: | $41,729 |
| East Orange: | $51,368 |
Median rent in in 2021:
| Arcadian Gardens: | $1,379 |
| East Orange: | $1,125 |
Male vs Females
| Males: | 103 |
| Females: | 89 |
Median age
| Males: | 39.8 years |
| Females: | 39.4 years |
Most popular occupations of males: service occupations (27.7%); transportation occupations (22.8%); healthcare practitioners and technical occupations (21.7%); sales and office occupations (10.8%); material moving occupations (9.2%); production occupations (4.2%); construction, extraction, and maintenance occupations (1.9%)
Most popular occupations of females: service occupations (60.1%); sales and office occupations (36.2%); community and social services occupations (6.8%); healthcare practitioners and technical occupations (5.8%); management occupations (except farmers) (3.3%); education, training, and library occupations (2.7%); business and financial operations occupations (2.4%)
Roads and streets: Sussex Ave; S 15th St.
Arcadian Gardens neighborhood detailed profile
Central Avenue neighborhood in East Orange statistics: (Find on map)
Area: 0.073 square miles
Population: 1,248
Population density:
Median household income in 2021:
Median rent in in 2021:
Male vs Females
Median age
Housing prices:
Average estimated value of detached houses in 2021 (19.8% of all units):
Average estimated '21 value of housing units in 5-or-more-unit structures (28.9% of all units):
Most popular occupations of males: sales and office occupations (26.0%); service occupations (16.6%); material moving occupations (13.0%); transportation occupations (8.5%); construction, extraction, and maintenance occupations (7.9%); computer and mathematical occupations (6.1%); production occupations (5.5%)
Most popular occupations of females: sales and office occupations (31.4%); service occupations (30.6%); community and social services occupations (9.4%); healthcare practitioners and technical occupations (8.7%); management occupations (except farmers) (5.7%); business and financial operations occupations (4.4%); production occupations (1.8%)
Roads and streets: Central Ave (Rte 508); Freeman Ave; S Munn Ave.
Central Avenue neighborhood detailed profile
Area: 0.073 square miles
Population: 1,248
Population density:
| Central Avenue: | 17,079 people per square mile |
| East Orange: | 17,540 people per square mile |
Median household income in 2021:
| Central Avenue: | $64,448 |
| East Orange: | $51,368 |
Median rent in in 2021:
| Central Avenue: | $1,245 |
| East Orange: | $1,125 |
Male vs Females
| Males: | 587 |
| Females: | 661 |
Median age
| Males: | 35.4 years |
| Females: | 41.5 years |
Housing prices:
Average estimated value of detached houses in 2021 (19.8% of all units):
| Central Avenue: | $194,401 |
| East Orange: | $302,515 |
Average estimated '21 value of housing units in 5-or-more-unit structures (28.9% of all units):
| Central Avenue: | $129,023 |
| East Orange: | $80,785 |
Most popular occupations of males: sales and office occupations (26.0%); service occupations (16.6%); material moving occupations (13.0%); transportation occupations (8.5%); construction, extraction, and maintenance occupations (7.9%); computer and mathematical occupations (6.1%); production occupations (5.5%)
Most popular occupations of females: sales and office occupations (31.4%); service occupations (30.6%); community and social services occupations (9.4%); healthcare practitioners and technical occupations (8.7%); management occupations (except farmers) (5.7%); business and financial operations occupations (4.4%); production occupations (1.8%)
Roads and streets: Central Ave (Rte 508); Freeman Ave; S Munn Ave.
Central Avenue neighborhood detailed profile
Columbian Playground neighborhood in East Orange statistics: (Find on map)
Area: 0.011 square miles
Population: 154
Population density:
Median household income in 2021:
Median rent in in 2021:
Male vs Females
Median age
Most popular occupations of males: service occupations (93.4%); management occupations (except farmers) (86.8%); sales and office occupations (58.5%); transportation occupations (41.5%); construction, extraction, and maintenance occupations (29.4%); production occupations (4.3%); material moving occupations (3.9%)
Most popular occupations of females: healthcare practitioners and technical occupations (72.2%); service occupations (19.1%); community and social services occupations (17.8%); sales and office occupations (14.6%); education, training, and library occupations (13.2%); management occupations (except farmers) (5.3%); material moving occupations (3.8%)
Columbian Playground neighborhood detailed profile
Area: 0.011 square miles
Population: 154
Population density:
| Columbian Playground: | 14,608 people per square mile |
| East Orange: | 17,540 people per square mile |
Median household income in 2021:
| Columbian Playground: | $49,826 |
| East Orange: | $51,368 |
Median rent in in 2021:
| Columbian Playground: | $1,108 |
| East Orange: | $1,125 |
Male vs Females
| Males: | 93 |
| Females: | 61 |
Median age
| Males: | 38.6 years |
| Females: | 60.2 years |
Most popular occupations of males: service occupations (93.4%); management occupations (except farmers) (86.8%); sales and office occupations (58.5%); transportation occupations (41.5%); construction, extraction, and maintenance occupations (29.4%); production occupations (4.3%); material moving occupations (3.9%)
Most popular occupations of females: healthcare practitioners and technical occupations (72.2%); service occupations (19.1%); community and social services occupations (17.8%); sales and office occupations (14.6%); education, training, and library occupations (13.2%); management occupations (except farmers) (5.3%); material moving occupations (3.8%)
Columbian Playground neighborhood detailed profile
East Orange Oval neighborhood in East Orange statistics: (Find on map)
Area: 0.015 square miles
Population: 331
Population density:
Median household income in 2021:
Median rent in in 2021:
Male vs Females
Median age
Housing prices:
Average estimated value of detached houses in 2021 (26.3% of all units):
Average estimated value of housing units in 2-unit structures in 2021 (9.0% of all units):
Most popular occupations of males: sales and office occupations (59.9%); service occupations (16.0%); material moving occupations (11.3%); business and financial operations occupations (8.0%); computer and mathematical occupations (4.7%); arts, design, entertainment, sports, and media occupations (1.1%)
Most popular occupations of females: service occupations (32.3%); education, training, and library occupations (31.7%); community and social services occupations (20.9%); healthcare practitioners and technical occupations (12.0%); sales and office occupations (3.0%)
East Orange Oval neighborhood detailed profile
Area: 0.015 square miles
Population: 331
Population density:
| East Orange Oval: | 22,498 people per square mile |
| East Orange: | 17,540 people per square mile |
Median household income in 2021:
| East Orange Oval: | $39,717 |
| East Orange: | $51,368 |
Median rent in in 2021:
| East Orange Oval: | $1,683 |
| East Orange: | $1,125 |
Male vs Females
| Males: | 176 |
| Females: | 154 |
Median age
| Males: | 35.7 years |
| Females: | 31.7 years |
Housing prices:
Average estimated value of detached houses in 2021 (26.3% of all units):
| East Orange Oval: | $265,475 |
| East Orange: | $302,515 |
Average estimated value of housing units in 2-unit structures in 2021 (9.0% of all units):
| This neighborhood: | $298,824 |
| East Orange: | $309,306 |
Most popular occupations of males: sales and office occupations (59.9%); service occupations (16.0%); material moving occupations (11.3%); business and financial operations occupations (8.0%); computer and mathematical occupations (4.7%); arts, design, entertainment, sports, and media occupations (1.1%)
Most popular occupations of females: service occupations (32.3%); education, training, and library occupations (31.7%); community and social services occupations (20.9%); healthcare practitioners and technical occupations (12.0%); sales and office occupations (3.0%)
East Orange Oval neighborhood detailed profile
Elmwood Park neighborhood in East Orange statistics: (Find on map)
Area: 0.014 square miles
Population: 149
Population density:
Median household income in 2021:
Median rent in in 2021:
Male vs Females
Median age
Average estimated value of detached houses in 2021 (43.8% of all units):
Most popular occupations of males: business and financial operations occupations (31.6%); sales and office occupations (22.5%); community and social services occupations (13.7%); management occupations (except farmers) (8.8%); healthcare practitioners and technical occupations (8.8%); material moving occupations (7.4%); service occupations (6.4%)
Most popular occupations of females: sales and office occupations (48.9%); healthcare practitioners and technical occupations (20.5%); community and social services occupations (18.4%); service occupations (5.0%); architecture and engineering occupations (4.9%); arts, design, entertainment, sports, and media occupations (3.5%); business and financial operations occupations (3.4%)
Elmwood Park neighborhood detailed profile
Area: 0.014 square miles
Population: 149
Population density:
| Elmwood Park: | 10,839 people per square mile |
| East Orange: | 17,540 people per square mile |
Median household income in 2021:
| Elmwood Park: | $77,972 |
| East Orange: | $51,368 |
Median rent in in 2021:
| Elmwood Park: | $982 |
| East Orange: | $1,125 |
Male vs Females
| Males: | 55 |
| Females: | 94 |
Median age
| Males: | 43.1 years |
| Females: | 35.0 years |
Average estimated value of detached houses in 2021 (43.8% of all units):
| Elmwood Park: | $228,345 |
| East Orange: | $302,515 |
Most popular occupations of males: business and financial operations occupations (31.6%); sales and office occupations (22.5%); community and social services occupations (13.7%); management occupations (except farmers) (8.8%); healthcare practitioners and technical occupations (8.8%); material moving occupations (7.4%); service occupations (6.4%)
Most popular occupations of females: sales and office occupations (48.9%); healthcare practitioners and technical occupations (20.5%); community and social services occupations (18.4%); service occupations (5.0%); architecture and engineering occupations (4.9%); arts, design, entertainment, sports, and media occupations (3.5%); business and financial operations occupations (3.4%)
Elmwood Park neighborhood detailed profile
Evergreen / Halsted neighborhood in East Orange statistics: (Find on map)
Area: 0.008 square miles
Population: 184
Population density:
Median household income in 2021:
Median rent in in 2021:
Male vs Females
Median age
Most popular occupations of males: service occupations (26.1%); sales and office occupations (19.0%); transportation occupations (18.5%); construction, extraction, and maintenance occupations (8.8%); computer and mathematical occupations (7.9%); business and financial operations occupations (5.4%); material moving occupations (4.2%)
Most popular occupations of females: service occupations (52.7%); sales and office occupations (31.4%); healthcare practitioners and technical occupations (7.5%); community and social services occupations (4.1%); education, training, and library occupations (2.8%); material moving occupations (1.3%)
Evergreen / Halsted neighborhood detailed profile
Area: 0.008 square miles
Population: 184
Population density:
| Evergreen / Halsted: | 21,772 people per square mile |
| East Orange: | 17,540 people per square mile |
Median household income in 2021:
| Evergreen / Halsted: | $59,506 |
| East Orange: | $51,368 |
Median rent in in 2021:
| Evergreen / Halsted: | $1,394 |
| East Orange: | $1,125 |
Male vs Females
| Males: | 89 |
| Females: | 94 |
Median age
| Males: | 34.8 years |
| Females: | 34.5 years |
Most popular occupations of males: service occupations (26.1%); sales and office occupations (19.0%); transportation occupations (18.5%); construction, extraction, and maintenance occupations (8.8%); computer and mathematical occupations (7.9%); business and financial operations occupations (5.4%); material moving occupations (4.2%)
Most popular occupations of females: service occupations (52.7%); sales and office occupations (31.4%); healthcare practitioners and technical occupations (7.5%); community and social services occupations (4.1%); education, training, and library occupations (2.8%); material moving occupations (1.3%)
Evergreen / Halsted neighborhood detailed profile
Greenwood neighborhood in East Orange statistics: (Find on map)
Area: 0.147 square miles
Population: 4,231
Population density:
Median household income in 2021:
Median rent in in 2021:
Male vs Females
Median age
Housing prices:
Average estimated value of detached houses in 2021 (19.2% of all units):
Average estimated value of townhouses or other attached units in 2021 (7.9% of all units):
Average estimated value of housing units in 2-unit structures in 2021 (25.6% of all units):
Average estimated '21 value of housing units in 3-to-4-unit structures (30.6% of all units):
Most popular occupations of males: service occupations (28.3%); material moving occupations (14.9%); sales and office occupations (12.1%); transportation occupations (9.7%); management occupations (except farmers) (7.9%); construction, extraction, and maintenance occupations (6.8%); production occupations (5.9%)
Most popular occupations of females: sales and office occupations (31.7%); service occupations (28.2%); management occupations (except farmers) (7.5%); education, training, and library occupations (7.4%); healthcare practitioners and technical occupations (6.1%); community and social services occupations (5.3%); business and financial operations occupations (4.4%)
Roads and streets: N 19th St; N 18th St; N 17th St; N 16th St; N 15th St; Park Ave; Eaton Pl; William St; Greenwood Ave; Essex County 658.
Greenwood neighborhood detailed profile
Area: 0.147 square miles
Population: 4,231
Population density:
| Greenwood: | 28,765 people per square mile |
| East Orange: | 17,540 people per square mile |
Median household income in 2021:
| Greenwood: | $52,546 |
| East Orange: | $51,368 |
Median rent in in 2021:
| Greenwood: | $1,062 |
| East Orange: | $1,125 |
Male vs Females
| Males: | 1,959 |
| Females: | 2,272 |
Median age
| Males: | 35.9 years |
| Females: | 33.7 years |
Housing prices:
Average estimated value of detached houses in 2021 (19.2% of all units):
| Greenwood: | $212,855 |
| East Orange: | $302,515 |
Average estimated value of townhouses or other attached units in 2021 (7.9% of all units):
| This neighborhood: | $202,032 |
| city: | $347,893 |
Average estimated value of housing units in 2-unit structures in 2021 (25.6% of all units):
| This neighborhood: | $298,824 |
| East Orange: | $309,306 |
Average estimated '21 value of housing units in 3-to-4-unit structures (30.6% of all units):
| Greenwood: | $366,345 |
| city: | $288,834 |
Most popular occupations of males: service occupations (28.3%); material moving occupations (14.9%); sales and office occupations (12.1%); transportation occupations (9.7%); management occupations (except farmers) (7.9%); construction, extraction, and maintenance occupations (6.8%); production occupations (5.9%)
Most popular occupations of females: sales and office occupations (31.7%); service occupations (28.2%); management occupations (except farmers) (7.5%); education, training, and library occupations (7.4%); healthcare practitioners and technical occupations (6.1%); community and social services occupations (5.3%); business and financial operations occupations (4.4%)
Roads and streets: N 19th St; N 18th St; N 17th St; N 16th St; N 15th St; Park Ave; Eaton Pl; William St; Greenwood Ave; Essex County 658.
Greenwood neighborhood detailed profile
Haire Playground neighborhood in East Orange statistics: (Find on map)
Area: 0.004 square miles
Population: 26
Population density:
Median household income in 2021:
Median rent in in 2021:
Male vs Females
Median age
Most popular occupations of males: material moving occupations (42.3%); sales and office occupations (36.1%); construction, extraction, and maintenance occupations (25.6%); transportation occupations (21.2%); production occupations (15.3%); healthcare practitioners and technical occupations (14.6%); service occupations (12.4%)
Most popular occupations of females: service occupations (52.4%); sales and office occupations (27.7%); healthcare practitioners and technical occupations (11.7%); computer and mathematical occupations (8.3%); community and social services occupations (5.4%); management occupations (except farmers) (3.2%); business and financial operations occupations (2.3%)
Haire Playground neighborhood detailed profile
Area: 0.004 square miles
Population: 26
Population density:
| Haire Playground: | 7,209 people per square mile |
| East Orange: | 17,540 people per square mile |
Median household income in 2021:
| Haire Playground: | $22,880 |
| East Orange: | $51,368 |
Median rent in in 2021:
| Haire Playground: | $302 |
| East Orange: | $1,125 |
Male vs Females
| Males: | 8 |
| Females: | 17 |
Median age
| Males: | 41.3 years |
| Females: | 54.2 years |
Most popular occupations of males: material moving occupations (42.3%); sales and office occupations (36.1%); construction, extraction, and maintenance occupations (25.6%); transportation occupations (21.2%); production occupations (15.3%); healthcare practitioners and technical occupations (14.6%); service occupations (12.4%)
Most popular occupations of females: service occupations (52.4%); sales and office occupations (27.7%); healthcare practitioners and technical occupations (11.7%); computer and mathematical occupations (8.3%); community and social services occupations (5.4%); management occupations (except farmers) (3.2%); business and financial operations occupations (2.3%)
Haire Playground neighborhood detailed profile
Lower Main Street neighborhood in East Orange statistics: (Find on map)
Area: 0.089 square miles
Population: 1,858
Population density:
Median household income in 2021:
Median rent in in 2021:
Male vs Females
Median age
Average estimated value of detached houses in 2021 (3.9% of all units):
Most popular occupations of males: service occupations (28.0%); transportation occupations (25.4%); material moving occupations (16.3%); sales and office occupations (12.8%); construction, extraction, and maintenance occupations (4.7%); production occupations (2.1%); management occupations (except farmers) (2.0%)
Most popular occupations of females: service occupations (41.8%); sales and office occupations (30.8%); material moving occupations (7.7%); healthcare practitioners and technical occupations (4.9%); computer and mathematical occupations (3.8%); business and financial operations occupations (3.5%); community and social services occupations (2.9%)
Roads and streets: Dr Martin Luther King Jr Blvd (Main St); Freeway Dr W; N Arlington Ave; Halsted St; City Hall Plz; S Clinton St; S Burnett St; S Walnut St.
Railroad features: N J Transit RR.
Lower Main Street neighborhood detailed profile
Area: 0.089 square miles
Population: 1,858
Population density:
| Lower Main Street: | 20,820 people per square mile |
| East Orange: | 17,540 people per square mile |
Median household income in 2021:
| Lower Main Street: | $46,207 |
| East Orange: | $51,368 |
Median rent in in 2021:
| Lower Main Street: | $1,020 |
| East Orange: | $1,125 |
Male vs Females
| Males: | 901 |
| Females: | 956 |
Median age
| Males: | 34.4 years |
| Females: | 33.2 years |
Average estimated value of detached houses in 2021 (3.9% of all units):
| Lower Main Street: | $215,000 |
| East Orange: | $302,515 |
Most popular occupations of males: service occupations (28.0%); transportation occupations (25.4%); material moving occupations (16.3%); sales and office occupations (12.8%); construction, extraction, and maintenance occupations (4.7%); production occupations (2.1%); management occupations (except farmers) (2.0%)
Most popular occupations of females: service occupations (41.8%); sales and office occupations (30.8%); material moving occupations (7.7%); healthcare practitioners and technical occupations (4.9%); computer and mathematical occupations (3.8%); business and financial operations occupations (3.5%); community and social services occupations (2.9%)
Roads and streets: Dr Martin Luther King Jr Blvd (Main St); Freeway Dr W; N Arlington Ave; Halsted St; City Hall Plz; S Clinton St; S Burnett St; S Walnut St.
Railroad features: N J Transit RR.
Lower Main Street neighborhood detailed profile
Marren's Park neighborhood in East Orange statistics: (Find on map)
Area: 0.017 square miles
Population: 125
Population density:
Median household income in 2021:
Median rent in in 2021:
Male vs Females
Median age
Most popular occupations of males: sales and office occupations (84.9%); service occupations (55.3%); material moving occupations (19.2%); community and social services occupations (18.9%); transportation occupations (17.4%); computer and mathematical occupations (15.1%); arts, design, entertainment, sports, and media occupations (12.4%)
Most popular occupations of females: transportation occupations (32.1%); sales and office occupations (20.2%); service occupations (16.2%); management occupations (except farmers) (15.4%); education, training, and library occupations (9.2%); material moving occupations (6.0%); business and financial operations occupations (4.6%)
Marren's Park neighborhood detailed profile
Area: 0.017 square miles
Population: 125
Population density:
| Marren's Park: | 7,237 people per square mile |
| East Orange: | 17,540 people per square mile |
Median household income in 2021:
| Marren's Park: | $60,018 |
| East Orange: | $51,368 |
Median rent in in 2021:
| Marren's Park: | $1,255 |
| East Orange: | $1,125 |
Male vs Females
| Males: | 37 |
| Females: | 87 |
Median age
| Males: | 24.3 years |
| Females: | 39.2 years |
Most popular occupations of males: sales and office occupations (84.9%); service occupations (55.3%); material moving occupations (19.2%); community and social services occupations (18.9%); transportation occupations (17.4%); computer and mathematical occupations (15.1%); arts, design, entertainment, sports, and media occupations (12.4%)
Most popular occupations of females: transportation occupations (32.1%); sales and office occupations (20.2%); service occupations (16.2%); management occupations (except farmers) (15.4%); education, training, and library occupations (9.2%); material moving occupations (6.0%); business and financial operations occupations (4.6%)
Marren's Park neighborhood detailed profile
Memorial Park neighborhood in East Orange statistics: (Find on map)
Area: 0.007 square miles
Population: 128
Population density:
Median household income in 2021:
Median rent in in 2021:
Male vs Females
Median age
Most popular occupations of males: material moving occupations (32.7%); service occupations (29.1%); arts, design, entertainment, sports, and media occupations (20.8%); sales and office occupations (10.2%); transportation occupations (7.1%)
Most popular occupations of females: service occupations (49.9%); sales and office occupations (28.9%); arts, design, entertainment, sports, and media occupations (14.5%); production occupations (12.8%); business and financial operations occupations (8.3%); construction, extraction, and maintenance occupations (7.3%)
Memorial Park neighborhood detailed profile
Area: 0.007 square miles
Population: 128
Population density:
| Memorial Park: | 17,067 people per square mile |
| East Orange: | 17,540 people per square mile |
Median household income in 2021:
| Memorial Park: | $50,527 |
| East Orange: | $51,368 |
Median rent in in 2021:
| Memorial Park: | $596 |
| East Orange: | $1,125 |
Male vs Females
| Males: | 65 |
| Females: | 63 |
Median age
| Males: | 36.0 years |
| Females: | 34.6 years |
Most popular occupations of males: material moving occupations (32.7%); service occupations (29.1%); arts, design, entertainment, sports, and media occupations (20.8%); sales and office occupations (10.2%); transportation occupations (7.1%)
Most popular occupations of females: service occupations (49.9%); sales and office occupations (28.9%); arts, design, entertainment, sports, and media occupations (14.5%); production occupations (12.8%); business and financial operations occupations (8.3%); construction, extraction, and maintenance occupations (7.3%)
Memorial Park neighborhood detailed profile
Muir's Berkeley neighborhood in East Orange statistics: (Find on map)
Area: 0.048 square miles
Population: 596
Population density:
Median household income in 2021:
Median rent in in 2021:
Male vs Females
Median age
Most popular occupations of males: service occupations (35.8%); construction, extraction, and maintenance occupations (15.7%); transportation occupations (13.1%); material moving occupations (12.0%); business and financial operations occupations (10.3%); management occupations (except farmers) (6.0%); architecture and engineering occupations (4.1%)
Most popular occupations of females: sales and office occupations (50.6%); service occupations (31.3%); education, training, and library occupations (8.7%); healthcare practitioners and technical occupations (5.4%); production occupations (2.9%); material moving occupations (1.5%); community and social services occupations (1.3%)
Roads and streets: Brick Church Plz; Dr Martin Luther King Jr Blvd (Main St); William St; Evergreen Pl; N Harrison St; Prospect St.
Railroad features: N J Transit RR.
Muir's Berkeley neighborhood detailed profile
Area: 0.048 square miles
Population: 596
Population density:
| Muir's Berkeley: | 12,362 people per square mile |
| East Orange: | 17,540 people per square mile |
Median household income in 2021:
| Muir's Berkeley: | $52,886 |
| East Orange: | $51,368 |
Median rent in in 2021:
| Muir's Berkeley: | $1,248 |
| East Orange: | $1,125 |
Male vs Females
| Males: | 216 |
| Females: | 379 |
Median age
| Males: | 34.3 years |
| Females: | 30.3 years |
Most popular occupations of males: service occupations (35.8%); construction, extraction, and maintenance occupations (15.7%); transportation occupations (13.1%); material moving occupations (12.0%); business and financial operations occupations (10.3%); management occupations (except farmers) (6.0%); architecture and engineering occupations (4.1%)
Most popular occupations of females: sales and office occupations (50.6%); service occupations (31.3%); education, training, and library occupations (8.7%); healthcare practitioners and technical occupations (5.4%); production occupations (2.9%); material moving occupations (1.5%); community and social services occupations (1.3%)
Roads and streets: Brick Church Plz; Dr Martin Luther King Jr Blvd (Main St); William St; Evergreen Pl; N Harrison St; Prospect St.
Railroad features: N J Transit RR.
Muir's Berkeley neighborhood detailed profile
Multiplex Concrete neighborhood in East Orange statistics: (Find on map)
Area: 0.010 square miles
Population: 89
Population density:
Median household income in 2021:
Median rent in in 2021:
Male vs Females
Median age
Housing prices:
Average estimated value of detached houses in 2021 (32.4% of all units):
Average estimated value of housing units in 2-unit structures in 2021 (23.5% of all units):
Average estimated '21 value of housing units in 3-to-4-unit structures (20.6% of all units):
Most popular occupations of males: sales and office occupations (36.3%); material moving occupations (13.9%); production occupations (9.4%); service occupations (9.2%); transportation occupations (7.5%); construction, extraction, and maintenance occupations (7.0%); architecture and engineering occupations (5.0%)
Most popular occupations of females: sales and office occupations (22.9%); service occupations (22.8%); business and financial operations occupations (18.2%); management occupations (except farmers) (11.8%); healthcare practitioners and technical occupations (8.3%); education, training, and library occupations (5.1%); production occupations (3.9%)
Multiplex Concrete neighborhood detailed profile
Area: 0.010 square miles
Population: 89
Population density:
| Multiplex Concrete: | 8,564 people per square mile |
| East Orange: | 17,540 people per square mile |
Median household income in 2021:
| Multiplex Concrete: | $72,047 |
| East Orange: | $51,368 |
Median rent in in 2021:
| Multiplex Concrete: | $1,287 |
| East Orange: | $1,125 |
Male vs Females
| Males: | 33 |
| Females: | 56 |
Median age
| Males: | 32.9 years |
| Females: | 37.3 years |
Housing prices:
Average estimated value of detached houses in 2021 (32.4% of all units):
| Multiplex Concrete: | $242,462 |
| East Orange: | $302,515 |
Average estimated value of housing units in 2-unit structures in 2021 (23.5% of all units):
| This neighborhood: | $257,713 |
| East Orange: | $309,306 |
Average estimated '21 value of housing units in 3-to-4-unit structures (20.6% of all units):
| Multiplex Concrete: | $199,467 |
| city: | $288,834 |
Most popular occupations of males: sales and office occupations (36.3%); material moving occupations (13.9%); production occupations (9.4%); service occupations (9.2%); transportation occupations (7.5%); construction, extraction, and maintenance occupations (7.0%); architecture and engineering occupations (5.0%)
Most popular occupations of females: sales and office occupations (22.9%); service occupations (22.8%); business and financial operations occupations (18.2%); management occupations (except farmers) (11.8%); healthcare practitioners and technical occupations (8.3%); education, training, and library occupations (5.1%); production occupations (3.9%)
Multiplex Concrete neighborhood detailed profile
North Walnut Street neighborhood in East Orange statistics: (Find on map)
Area: 0.065 square miles
Population: 1,940
Population density:
Median household income in 2021:
Median rent in in 2021:
Male vs Females
Median age
Most popular occupations of males: service occupations (47.9%); transportation occupations (25.7%); production occupations (5.7%); management occupations (except farmers) (5.1%); construction, extraction, and maintenance occupations (5.0%); healthcare practitioners and technical occupations (4.9%); sales and office occupations (3.0%)
Most popular occupations of females: service occupations (48.2%); sales and office occupations (22.4%); computer and mathematical occupations (7.6%); business and financial operations occupations (6.7%); community and social services occupations (6.1%); material moving occupations (5.1%); healthcare practitioners and technical occupations (2.1%)
Roads and streets: William St; Summit St; N Clinton St; N Walnut St; N Arlington Ave.
North Walnut Street neighborhood detailed profile
Area: 0.065 square miles
Population: 1,940
Population density:
| North Walnut Street: | 29,692 people per square mile |
| East Orange: | 17,540 people per square mile |
Median household income in 2021:
| North Walnut Street: | $53,540 |
| East Orange: | $51,368 |
Median rent in in 2021:
| North Walnut Street: | $977 |
| East Orange: | $1,125 |
Male vs Females
| Males: | 834 |
| Females: | 1,106 |
Median age
| Males: | 40.2 years |
| Females: | 35.5 years |
Most popular occupations of males: service occupations (47.9%); transportation occupations (25.7%); production occupations (5.7%); management occupations (except farmers) (5.1%); construction, extraction, and maintenance occupations (5.0%); healthcare practitioners and technical occupations (4.9%); sales and office occupations (3.0%)
Most popular occupations of females: service occupations (48.2%); sales and office occupations (22.4%); computer and mathematical occupations (7.6%); business and financial operations occupations (6.7%); community and social services occupations (6.1%); material moving occupations (5.1%); healthcare practitioners and technical occupations (2.1%)
Roads and streets: William St; Summit St; N Clinton St; N Walnut St; N Arlington Ave.
North Walnut Street neighborhood detailed profile
Rowley Park neighborhood in East Orange statistics: (Find on map)
Area: 0.006 square miles
Population: 184
Population density:
Median household income in 2021:
Median rent in in 2021:
Male vs Females
Median age
Most popular occupations of males: service occupations (53.9%); transportation occupations (27.9%); sales and office occupations (13.0%); material moving occupations (10.9%); management occupations (except farmers) (7.0%); production occupations (6.6%); healthcare practitioners and technical occupations (5.6%)
Most popular occupations of females: service occupations (49.5%); sales and office occupations (22.6%); computer and mathematical occupations (7.9%); business and financial operations occupations (6.4%); community and social services occupations (5.2%); material moving occupations (5.1%); healthcare practitioners and technical occupations (1.9%)
Rowley Park neighborhood detailed profile
Area: 0.006 square miles
Population: 184
Population density:
| Rowley Park: | 30,551 people per square mile |
| East Orange: | 17,540 people per square mile |
Median household income in 2021:
| Rowley Park: | $43,313 |
| East Orange: | $51,368 |
Median rent in in 2021:
| Rowley Park: | $972 |
| East Orange: | $1,125 |
Male vs Females
| Males: | 77 |
| Females: | 106 |
Median age
| Males: | 30.1 years |
| Females: | 32.8 years |
Most popular occupations of males: service occupations (53.9%); transportation occupations (27.9%); sales and office occupations (13.0%); material moving occupations (10.9%); management occupations (except farmers) (7.0%); production occupations (6.6%); healthcare practitioners and technical occupations (5.6%)
Most popular occupations of females: service occupations (49.5%); sales and office occupations (22.6%); computer and mathematical occupations (7.9%); business and financial operations occupations (6.4%); community and social services occupations (5.2%); material moving occupations (5.1%); healthcare practitioners and technical occupations (1.9%)
Rowley Park neighborhood detailed profile
Rutledge neighborhood in East Orange statistics: (Find on map)
Area: 0.004 square miles
Population: 53
Population density:
Median household income in 2021:
Median rent in in 2021:
Male vs Females
Median age
Most popular occupations of males: service occupations (37.4%); construction, extraction, and maintenance occupations (20.7%); computer and mathematical occupations (14.8%); sales and office occupations (13.9%); education, training, and library occupations (10.0%); transportation occupations (8.6%); production occupations (6.4%)
Most popular occupations of females: sales and office occupations (50.7%); healthcare practitioners and technical occupations (16.5%); service occupations (11.5%); computer and mathematical occupations (5.1%); education, training, and library occupations (4.3%); transportation occupations (4.3%); arts, design, entertainment, sports, and media occupations (3.0%)
Rutledge neighborhood detailed profile
Area: 0.004 square miles
Population: 53
Population density:
| Rutledge: | 12,531 people per square mile |
| East Orange: | 17,540 people per square mile |
Median household income in 2021:
| Rutledge: | $78,048 |
| East Orange: | $51,368 |
Median rent in in 2021:
| Rutledge: | $965 |
| East Orange: | $1,125 |
Male vs Females
| Males: | 18 |
| Females: | 34 |
Median age
| Males: | 42.4 years |
| Females: | 42.0 years |
Most popular occupations of males: service occupations (37.4%); construction, extraction, and maintenance occupations (20.7%); computer and mathematical occupations (14.8%); sales and office occupations (13.9%); education, training, and library occupations (10.0%); transportation occupations (8.6%); production occupations (6.4%)
Most popular occupations of females: sales and office occupations (50.7%); healthcare practitioners and technical occupations (16.5%); service occupations (11.5%); computer and mathematical occupations (5.1%); education, training, and library occupations (4.3%); transportation occupations (4.3%); arts, design, entertainment, sports, and media occupations (3.0%)
Rutledge neighborhood detailed profile
Scottfield Park neighborhood in East Orange statistics: (Find on map)
Area: 0.017 square miles
Population: 114
Population density:
Median household income in 2021:
Median rent in in 2021:
Male vs Females
Median age
Housing prices:
Average estimated value of detached houses in 2021 (61.7% of all units):
Average estimated value of townhouses or other attached units in 2021 (19.1% of all units):
Average estimated value of housing units in 2-unit structures in 2021 (17.0% of all units):
Average estimated '21 value of housing units in 3-to-4-unit structures (8.5% of all units):
Most popular occupations of males: service occupations (38.8%); transportation occupations (12.9%); construction, extraction, and maintenance occupations (8.6%); management occupations (except farmers) (7.2%); material moving occupations (7.2%); production occupations (7.0%); healthcare practitioners and technical occupations (4.3%)
Most popular occupations of females: sales and office occupations (35.7%); service occupations (29.1%); community and social services occupations (10.2%); management occupations (except farmers) (9.2%); production occupations (5.6%); healthcare practitioners and technical occupations (4.0%); business and financial operations occupations (3.6%)
Scottfield Park neighborhood detailed profile
Area: 0.017 square miles
Population: 114
Population density:
| Scottfield Park: | 6,550 people per square mile |
| East Orange: | 17,540 people per square mile |
Median household income in 2021:
| Scottfield Park: | $98,783 |
| East Orange: | $51,368 |
Median rent in in 2021:
| Scottfield Park: | $1,290 |
| East Orange: | $1,125 |
Male vs Females
| Males: | 42 |
| Females: | 71 |
Median age
| Males: | 47.5 years |
| Females: | 48.6 years |
Housing prices:
Average estimated value of detached houses in 2021 (61.7% of all units):
| Scottfield Park: | $236,760 |
| East Orange: | $302,515 |
Average estimated value of townhouses or other attached units in 2021 (19.1% of all units):
| This neighborhood: | $204,900 |
| city: | $347,893 |
Average estimated value of housing units in 2-unit structures in 2021 (17.0% of all units):
| This neighborhood: | $257,713 |
| East Orange: | $309,306 |
Average estimated '21 value of housing units in 3-to-4-unit structures (8.5% of all units):
| Scottfield Park: | $199,467 |
| city: | $288,834 |
Most popular occupations of males: service occupations (38.8%); transportation occupations (12.9%); construction, extraction, and maintenance occupations (8.6%); management occupations (except farmers) (7.2%); material moving occupations (7.2%); production occupations (7.0%); healthcare practitioners and technical occupations (4.3%)
Most popular occupations of females: sales and office occupations (35.7%); service occupations (29.1%); community and social services occupations (10.2%); management occupations (except farmers) (9.2%); production occupations (5.6%); healthcare practitioners and technical occupations (4.0%); business and financial operations occupations (3.6%)
Scottfield Park neighborhood detailed profile
Soverel Park neighborhood in East Orange statistics: (Find on map)
Area: 0.020 square miles
Population: 465
Population density:
Median household income in 2021:
Median rent in in 2021:
Male vs Females
Median age
Housing prices:
Average estimated value of detached houses in 2021 (14.1% of all units):
Average estimated value of housing units in 2-unit structures in 2021 (47.0% of all units):
Average estimated '21 value of housing units in 3-to-4-unit structures (12.1% of all units):
Most popular occupations of males: service occupations (38.6%); transportation occupations (26.5%); production occupations (14.1%); sales and office occupations (13.1%); computer and mathematical occupations (7.3%); community and social services occupations (3.6%)
Most popular occupations of females: service occupations (67.5%); management occupations (except farmers) (10.6%); sales and office occupations (6.9%); business and financial operations occupations (5.0%); production occupations (3.5%); healthcare practitioners and technical occupations (3.3%); life, physical, and social science occupations (3.0%)
Other features: 2nd Riv.
Soverel Park neighborhood detailed profile
Area: 0.020 square miles
Population: 465
Population density:
| Soverel Park: | 23,639 people per square mile |
| East Orange: | 17,540 people per square mile |
Median household income in 2021:
| Soverel Park: | $50,416 |
| East Orange: | $51,368 |
Median rent in in 2021:
| Soverel Park: | $927 |
| East Orange: | $1,125 |
Male vs Females
| Males: | 226 |
| Females: | 238 |
Median age
| Males: | 53.4 years |
| Females: | 55.9 years |
Housing prices:
Average estimated value of detached houses in 2021 (14.1% of all units):
| Soverel Park: | $211,891 |
| East Orange: | $302,515 |
Average estimated value of housing units in 2-unit structures in 2021 (47.0% of all units):
| This neighborhood: | $109,702 |
| East Orange: | $309,306 |
Average estimated '21 value of housing units in 3-to-4-unit structures (12.1% of all units):
| Soverel Park: | $343,517 |
| city: | $288,834 |
Most popular occupations of males: service occupations (38.6%); transportation occupations (26.5%); production occupations (14.1%); sales and office occupations (13.1%); computer and mathematical occupations (7.3%); community and social services occupations (3.6%)
Most popular occupations of females: service occupations (67.5%); management occupations (except farmers) (10.6%); sales and office occupations (6.9%); business and financial operations occupations (5.0%); production occupations (3.5%); healthcare practitioners and technical occupations (3.3%); life, physical, and social science occupations (3.0%)
Other features: 2nd Riv.
Soverel Park neighborhood detailed profile
Upsala neighborhood in East Orange statistics: (Find on map)
Area: 0.038 square miles
Population: 318
Population density:
Median household income in 2021:
Median rent in in 2021:
Male vs Females
Median age
Housing prices:
Average estimated value of detached houses in 2021 (34.7% of all units):
Average estimated value of townhouses or other attached units in 2021 (6.6% of all units):
Average estimated value of housing units in 2-unit structures in 2021 (24.8% of all units):
Average estimated '21 value of housing units in 3-to-4-unit structures (24.0% of all units):
Most popular occupations of males: sales and office occupations (39.3%); material moving occupations (12.8%); production occupations (9.6%); transportation occupations (8.0%); service occupations (7.5%); construction, extraction, and maintenance occupations (7.5%); architecture and engineering occupations (5.3%)
Most popular occupations of females: sales and office occupations (23.7%); service occupations (21.1%); business and financial operations occupations (18.4%); management occupations (except farmers) (12.0%); healthcare practitioners and technical occupations (7.0%); education, training, and library occupations (5.3%); production occupations (3.9%)
Roads and streets: Woodland Ave; Upsala Ct; College Ave; Fernwood Rd.
Upsala neighborhood detailed profile
Area: 0.038 square miles
Population: 318
Population density:
| Upsala: | 8,369 people per square mile |
| East Orange: | 17,540 people per square mile |
Median household income in 2021:
| Upsala: | $62,771 |
| East Orange: | $51,368 |
Median rent in in 2021:
| Upsala: | $1,289 |
| East Orange: | $1,125 |
Male vs Females
| Males: | 115 |
| Females: | 202 |
Median age
| Males: | 28.3 years |
| Females: | 37.5 years |
Housing prices:
Average estimated value of detached houses in 2021 (34.7% of all units):
| Upsala: | $224,122 |
| East Orange: | $302,515 |
Average estimated value of townhouses or other attached units in 2021 (6.6% of all units):
| This neighborhood: | $204,900 |
| city: | $347,893 |
Average estimated value of housing units in 2-unit structures in 2021 (24.8% of all units):
| This neighborhood: | $257,713 |
| East Orange: | $309,306 |
Average estimated '21 value of housing units in 3-to-4-unit structures (24.0% of all units):
| Upsala: | $79,877 |
| city: | $288,834 |
Most popular occupations of males: sales and office occupations (39.3%); material moving occupations (12.8%); production occupations (9.6%); transportation occupations (8.0%); service occupations (7.5%); construction, extraction, and maintenance occupations (7.5%); architecture and engineering occupations (5.3%)
Most popular occupations of females: sales and office occupations (23.7%); service occupations (21.1%); business and financial operations occupations (18.4%); management occupations (except farmers) (12.0%); healthcare practitioners and technical occupations (7.0%); education, training, and library occupations (5.3%); production occupations (3.9%)
Roads and streets: Woodland Ave; Upsala Ct; College Ave; Fernwood Rd.
Upsala neighborhood detailed profile
Ward 1 neighborhood in East Orange statistics: (Find on map)
Area: 1.116 square miles
Population: 12,961
Population density:
Median household income in 2021:
Median rent in in 2021:
Male vs Females
Median age
Housing prices:
Average estimated value of detached houses in 2021 (28.6% of all units):
Average estimated value of townhouses or other attached units in 2021 (5.7% of all units):
Average estimated value of housing units in 2-unit structures in 2021 (19.4% of all units):
Average estimated '21 value of housing units in 3-to-4-unit structures (12.3% of all units):
Most popular occupations of males: service occupations (27.5%); sales and office occupations (16.8%); production occupations (10.3%); material moving occupations (9.6%); transportation occupations (8.7%); construction, extraction, and maintenance occupations (4.2%); business and financial operations occupations (4.1%)
Most popular occupations of females: service occupations (33.8%); sales and office occupations (24.8%); management occupations (except farmers) (11.0%); healthcare practitioners and technical occupations (6.3%); transportation occupations (6.2%); business and financial operations occupations (5.6%); education, training, and library occupations (4.4%)
Limited-access highways (interstate or state) in this neighborhood: Garden State Pkwy.
Roads and streets: Springdale Ave; Park Ave; Dodd St; N Walnut St; Glenwood Ave; Prospect St; N Clinton St; N Arlington Ave; Woodland Ave; Midland Ave; N Park St; Parkway Dr; Brighton Ave; Renshaw Ave; Hamilton St; Burchard Ave; Lincoln St; Fair St; E Park St; Washington St; Girard Ave; Norman St; Glenwood Pl; Franklin St; Marcy Ave; Ely Pl; Edgerton Ter; Eastwood St; Long St; Fernwood Rd; Hilton St; Everett St; Schuyler Ter; Rutledge Ave; Cleveland Ter; Colonial Ter; Crescent Rd; Morris St; Kenmore Ter; Linwood Pl; Fulton St; Lawrence St; Boyden St; Meadow St; Morse Ave; Charles St; Edgewood Rd; Upsala Ct; Kensington Pl; College Ave; Kearney St; Lake St; Park St; Cottage Pl; Soverel Ter; Glen Park Rd; Dodd Ter; Hayward St; Netherwood Ter; Park Pl; ; Norman Pl; Thornton Pl.
Railroad features: Erie-Lackawanna RR.
Other features: 2nd Riv; Nishuane Brk.
Ward 1 neighborhood detailed profile
Area: 1.116 square miles
Population: 12,961
Population density:
| Ward 1: | 11,614 people per square mile |
| East Orange: | 17,540 people per square mile |
Median household income in 2021:
| Ward 1: | $61,711 |
| East Orange: | $51,368 |
Median rent in in 2021:
| Ward 1: | $1,097 |
| East Orange: | $1,125 |
Male vs Females
| Males: | 5,627 |
| Females: | 7,333 |
Median age
| Males: | 38.0 years |
| Females: | 39.5 years |
Housing prices:
Average estimated value of detached houses in 2021 (28.6% of all units):
| Ward 1: | $245,335 |
| East Orange: | $302,515 |
Average estimated value of townhouses or other attached units in 2021 (5.7% of all units):
| This neighborhood: | $204,900 |
| city: | $347,893 |
Average estimated value of housing units in 2-unit structures in 2021 (19.4% of all units):
| This neighborhood: | $770,185 |
| East Orange: | $309,306 |
Average estimated '21 value of housing units in 3-to-4-unit structures (12.3% of all units):
| Ward 1: | $171,249 |
| city: | $288,834 |
Most popular occupations of males: service occupations (27.5%); sales and office occupations (16.8%); production occupations (10.3%); material moving occupations (9.6%); transportation occupations (8.7%); construction, extraction, and maintenance occupations (4.2%); business and financial operations occupations (4.1%)
Most popular occupations of females: service occupations (33.8%); sales and office occupations (24.8%); management occupations (except farmers) (11.0%); healthcare practitioners and technical occupations (6.3%); transportation occupations (6.2%); business and financial operations occupations (5.6%); education, training, and library occupations (4.4%)
Limited-access highways (interstate or state) in this neighborhood: Garden State Pkwy.
Roads and streets: Springdale Ave; Park Ave; Dodd St; N Walnut St; Glenwood Ave; Prospect St; N Clinton St; N Arlington Ave; Woodland Ave; Midland Ave; N Park St; Parkway Dr; Brighton Ave; Renshaw Ave; Hamilton St; Burchard Ave; Lincoln St; Fair St; E Park St; Washington St; Girard Ave; Norman St; Glenwood Pl; Franklin St; Marcy Ave; Ely Pl; Edgerton Ter; Eastwood St; Long St; Fernwood Rd; Hilton St; Everett St; Schuyler Ter; Rutledge Ave; Cleveland Ter; Colonial Ter; Crescent Rd; Morris St; Kenmore Ter; Linwood Pl; Fulton St; Lawrence St; Boyden St; Meadow St; Morse Ave; Charles St; Edgewood Rd; Upsala Ct; Kensington Pl; College Ave; Kearney St; Lake St; Park St; Cottage Pl; Soverel Ter; Glen Park Rd; Dodd Ter; Hayward St; Netherwood Ter; Park Pl; ; Norman Pl; Thornton Pl.
Railroad features: Erie-Lackawanna RR.
Other features: 2nd Riv; Nishuane Brk.
Ward 1 neighborhood detailed profile
Ward 2 neighborhood in East Orange statistics: (Find on map)
Area: 0.714 square miles
Population: 15,675
Population density:
Median household income in 2021:
Median rent in in 2021:
Male vs Females
Median age
Housing prices:
Average estimated value of detached houses in 2021 (9.4% of all units):
Average estimated '21 value of housing units in 5-or-more-unit structures (32.0% of all units):
Most popular occupations of males: service occupations (24.8%); sales and office occupations (16.5%); transportation occupations (11.7%); material moving occupations (10.1%); management occupations (except farmers) (9.9%); construction, extraction, and maintenance occupations (7.7%); production occupations (3.6%)
Most popular occupations of females: service occupations (31.8%); sales and office occupations (29.7%); healthcare practitioners and technical occupations (9.2%); business and financial operations occupations (5.8%); management occupations (except farmers) (5.6%); community and social services occupations (5.5%); production occupations (2.2%)
Limited-access highways (interstate or state) in this neighborhood: I- 280.
Roads and streets: Central Ave (Rte 508); William St; Dr Martin Luther King Jr Blvd (Main St); Freeway Dr E; Freeway Dr W; Evergreen Pl; Halsted St; S Harrison St; S Clinton St; S Burnett St; S Arlington Ave; Amherst St; Beech St; Chestnut St; Lenox Ave; N Clinton St; N Arlington Ave; Summit St; Lincoln St; N Walnut St; Prospect St; Carnegie Ave; Washington St; Ashland Ave; Carlton St; Melmore Gardens; Harvard St; Brick Church Plz; Winans St; S Walnut St; Washington Ter; Shepard Ave; Prospect Ter; N Burnett St; Morton Pl; Chelsea Pl; Nassau Pl; Glenwood Ave; Hillyer St; Halsted Pl; N Harrison St; University Pl; Baldwin St; City Hall Plz; Prospect Pl; Washington Pl.
Railroad features: N J Transit RR.
Ward 2 neighborhood detailed profile
Area: 0.714 square miles
Population: 15,675
Population density:
| Ward 2: | 21,950 people per square mile |
| East Orange: | 17,540 people per square mile |
Median household income in 2021:
| Ward 2: | $53,193 |
| East Orange: | $51,368 |
Median rent in in 2021:
| Ward 2: | $1,092 |
| East Orange: | $1,125 |
Male vs Females
| Males: | 7,307 |
| Females: | 8,368 |
Median age
| Males: | 37.5 years |
| Females: | 38.7 years |
Housing prices:
Average estimated value of detached houses in 2021 (9.4% of all units):
| Ward 2: | $215,000 |
| East Orange: | $302,515 |
Average estimated '21 value of housing units in 5-or-more-unit structures (32.0% of all units):
| Ward 2: | $129,023 |
| East Orange: | $80,785 |
Most popular occupations of males: service occupations (24.8%); sales and office occupations (16.5%); transportation occupations (11.7%); material moving occupations (10.1%); management occupations (except farmers) (9.9%); construction, extraction, and maintenance occupations (7.7%); production occupations (3.6%)
Most popular occupations of females: service occupations (31.8%); sales and office occupations (29.7%); healthcare practitioners and technical occupations (9.2%); business and financial operations occupations (5.8%); management occupations (except farmers) (5.6%); community and social services occupations (5.5%); production occupations (2.2%)
Limited-access highways (interstate or state) in this neighborhood: I- 280.
Roads and streets: Central Ave (Rte 508); William St; Dr Martin Luther King Jr Blvd (Main St); Freeway Dr E; Freeway Dr W; Evergreen Pl; Halsted St; S Harrison St; S Clinton St; S Burnett St; S Arlington Ave; Amherst St; Beech St; Chestnut St; Lenox Ave; N Clinton St; N Arlington Ave; Summit St; Lincoln St; N Walnut St; Prospect St; Carnegie Ave; Washington St; Ashland Ave; Carlton St; Melmore Gardens; Harvard St; Brick Church Plz; Winans St; S Walnut St; Washington Ter; Shepard Ave; Prospect Ter; N Burnett St; Morton Pl; Chelsea Pl; Nassau Pl; Glenwood Ave; Hillyer St; Halsted Pl; N Harrison St; University Pl; Baldwin St; City Hall Plz; Prospect Pl; Washington Pl.
Railroad features: N J Transit RR.
Ward 2 neighborhood detailed profile
Ward 3 neighborhood in East Orange statistics: (Find on map)
Area: 0.890 square miles
Population: 14,994
Population density:
Median household income in 2021:
Median rent in in 2021:
Male vs Females
Median age
Housing prices:
Average estimated value of detached houses in 2021 (30.0% of all units):
Average estimated value of housing units in 2-unit structures in 2021 (21.1% of all units):
Average estimated '21 value of housing units in 3-to-4-unit structures (19.9% of all units):
Most popular occupations of males: sales and office occupations (17.5%); service occupations (15.9%); material moving occupations (13.2%); construction, extraction, and maintenance occupations (9.0%); management occupations (except farmers) (8.4%); transportation occupations (7.4%); computer and mathematical occupations (4.9%)
Most popular occupations of females: sales and office occupations (25.9%); service occupations (22.6%); healthcare practitioners and technical occupations (11.6%); education, training, and library occupations (10.5%); community and social services occupations (8.9%); business and financial operations occupations (7.4%); management occupations (except farmers) (3.6%)
Roads and streets: Elmwood Ave; Tremont Ave; Rhode Island Ave; Sanford St; Halsted St; S Clinton St; Shepard Ave; Brookwood St; S Harrison St; Oak St; Freeman Ave; Eppirt St; Elliot Pl; Bedford St; Crawford St; Park End Pl; Norwood St; Telford St; Lindsley Pl; Amherst St; Madonna Pl; Kenwood Pl; McKay Ave; Rte 510 (S Orange Ave); Linden Ave; Clifford St; Sunnyside Ter; Edgar St; Mountainview Ave; Maybaum Ave; S Munn Ave; Wayne Ave; Hudson Ave; Melrose Ave; Ross St; Grand Ave; Wilcox Ave; Abbotsford Ave; S Arlington Ave; Irving St; Whittier St; Emerson St; Norwood Pl; Arsdale Ter; Vanderbilt Pl; Chelsea Ave; Clay St; Hillcrest Ter; Fairmount Ter; Garfield Pl; Watson Ave; Whittlesey Ave; S Burnett St; Hawthorne Pl.
Ward 3 neighborhood detailed profile
Area: 0.890 square miles
Population: 14,994
Population density:
| Ward 3: | 16,840 people per square mile |
| East Orange: | 17,540 people per square mile |
Median household income in 2021:
| Ward 3: | $63,253 |
| East Orange: | $51,368 |
Median rent in in 2021:
| Ward 3: | $1,219 |
| East Orange: | $1,125 |
Male vs Females
| Males: | 6,590 |
| Females: | 8,403 |
Median age
| Males: | 35.8 years |
| Females: | 41.6 years |
Housing prices:
Average estimated value of detached houses in 2021 (30.0% of all units):
| Ward 3: | $165,385 |
| East Orange: | $302,515 |
Average estimated value of housing units in 2-unit structures in 2021 (21.1% of all units):
| This neighborhood: | $260,367 |
| East Orange: | $309,306 |
Average estimated '21 value of housing units in 3-to-4-unit structures (19.9% of all units):
| Ward 3: | $184,570 |
| city: | $288,834 |
Most popular occupations of males: sales and office occupations (17.5%); service occupations (15.9%); material moving occupations (13.2%); construction, extraction, and maintenance occupations (9.0%); management occupations (except farmers) (8.4%); transportation occupations (7.4%); computer and mathematical occupations (4.9%)
Most popular occupations of females: sales and office occupations (25.9%); service occupations (22.6%); healthcare practitioners and technical occupations (11.6%); education, training, and library occupations (10.5%); community and social services occupations (8.9%); business and financial operations occupations (7.4%); management occupations (except farmers) (3.6%)
Roads and streets: Elmwood Ave; Tremont Ave; Rhode Island Ave; Sanford St; Halsted St; S Clinton St; Shepard Ave; Brookwood St; S Harrison St; Oak St; Freeman Ave; Eppirt St; Elliot Pl; Bedford St; Crawford St; Park End Pl; Norwood St; Telford St; Lindsley Pl; Amherst St; Madonna Pl; Kenwood Pl; McKay Ave; Rte 510 (S Orange Ave); Linden Ave; Clifford St; Sunnyside Ter; Edgar St; Mountainview Ave; Maybaum Ave; S Munn Ave; Wayne Ave; Hudson Ave; Melrose Ave; Ross St; Grand Ave; Wilcox Ave; Abbotsford Ave; S Arlington Ave; Irving St; Whittier St; Emerson St; Norwood Pl; Arsdale Ter; Vanderbilt Pl; Chelsea Ave; Clay St; Hillcrest Ter; Fairmount Ter; Garfield Pl; Watson Ave; Whittlesey Ave; S Burnett St; Hawthorne Pl.
Ward 3 neighborhood detailed profile
Ward 4 neighborhood in East Orange statistics: (Find on map)
Area: 0.594 square miles
Population: 11,661
Population density:
Median household income in 2021:
Median rent in in 2021:
Male vs Females
Median age
Housing prices:
Average estimated value of detached houses in 2021 (12.2% of all units):
Average estimated value of townhouses or other attached units in 2021 (4.9% of all units):
Average estimated value of housing units in 2-unit structures in 2021 (16.7% of all units):
Average estimated '21 value of housing units in 3-to-4-unit structures (11.6% of all units):
Average estimated '21 value of housing units in 5-or-more-unit structures (46.8% of all units):
Most popular occupations of males: service occupations (19.8%); sales and office occupations (18.1%); material moving occupations (15.6%); transportation occupations (12.7%); construction, extraction, and maintenance occupations (8.4%); management occupations (except farmers) (4.2%); production occupations (3.9%)
Most popular occupations of females: sales and office occupations (31.0%); service occupations (29.6%); education, training, and library occupations (7.3%); management occupations (except farmers) (7.1%); healthcare practitioners and technical occupations (5.7%); community and social services occupations (4.3%); material moving occupations (4.3%)
Limited-access highways (interstate or state) in this neighborhood: I- 280; Garden State Pkwy.
Roads and streets: Main St (Dr Martin Luther King Jr Blvd); William St; Central Ave (Rte 508); S Oraton Pkwy; N Oraton Pkwy; Sussex Ave; Freeway Dr E; Winthrop Ter; Eaton Pl; S Arlington Ave; S Grove St (Rte 509); S Munn Ave; Steuben St; New St; Hollywood Ave; N Munn Ave; 9th Ave; S Maple Ave; Hawthorne Ave; Greenwood Ave; N Arlington Ave; Rte 509 (N Grove St); N Maple Ave; Grove Pl; Chestnut St; Davis Pl; N 15th St; N 19th St; N 18th St; N 17th St; N 16th St; S 17th St; N Ward Pl; S 20th St; St Agnes Ln; City Hall Plz; Maple Ter; Division Pl; S Ward Pl; Church Pl; Ashland Pl; Davis Ave; Hedden Pl; S 15th St.
Railroad features: N J Transit RR.
Ward 4 neighborhood detailed profile
Area: 0.594 square miles
Population: 11,661
Population density:
| Ward 4: | 19,634 people per square mile |
| East Orange: | 17,540 people per square mile |
Median household income in 2021:
| Ward 4: | $46,538 |
| East Orange: | $51,368 |
Median rent in in 2021:
| Ward 4: | $1,011 |
| East Orange: | $1,125 |
Male vs Females
| Males: | 5,849 |
| Females: | 5,811 |
Median age
| Males: | 34.4 years |
| Females: | 38.3 years |
Housing prices:
Average estimated value of detached houses in 2021 (12.2% of all units):
| Ward 4: | $252,479 |
| East Orange: | $302,515 |
Average estimated value of townhouses or other attached units in 2021 (4.9% of all units):
| This neighborhood: | $202,032 |
| city: | $347,893 |
Average estimated value of housing units in 2-unit structures in 2021 (16.7% of all units):
| This neighborhood: | $298,808 |
| East Orange: | $309,306 |
Average estimated '21 value of housing units in 3-to-4-unit structures (11.6% of all units):
| Ward 4: | $259,756 |
| city: | $288,834 |
Average estimated '21 value of housing units in 5-or-more-unit structures (46.8% of all units):
| Ward 4: | $129,023 |
| East Orange: | $80,785 |
Most popular occupations of males: service occupations (19.8%); sales and office occupations (18.1%); material moving occupations (15.6%); transportation occupations (12.7%); construction, extraction, and maintenance occupations (8.4%); management occupations (except farmers) (4.2%); production occupations (3.9%)
Most popular occupations of females: sales and office occupations (31.0%); service occupations (29.6%); education, training, and library occupations (7.3%); management occupations (except farmers) (7.1%); healthcare practitioners and technical occupations (5.7%); community and social services occupations (4.3%); material moving occupations (4.3%)
Limited-access highways (interstate or state) in this neighborhood: I- 280; Garden State Pkwy.
Roads and streets: Main St (Dr Martin Luther King Jr Blvd); William St; Central Ave (Rte 508); S Oraton Pkwy; N Oraton Pkwy; Sussex Ave; Freeway Dr E; Winthrop Ter; Eaton Pl; S Arlington Ave; S Grove St (Rte 509); S Munn Ave; Steuben St; New St; Hollywood Ave; N Munn Ave; 9th Ave; S Maple Ave; Hawthorne Ave; Greenwood Ave; N Arlington Ave; Rte 509 (N Grove St); N Maple Ave; Grove Pl; Chestnut St; Davis Pl; N 15th St; N 19th St; N 18th St; N 17th St; N 16th St; S 17th St; N Ward Pl; S 20th St; St Agnes Ln; City Hall Plz; Maple Ter; Division Pl; S Ward Pl; Church Pl; Ashland Pl; Davis Ave; Hedden Pl; S 15th St.
Railroad features: N J Transit RR.
Ward 4 neighborhood detailed profile
Ward 5 neighborhood in East Orange statistics: (Find on map)
Area: 0.663 square miles
Population: 12,428
Population density:
Median household income in 2021:
Median rent in in 2021:
Male vs Females
Median age
Housing prices:
Average estimated value of detached houses in 2021 (23.2% of all units):
Average estimated value of townhouses or other attached units in 2021 (8.0% of all units):
Average estimated value of housing units in 2-unit structures in 2021 (17.4% of all units):
Average estimated '21 value of housing units in 3-to-4-unit structures (25.7% of all units):
Most popular occupations of males: service occupations (23.8%); construction, extraction, and maintenance occupations (15.8%); sales and office occupations (15.6%); transportation occupations (12.6%); management occupations (except farmers) (12.0%); material moving occupations (5.8%); production occupations (5.7%)
Most popular occupations of females: sales and office occupations (34.0%); service occupations (20.8%); healthcare practitioners and technical occupations (12.3%); education, training, and library occupations (7.9%); management occupations (except farmers) (6.1%); community and social services occupations (5.9%); business and financial operations occupations (3.8%)
Roads and streets: N Grove St (Rte 509); Springdale Ave; Park Ave; Rutledge Ave; N Maple Ave; 4th Ave; Hoffman Blvd; Roosevelt Ave; N Arlington Ave; Lafayette Ave; Ampere Pkwy; Warrington Pl; N 19th St; N Oraton Pkwy; Ellington St; N 18th St; N 22nd St; Parkway Dr; 1st Ave; Leslie St; Ampere Plz; N 15th St; N 17th St; Grant Ave; Madison Ave; N 16th St; N Munn Ave; N 21st St; Warwick St; Renshaw Ave; N 20th St; Vernon Pl; Centerway; Newfield St; N 23rd St; Rowe St; Lawton St; Whitman Ave; Sawyer Ave; Chauncey Ave; Whitney Pl; Little St; Crescent Pl; Vernon Ter; Division St; Abington Ave.
Railroad features: Erie-Lackawanna RR.
Ward 5 neighborhood detailed profile
Area: 0.663 square miles
Population: 12,428
Population density:
| Ward 5: | 18,732 people per square mile |
| East Orange: | 17,540 people per square mile |
Median household income in 2021:
| Ward 5: | $58,475 |
| East Orange: | $51,368 |
Median rent in in 2021:
| Ward 5: | $1,014 |
| East Orange: | $1,125 |
Male vs Females
| Males: | 5,613 |
| Females: | 6,814 |
Median age
| Males: | 36.3 years |
| Females: | 37.4 years |
Housing prices:
Average estimated value of detached houses in 2021 (23.2% of all units):
| Ward 5: | $206,977 |
| East Orange: | $302,515 |
Average estimated value of townhouses or other attached units in 2021 (8.0% of all units):
| This neighborhood: | $202,032 |
| city: | $347,893 |
Average estimated value of housing units in 2-unit structures in 2021 (17.4% of all units):
| This neighborhood: | $298,824 |
| East Orange: | $309,306 |
Average estimated '21 value of housing units in 3-to-4-unit structures (25.7% of all units):
| Ward 5: | $259,756 |
| city: | $288,834 |
Most popular occupations of males: service occupations (23.8%); construction, extraction, and maintenance occupations (15.8%); sales and office occupations (15.6%); transportation occupations (12.6%); management occupations (except farmers) (12.0%); material moving occupations (5.8%); production occupations (5.7%)
Most popular occupations of females: sales and office occupations (34.0%); service occupations (20.8%); healthcare practitioners and technical occupations (12.3%); education, training, and library occupations (7.9%); management occupations (except farmers) (6.1%); community and social services occupations (5.9%); business and financial operations occupations (3.8%)
Roads and streets: N Grove St (Rte 509); Springdale Ave; Park Ave; Rutledge Ave; N Maple Ave; 4th Ave; Hoffman Blvd; Roosevelt Ave; N Arlington Ave; Lafayette Ave; Ampere Pkwy; Warrington Pl; N 19th St; N Oraton Pkwy; Ellington St; N 18th St; N 22nd St; Parkway Dr; 1st Ave; Leslie St; Ampere Plz; N 15th St; N 17th St; Grant Ave; Madison Ave; N 16th St; N Munn Ave; N 21st St; Warwick St; Renshaw Ave; N 20th St; Vernon Pl; Centerway; Newfield St; N 23rd St; Rowe St; Lawton St; Whitman Ave; Sawyer Ave; Chauncey Ave; Whitney Pl; Little St; Crescent Pl; Vernon Ter; Division St; Abington Ave.
Railroad features: Erie-Lackawanna RR.
Ward 5 neighborhood detailed profile
Washington Playground neighborhood in East Orange statistics: (Find on map)
Area: 0.007 square miles
Population: 44
Population density:
Median household income in 2021:
Median rent in in 2021:
Male vs Females
Median age
Most popular occupations of males: computer and mathematical occupations (33.7%); service occupations (29.6%); education, training, and library occupations (21.1%); transportation occupations (20.2%); healthcare practitioners and technical occupations (16.9%); sales and office occupations (15.7%); management occupations (except farmers) (12.7%)
Most popular occupations of females: education, training, and library occupations (41.3%); sales and office occupations (25.4%); management occupations (except farmers) (17.5%); community and social services occupations (14.0%); arts, design, entertainment, sports, and media occupations (12.3%); business and financial operations occupations (11.4%); healthcare practitioners and technical occupations (9.6%)
Washington Playground neighborhood detailed profile
Area: 0.007 square miles
Population: 44
Population density:
| Washington Playground: | 6,427 people per square mile |
| East Orange: | 17,540 people per square mile |
Median household income in 2021:
| Washington Playground: | $106,518 |
| East Orange: | $51,368 |
Median rent in in 2021:
| Washington Playground: | $1,394 |
| East Orange: | $1,125 |
Male vs Females
| Males: | 20 |
| Females: | 23 |
Median age
| Males: | 67.1 years |
| Females: | 65.2 years |
Most popular occupations of males: computer and mathematical occupations (33.7%); service occupations (29.6%); education, training, and library occupations (21.1%); transportation occupations (20.2%); healthcare practitioners and technical occupations (16.9%); sales and office occupations (15.7%); management occupations (except farmers) (12.7%)
Most popular occupations of females: education, training, and library occupations (41.3%); sales and office occupations (25.4%); management occupations (except farmers) (17.5%); community and social services occupations (14.0%); arts, design, entertainment, sports, and media occupations (12.3%); business and financial operations occupations (11.4%); healthcare practitioners and technical occupations (9.6%)
Washington Playground neighborhood detailed profile
Watsessing County Park neighborhood in East Orange statistics: (Find on map)
Area: 0.016 square miles
Population: 193
Population density:
Median household income in 2021:
Median rent in in 2021:
Male vs Females
Median age
Most popular occupations of males: service occupations (36.2%); production occupations (18.5%); sales and office occupations (13.3%); architecture and engineering occupations (8.5%); material moving occupations (5.6%); business and financial operations occupations (5.3%); construction, extraction, and maintenance occupations (4.8%)
Most popular occupations of females: service occupations (59.7%); business and financial operations occupations (22.4%); management occupations (except farmers) (11.6%); community and social services occupations (5.0%); transportation occupations (3.3%); computer and mathematical occupations (2.1%); arts, design, entertainment, sports, and media occupations (2.0%)
Roads and streets: Cleveland Ter.
Other features: 2nd Riv.
Watsessing County Park neighborhood detailed profile
Area: 0.016 square miles
Population: 193
Population density:
| Watsessing County Park: | 12,068 people per square mile |
| East Orange: | 17,540 people per square mile |
Median household income in 2021:
| Watsessing County Park: | $132,800 |
| East Orange: | $51,368 |
Median rent in in 2021:
| Watsessing County Park: | $888 |
| East Orange: | $1,125 |
Male vs Females
| Males: | 115 |
| Females: | 78 |
Median age
| Males: | 22.0 years |
| Females: | 39.3 years |
Most popular occupations of males: service occupations (36.2%); production occupations (18.5%); sales and office occupations (13.3%); architecture and engineering occupations (8.5%); material moving occupations (5.6%); business and financial operations occupations (5.3%); construction, extraction, and maintenance occupations (4.8%)
Most popular occupations of females: service occupations (59.7%); business and financial operations occupations (22.4%); management occupations (except farmers) (11.6%); community and social services occupations (5.0%); transportation occupations (3.3%); computer and mathematical occupations (2.1%); arts, design, entertainment, sports, and media occupations (2.0%)
Roads and streets: Cleveland Ter.
Other features: 2nd Riv.
Watsessing County Park neighborhood detailed profile