Londonderry, New Hampshire Neighborhood Map - Income, House Prices, Occupations, Boundaries
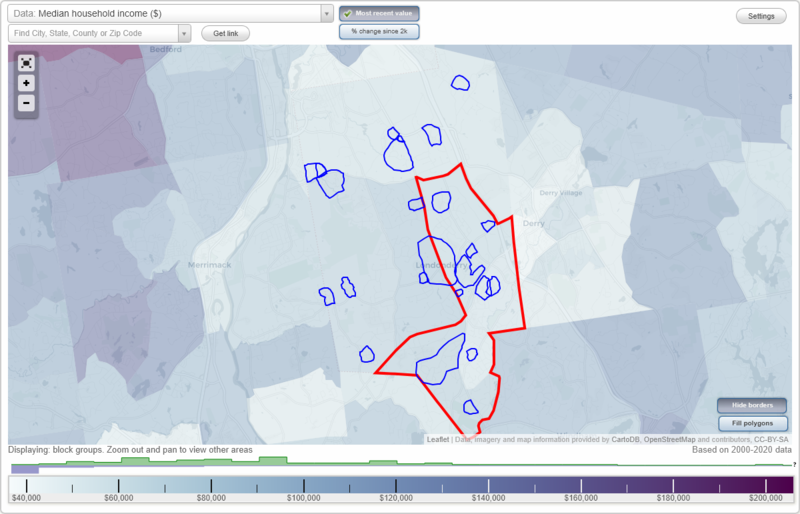
Data:
- City boundary
- Neighborhood boundaries
Business Search - 14 Million verified businesses
Neighborhoods:
Bockmans,
Brook Park Estates,
Century Village,
Chestnut Acres,
Cohas Landing,
Courtland Estates,
Gramercy Park,
Haywood Heights,
Midridge,
Mountain Home Estates,
Nottingham of Londonderry,
Oakridge Manor,
Orchard View Estates,
Parish Hills,
Pillsbury Ridge,
Ponderosa,
Sugarplum Hill,
Tanager Landing,
The Nevins,
The Pathways,
Town Centre,
Vista Ridge,
Watercrest Preserve,
Woodland Village
Bockmans neighborhood in Londonderry statistics: (
Find on map)
Area: 0.060
square milesHighways in this neighborhood: Mammoth Rd (State Rte 28, State Rte 128).
Roads and streets: Eglin Blvd E (Grenier Blvd); Hunter Mill Way (Hunter Blvd); W Eglin Blvd; Barksdale Ave; Alamagordo Blvd (Alamogordo Ave); E Elgin Blvd; Alomogordo Ave.
Bockmans neighborhood detailed profile
Brook Park Estates neighborhood in Londonderry statistics: (
Find on map)
Area: 0.358
square milesRoads and streets: W Yellowstone Dr; Litchfield Rd; E Yellowstone Dr; Iroquois Cir; Teton Dr; Seminole Pl; Cheyenne Ave; Wyandot Cir; Shenandoah Ave; Sequoia Ave; Mc Kinley Ave; Aspen Cir; Shawnee Pl.
Other features: Watts Brk.
Brook Park Estates neighborhood detailed profile
Gramercy Park neighborhood in Londonderry statistics: (
Find on map)
Area: 0.844
square milesHighways in this neighborhood: State Rte 128 (Mammoth Rd).
Roads and streets: White Plains Ave; Merlin Pl; Windsor Blvd; Cheshire Ct; Lexington Ave; Park Ave; Victoria Dr; Bretton Rd; Hyde Park Cir (Hyde Park); Sutton Pl; Raven Ter; Oriole Ln; Stony Point Dr; Chartwell Ct; Stoney Point Dr; Hyde Park Cir.
Gramercy Park neighborhood detailed profile
The Nevins neighborhood in Londonderry statistics: (
Find on map)
Area: 0.124
square milesRoads and streets: Morrison Dr; Nevins Dr; Plummer Dr; Eayers Range Rd; Davenport Dr; Pastor Dr; Wesley Dr; Proctor Dr; Mabel Dr.
The Nevins neighborhood detailed profile
Town Centre neighborhood in Londonderry statistics: (
Find on map)
Area: 0.966
square milesHighways in this neighborhood: Mammoth Rd (State Rte 128).
Roads and streets: Pillsbury Rd; King Richard Dr; Nelson Rd; Sargent Rd; Mc Enroe Dr; Saddleback Rd; Otterson Rd.
Town Centre neighborhood detailed profile
- All U.S. Cities
- New Hampshire, NH smaller cities, NH small cities
- Londonderry, NH
- US Neighborhood Maps
- Londonderry, New Hampshire Neighborhood Map

