Abell neighborhood in Baltimore, Maryland (MD), 21218 detailed profile
Settings
X

Business Search - 14 Million verified businesses
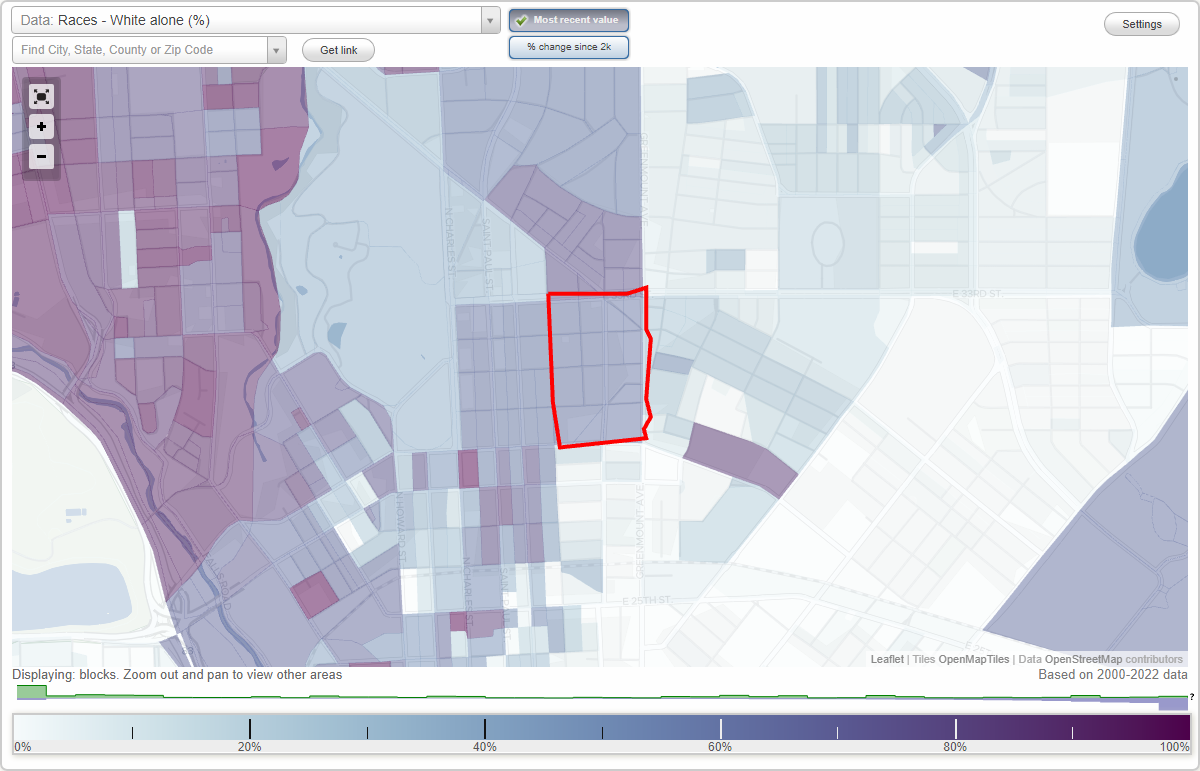
Area: 0.075 square miles
Population: 888
Population density:
| Abell: | 11,815 people per square mile |
| Baltimore: | 7,053 people per square mile |

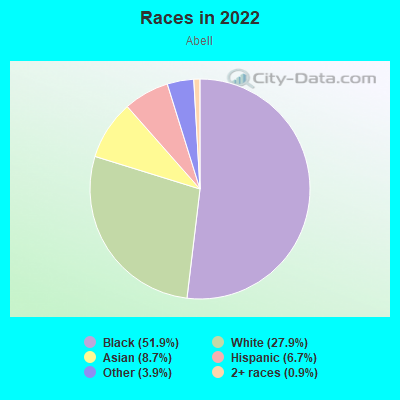
- 49751.9%Black
- 26727.9%White
- 838.7%Asian
- 646.7%Hispanic or Latino
- 373.9%Some other race
- 90.9%Two or more races
Median household income in 2022:
| Abell: | $67,956 |
| Baltimore: | $55,198 |
Distribution of median household income
![Distribution of median household income]()
- 33Less than $10,000
- 53$10,000 to $19,999
- 58$20,000 to $29,999
- 55$30,000 to $39,999
- 64$40,000 to $49,999
- 20$50,000 to $59,999
- 30$60,000 to $74,999
- 48$75,000 to $99,999
- 131$100,000 to $124,999
- 30$125,000 to $149,999
- 147$150,000 to $199,999
- 24$200,000 or more

Distribution of owner-occupied house/condo value
![Distribution of owner-occupied house/condo value]()
- 67Less than $50,000
- 88$50,000 to $99,999
- 56$100,000 to $149,999
- 138$150,000 to $199,999
- 36$200,000 to $249,999
- 44$250,000 to $299,999
- 24$300,000 to $399,999
- 22$400,000 to $499,999
- 6$500,000 to $749,999
- 2$750,000 to $999,999

Distribution of rent paid by renters
![Distribution of rent paid by renters]()
- 4Less than $100
- 25$100 to $199
- 34$200 to $299
- 10$300 to $399
- 18$400 to $499
- 22$500 to $599
- 46$600 to $699
- 53$700 to $799
- 45$800 to $899
- 32$900 to $999
- 36$1,000 to $1,249
- 37$1,250 to $1,499
- 77$1,500 to $1,999
- 32$2,000 or more

Median rent in 2022:
| Abell: | $977 |
| Baltimore: | $1,043 |
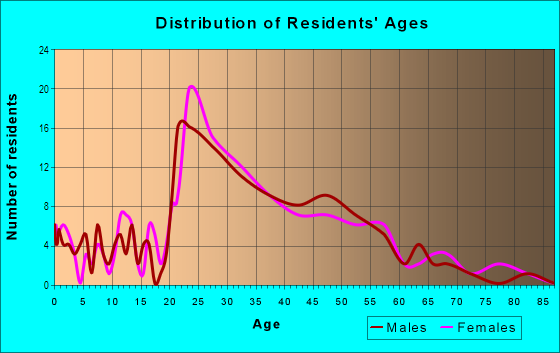
| Males: | 504 |
| Females: | 384 |
Males:
| This neighborhood: | 34.8 years |
| Whole city: | 35.0 years |
| This neighborhood: | 40.6 years |
| Whole city: | 38.2 years |
Average household size:
| Abell: | 2.1 people |
| Baltimore: | 2.2 people |
Percentage of family households:
| Abell: | 20.7% |
| Baltimore: | 34.2% |
| Here: | 19.8% |
| Baltimore: | 23.3% |
Percentage of married-couple families with children (among all households):
| Abell: | 11.7% |
| Baltimore: | 22.4% |
Percentage of single-mother households (among all households):
| Abell: | 468.1% |
| Baltimore: | 18.7% |
Percentage of never married males 15 years old and over:
Percentage of never married females 15 years old and over:
| Abell: | 33.9% |
| Baltimore: | 25.1% |
Percentage of never married females 15 years old and over:
| Abell: | 17.4% |
| city: | 27.5% |
Percentage of people that speak English not well or not at all:
| Abell: | 0.0% |
| Baltimore: | 2.3% |
Percentage of people born in this state:
Percentage of people born in another U.S. state:
Percentage of native residents but born outside the U.S.:
Percentage of foreign born residents:
| Here: | 67.0% |
| Baltimore: | 64.4% |
Percentage of people born in another U.S. state:
| Abell: | 25.7% |
| Baltimore: | 25.0% |
Percentage of native residents but born outside the U.S.:
| Here: | 2.0% |
| city: | 0.9% |
Percentage of foreign born residents:
| Here: | 5.3% |
| Baltimore: | 9.7% |
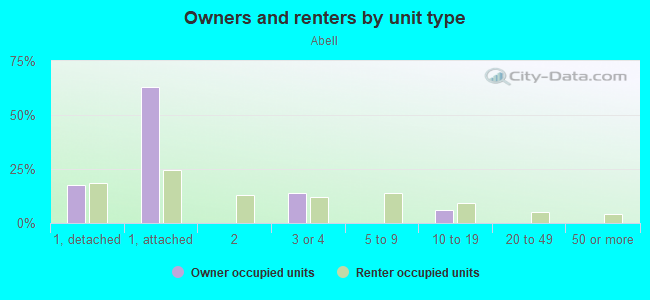
Owner-occupied
Renter-occupied

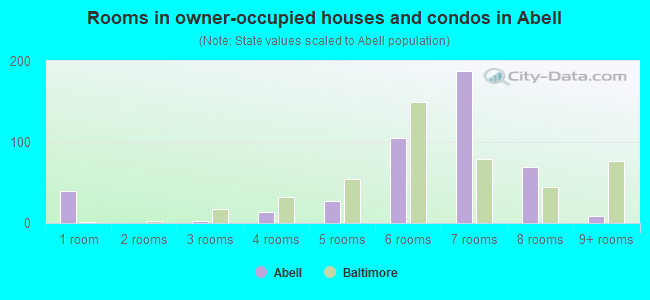
- Rooms in owner-occupied houses and condos in Abell
- 401 room
- 02 rooms
- 33 rooms
- 134 rooms
- 275 rooms
- 1056 rooms
- 1887 rooms
- 698 rooms
- 99+ rooms
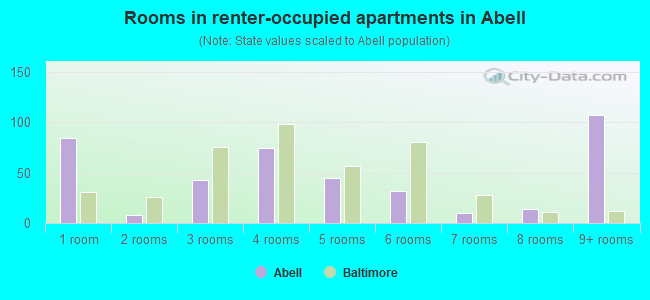
- Rooms in renter-occupied apartments in Abell
- 841 room
- 82 rooms
- 433 rooms
- 744 rooms
- 455 rooms
- 326 rooms
- 107 rooms
- 148 rooms
- 1079+ rooms
Owner-occupied
Renter-occupied
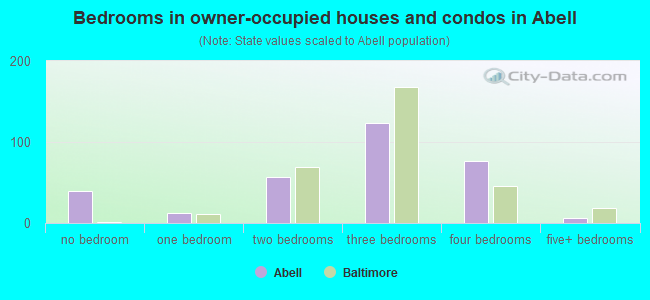
- Bedrooms in owner-occupied houses and condos in Abell
- 40no bedroom
- 121 bedroom
- 572 bedrooms
- 1233 bedrooms
- 764 bedrooms
- 65+ bedrooms
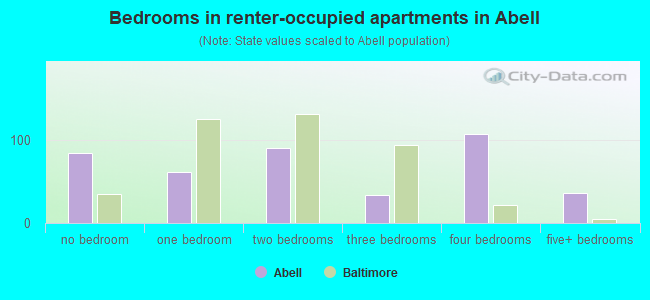
- Bedrooms in renter-occupied apartments in Abell
- 84no bedroom
- 611 bedroom
- 902 bedrooms
- 343 bedrooms
- 1074 bedrooms
- 365+ bedrooms
Average number of cars or other vehicles available in houses/condos:
Average number of cars or other vehicles available in apartments:
| This neighborhood: | 1.3 |
| Baltimore: | 1.5 |
Average number of cars or other vehicles available in apartments:
| Here: | 0.8 |
| city: | 0.8 |
Percentage of units with a mortgage:
| Abell: | 77.1% |
| Baltimore: | 64.3% |
Housing prices:
- Average estimated value of detached houses in 2022 (12.6% of all units):
Abell: $141,112 Baltimore: $350,815
- Average estimated value of townhouses or other attached units in 2022 (56.5% of all units):
This neighborhood: $166,640 city: $206,258
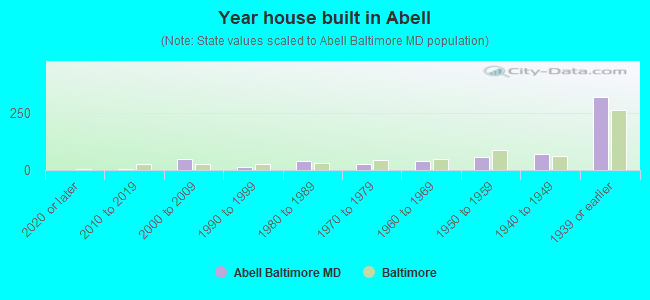
- Year house built in Abell
- 02020 or later
- 42010 to 2019
- 502000 to 2009
- 151990 to 1999
- 391980 to 1989
- 251970 to 1979
- 411960 to 1969
- 581950 to 1959
- 681940 to 1949
- 3161939 or earlier
Travel time to work (commute)
![Travel time to work (commute)]()
- 7Less than 5 minutes
- 255 to 9 minutes
- 2510 to 14 minutes
- 5515 to 19 minutes
- 3620 to 24 minutes
- 725 to 29 minutes
- 5430 to 34 minutes
- 1335 to 39 minutes
- 1140 to 44 minutes
- 13645 to 59 minutes
- 1660 to 89 minutes
- 1690 or more minutes

Means of transportation to work
![Means of transportation to work]()
- 59.6%277Drove a car alone
- 15.7%73Carpooled
- 21.3%99Bus
- 6.5%30Subway or elevated rail
- 3.7%17Long-distance train or commuter rail
- 0.2%1Light rail, streetcar or trolley
- 1.5%7Taxi
- 3.7%17Bicycle
- 2.6%12Walked
- 2.2%10Other means
- 7.3%34Worked at home

Time leaving home to go to work
![Time leaving home to go to work]()
- 312:00 a.m. to 4:59 a.m.
- 135:00 a.m. to 5:29 a.m.
- 85:30 a.m. to 5:59 a.m.
- 196:00 a.m. to 6:29 a.m.
- 206:30 a.m. to 6:59 a.m.
- 167:00 a.m. to 7:29 a.m.
- 247:30 a.m. to 7:59 a.m.
- 448:00 a.m. to 8:29 a.m.
- 178:30 a.m. to 8:59 a.m.
- 319:00 a.m. to 9:59 a.m.
- 1510:00 a.m. to 10:59 a.m.
- 1411:00 a.m. to 11:59 a.m.
- 3212:00 p.m. to 3:59 p.m.
- 214:00 p.m. to 11:59 p.m.

Occupations of males:
- Percentage of males in management occupations (except farmers):
Here: 11.4% city: 10.7%
- Percentage of males in business and financial operations occupations:
Here: 4.3% city: 5.9%
- Percentage of males in computer and mathematical occupations:
Here: 8.7% city: 6.1%
- Percentage of males in life, physical, and social science occupations:
Here: 5.0% city: 2.3%
- Percentage of males in community and social services occupations:
Here: 1.5% city: 1.6%
- Percentage of males in education, training, and library occupations:
Here: 10.1% city: 5.4%
- Percentage of males in healthcare practitioners and technical occupations:
Here: 1.8% city: 4.0%
- Percentage of males in service occupations:
Here: 15.0% city: 14.7%
- Percentage of males in sales and office occupations:
Here: 21.5% city: 14.2%
- Percentage of males in construction, extraction, and maintenance occupations:
Here: 2.1% city: 5.6%
- Percentage of males in production occupations:
Here: 4.1% city: 4.2%
- Percentage of males in transportation occupations:
Here: 7.8% city: 6.8%
- Percentage of males in material moving occupations:
Here: 9.1% city: 7.0%
Occupations of females:
- Percentage of females in management occupations (except farmers):
Here: 6.2% city: 10.1%
- Percentage of females in business and financial operations occupations:
Here: 12.2% city: 6.6%
- Percentage of females in computer and mathematical occupations:
Here: 3.1% city: 2.4%
- Percentage of females in architecture and engineering occupations:
Here: 1.2% city: 0.9%
- Percentage of females in life, physical, and social science occupations:
Here: 6.6% city: 2.5%
- Percentage of females in community and social services occupations:
Here: 2.5% city: 3.6%
- Percentage of females in legal occupations:
Here: 1.2% city: 1.8%
- Percentage of females in education, training, and library occupations:
Here: 6.7% city: 10.7%
- Percentage of females in arts, design, entertainment, sports, and media occupations:
Here: 3.1% city: 2.4%
- Percentage of females in healthcare practitioners and technical occupations:
Here: 6.0% city: 9.8%
- Percentage of females in service occupations:
Here: 20.6% city: 20.4%
- Percentage of females in sales and office occupations:
Here: 23.7% city: 22.3%
- Percentage of females in production occupations:
Here: 2.9% city: 2.3%
- Percentage of females in material moving occupations:
Here: 7.0% city: 1.9%
Percentage of people 16-64 in Armed Forces:
| Abell: | 0.0% |
| Baltimore: | 0.4% |
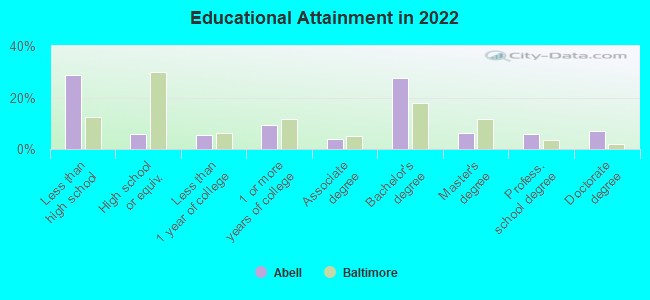
Education in this neighborhood (subdivision or community):
- Percentage of people 3 years and older in K-12 schools:
Abell: 73.0% Baltimore: 14.7%
- Percentage of people 3 years and older in undergraduate colleges:
Abell: 21.9% Baltimore: 6.0%
- Percentage of people 3 years and older in grad. or professional schools:
Abell: 5.8% Baltimore: 2.8%
- Percentage of students K-12 enrolled in private schools:
Abell: 2.2% Baltimore: 12.7%
Percentage of population below poverty level:
| Abell: | 25.1% |
| Baltimore: | 18.5% |
Median year owner moved in (as recorded in 2022):
Median year renter moved in (as recorded in 2022):
| Abell: | 2008 |
| Baltimore: | 2009 |
Median year renter moved in (as recorded in 2022):
| Abell: | 2018 |
| Baltimore: | 2019 |
Percentage of married-couple families with both working:
| Abell: | 123.6% |
| Baltimore: | 79.2% |
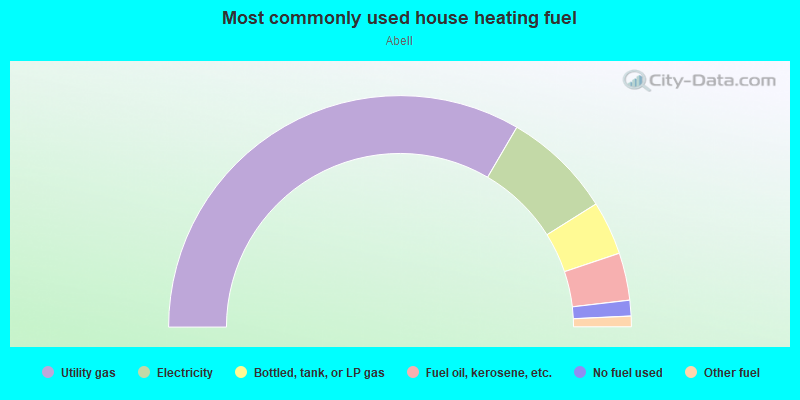
- 66.8%Utility gas
- 15.3%Electricity
- 7.5%Bottled, tank, or LP gas
- 6.6%Fuel oil, kerosene, etc.
- 2.2%No fuel used
- 1.5%Other fuel
Highways in this neighborhood:
State Hwy 45 (Greenmount Ave)
Length: 0.33 miles
Direction: N-S
Address range: 2942 to 3322
Direction: N-S
Address range: 2942 to 3322
Roads and streets:
Barclay St
Length: 0.33 miles
Direction: N-S
Address range: 2900 to 3299
Direction: N-S
Address range: 2900 to 3299
Vineyard Ln
Length: 0.26 miles
Directions: E-W, SW-NE
Address range: 3000 to 3099
Directions: E-W, SW-NE
Address range: 3000 to 3099
Abell Ave
Length: 0.24 miles
Direction: N-S
Address range: 3000 to 3299
Direction: N-S
Address range: 3000 to 3299
E 33rd St
Length: 0.19 miles
Direction: E-W
Direction: E-W
E 32nd St
Length: 0.18 miles
Direction: E-W
Address range: 320 to 499
Direction: E-W
Address range: 320 to 499
E 30th St
Length: 0.18 miles
Direction: E-W
Address range: 301 to 499
Direction: E-W
Address range: 301 to 499
E 31st St
Length: 0.17 miles
Direction: E-W
Address range: 320 to 499
Direction: E-W
Address range: 320 to 499
Brentwood Ave
Length: 0.15 miles
Direction: N-S
Address range: 3100 to 3299
Direction: N-S
Address range: 3100 to 3299
Merryman Ln
Length: 0.13 miles
Direction: SE-NW
Address range: 400 to 499
Direction: SE-NW
Address range: 400 to 499
E 29th St
Length: 0.09 miles
Direction: E-W
Address range: 313 to 399
Direction: E-W
Address range: 313 to 399