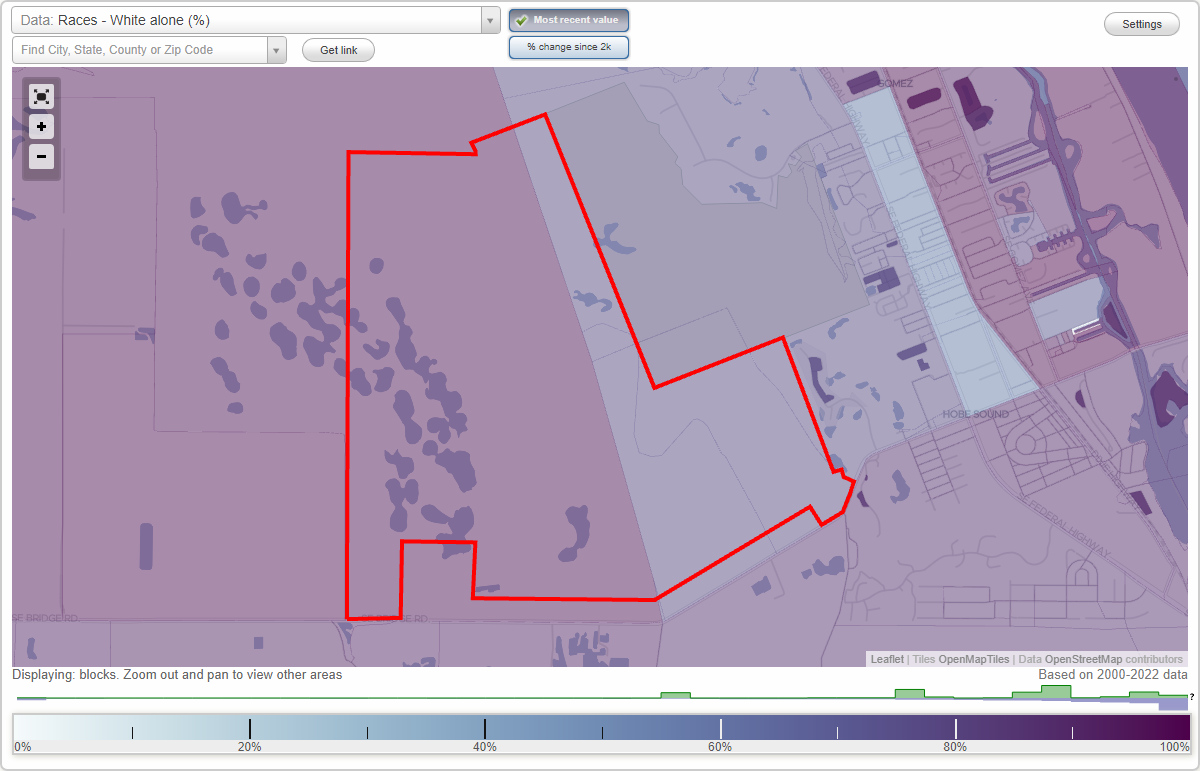
Atlantic Preserve neighborhood in Hobe Sound, Florida (FL), 33455 detailed profile
Settings
X

Business Search - 14 Million verified businesses
Area: 4.366 square miles
Population: 1,810
Population density:
| Atlantic Preserve: | 415 people per square mile |
| Hobe Sound: | 2,598 people per square mile |

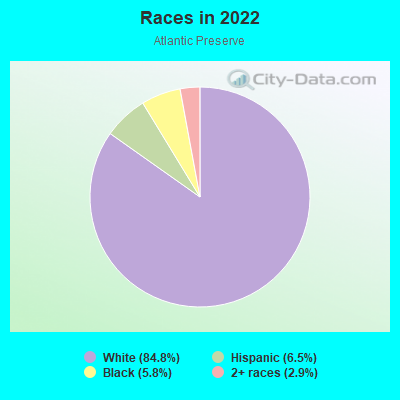
- 1,53484.8%White
- 1186.5%Hispanic or Latino
- 1045.8%Black
- 522.9%Two or more races
Median household income in 2022:
| Atlantic Preserve: | $77,995 |
| Hobe Sound: | $62,677 |
Distribution of median household income
![Distribution of median household income]()
- 69Less than $10,000
- 21$10,000 to $19,999
- 59$20,000 to $29,999
- 61$30,000 to $39,999
- 30$40,000 to $49,999
- 93$50,000 to $59,999
- 52$60,000 to $74,999
- 135$75,000 to $99,999
- 69$100,000 to $124,999
- 65$125,000 to $149,999
- 79$150,000 to $199,999
- 61$200,000 or more

Distribution of owner-occupied house/condo value
![Distribution of owner-occupied house/condo value]()
- 9Less than $50,000
- 40$50,000 to $99,999
- 31$100,000 to $149,999
- 46$150,000 to $199,999
- 91$200,000 to $249,999
- 26$250,000 to $299,999
- 161$300,000 to $399,999
- 141$400,000 to $499,999
- 67$500,000 to $749,999
- 29$750,000 to $999,999
- 41$1,000,000 or more

Distribution of rent paid by renters
![Distribution of rent paid by renters]()
- 10$600 to $699
- 13$700 to $799
- 8$800 to $899
- 11$1,000 to $1,249
- 12$1,500 to $1,999
- 50$2,000 or more

Median rent in 2022:
| Atlantic Preserve: | $1,939 |
| Hobe Sound: | $1,077 |
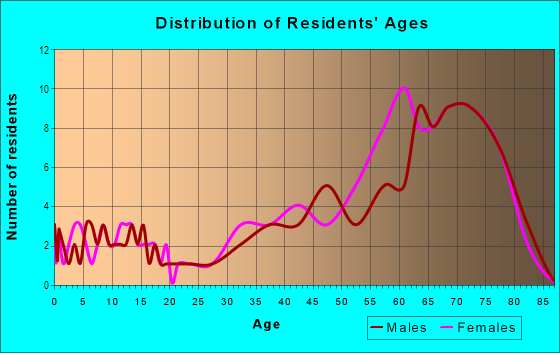
| Males: | 923 |
| Females: | 886 |
Males:
| This neighborhood: | 49.7 years |
| Whole city: | 53.3 years |
| This neighborhood: | 56.1 years |
| Whole city: | 57.5 years |
Average household size:
| Atlantic Preserve: | 2.3 people |
| Hobe Sound: | 2.2 people |
Percentage of family households:
| Atlantic Preserve: | 35.5% |
| Hobe Sound: | 30.7% |
| Here: | 45.4% |
| Hobe Sound: | 44.9% |
Percentage of married-couple families with children (among all households):
| Atlantic Preserve: | 27.8% |
| Hobe Sound: | 34.4% |
Percentage of single-mother households (among all households):
| Atlantic Preserve: | 6.8% |
| Hobe Sound: | 4.3% |
Percentage of never married males 15 years old and over:
Percentage of never married females 15 years old and over:
| Atlantic Preserve: | 17.8% |
| Hobe Sound: | 15.0% |
Percentage of never married females 15 years old and over:
| Atlantic Preserve: | 10.8% |
| place: | 9.6% |
Percentage of people that speak English not well or not at all:
| Atlantic Preserve: | 0.7% |
| Hobe Sound: | 2.7% |
Percentage of people born in this state:
Percentage of people born in another U.S. state:
Percentage of native residents but born outside the U.S.:
Percentage of foreign born residents:
| Here: | 42.8% |
| Hobe Sound: | 31.7% |
Percentage of people born in another U.S. state:
| Atlantic Preserve: | 51.5% |
| Hobe Sound: | 59.0% |
Percentage of native residents but born outside the U.S.:
| Here: | 0.2% |
| place: | 1.1% |
Percentage of foreign born residents:
| Here: | 5.6% |
| Hobe Sound: | 8.1% |
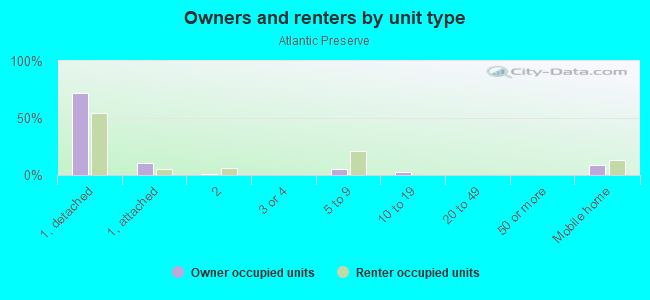
Owner-occupied
Renter-occupied

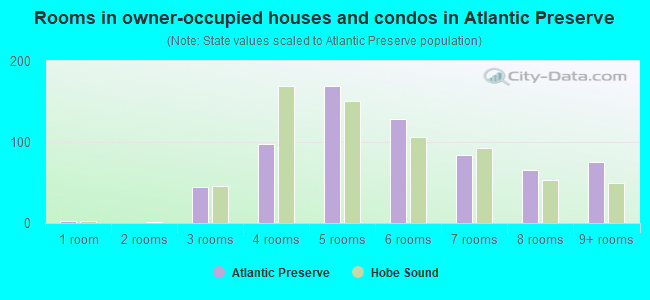
- Rooms in owner-occupied houses and condos in Atlantic Preserve
- 31 room
- 02 rooms
- 453 rooms
- 984 rooms
- 1695 rooms
- 1286 rooms
- 847 rooms
- 668 rooms
- 759+ rooms
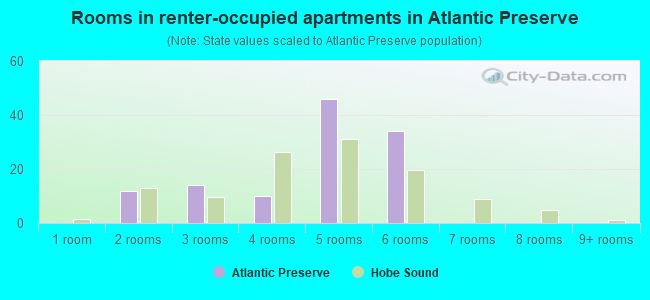
- Rooms in renter-occupied apartments in Atlantic Preserve
- 01 room
- 122 rooms
- 143 rooms
- 104 rooms
- 465 rooms
- 346 rooms
- 07 rooms
- 08 rooms
- 09+ rooms
Owner-occupied
Renter-occupied
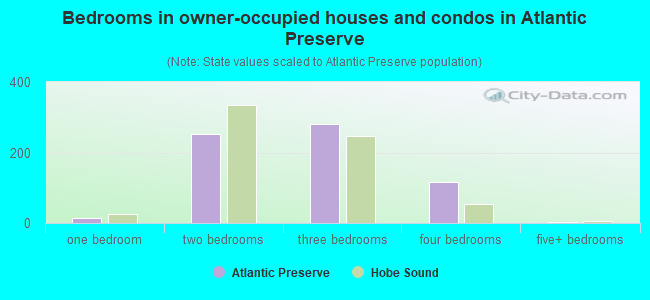
- Bedrooms in owner-occupied houses and condos in Atlantic Preserve
- 3no bedroom
- 131 bedroom
- 2532 bedrooms
- 2813 bedrooms
- 1154 bedrooms
- 35+ bedrooms
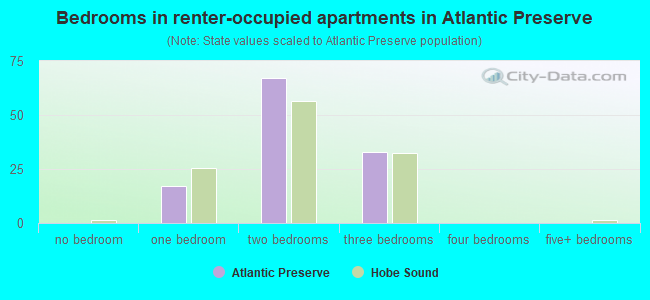
- Bedrooms in renter-occupied apartments in Atlantic Preserve
- 0no bedroom
- 171 bedroom
- 672 bedrooms
- 333 bedrooms
- 04 bedrooms
- 05+ bedrooms
Average number of cars or other vehicles available in houses/condos:
Average number of cars or other vehicles available in apartments:
| This neighborhood: | 1.7 |
| Hobe Sound: | 1.7 |
Average number of cars or other vehicles available in apartments:
| Here: | 1.6 |
| place: | 1.5 |
Percentage of units with a mortgage:
| Atlantic Preserve: | 57.5% |
| Hobe Sound: | 42.0% |
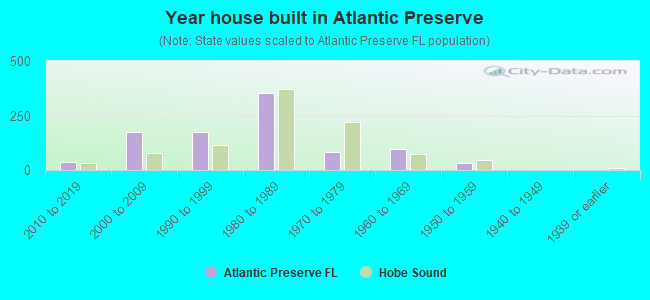
- Year house built in Atlantic Preserve
- 02020 or later
- 352010 to 2019
- 1742000 to 2009
- 1731990 to 1999
- 3531980 to 1989
- 831970 to 1979
- 981960 to 1969
- 311950 to 1959
- 01940 to 1949
- 01939 or earlier
Travel time to work (commute)
![Travel time to work (commute)]()
- 29Less than 5 minutes
- 1155 to 9 minutes
- 4710 to 14 minutes
- 16915 to 19 minutes
- 3120 to 24 minutes
- 2625 to 29 minutes
- 8730 to 34 minutes
- 435 to 39 minutes
- 1140 to 44 minutes
- 2145 to 59 minutes
- 2890 or more minutes

Means of transportation to work
![Means of transportation to work]()
- 56.0%407Drove a car alone
- 20.6%150Carpooled
- 2.1%15Other means
- 20.9%152Worked at home

Time leaving home to go to work
![Time leaving home to go to work]()
- 95:00 a.m. to 5:29 a.m.
- 496:00 a.m. to 6:29 a.m.
- 476:30 a.m. to 6:59 a.m.
- 557:00 a.m. to 7:29 a.m.
- 857:30 a.m. to 7:59 a.m.
- 1508:00 a.m. to 8:29 a.m.
- 418:30 a.m. to 8:59 a.m.
- 839:00 a.m. to 9:59 a.m.
- 4010:00 a.m. to 10:59 a.m.
- 94:00 p.m. to 11:59 p.m.

Occupations of males:
- Percentage of males in management occupations (except farmers):
Here: 12.5% place: 10.9%
- Percentage of males in business and financial operations occupations:
Here: 12.9% place: 5.9%
- Percentage of males in computer and mathematical occupations:
Here: 1.1% place: 1.6%
- Percentage of males in architecture and engineering occupations:
Here: 4.5% place: 2.8%
- Percentage of males in education, training, and library occupations:
Here: 1.4% place: 2.9%
- Percentage of males in arts, design, entertainment, sports, and media occupations:
Here: 1.4% place: 1.7%
- Percentage of males in healthcare practitioners and technical occupations:
Here: 3.0% place: 2.3%
- Percentage of males in service occupations:
Here: 8.1% place: 17.9%
- Percentage of males in sales and office occupations:
Here: 23.1% place: 19.3%
- Percentage of males in farming, fishing, and forestry occupations:
Here: 1.8% place: 0.7%
- Percentage of males in construction, extraction, and maintenance occupations:
Here: 15.3% place: 16.6%
- Percentage of males in production occupations:
Here: 1.8% place: 3.6%
- Percentage of males in material moving occupations:
Here: 1.2% place: 1.7%
Occupations of females:
- Percentage of females in management occupations (except farmers):
Here: 7.9% place: 10.8%
- Percentage of females in business and financial operations occupations:
Here: 3.3% place: 5.0%
- Percentage of females in computer and mathematical occupations:
Here: 1.2% place: 1.0%
- Percentage of females in architecture and engineering occupations:
Here: 4.3% place: 3.2%
- Percentage of females in life, physical, and social science occupations:
Here: 2.2% place: 0.7%
- Percentage of females in education, training, and library occupations:
Here: 1.4% place: 6.4%
- Percentage of females in arts, design, entertainment, sports, and media occupations:
Here: 8.1% place: 3.4%
- Percentage of females in service occupations:
Here: 30.5% place: 31.3%
- Percentage of females in sales and office occupations:
Here: 34.7% place: 27.9%
- Percentage of females in construction, extraction, and maintenance occupations:
Here: 1.8% place: 0.6%
- Percentage of females in production occupations:
Here: 3.4% place: 1.6%
- Percentage of females in transportation occupations:
Here: 1.2% place: 0.5%
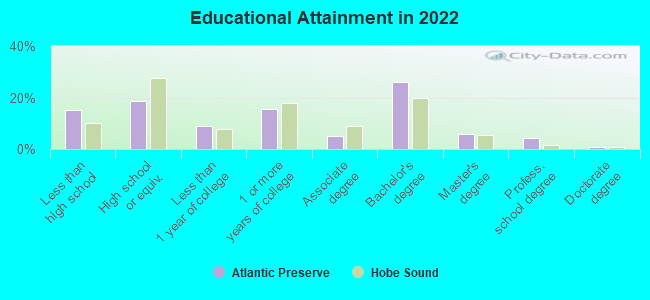
Education in this neighborhood (subdivision or community):
- Percentage of people 3 years and older in K-12 schools:
Atlantic Preserve: 10.1% Hobe Sound: 8.3%
- Percentage of people 3 years and older in undergraduate colleges:
Atlantic Preserve: 0.3% Hobe Sound: 2.1%
- Percentage of people 3 years and older in grad. or professional schools:
Atlantic Preserve: 0.2% Hobe Sound: 0.6%
- Percentage of students K-12 enrolled in private schools:
Atlantic Preserve: 10.2% Hobe Sound: 20.3%
Percentage of population below poverty level:
| Atlantic Preserve: | 18.6% |
| Hobe Sound: | 11.1% |
Median year owner moved in (as recorded in 2022):
Median year renter moved in (as recorded in 2022):
| Atlantic Preserve: | 2010 |
| Hobe Sound: | 2010 |
Median year renter moved in (as recorded in 2022):
| Atlantic Preserve: | 2018 |
| Hobe Sound: | 2016 |
Percentage of married-couple families with both working:
| Atlantic Preserve: | 68.8% |
| Hobe Sound: | 81.2% |
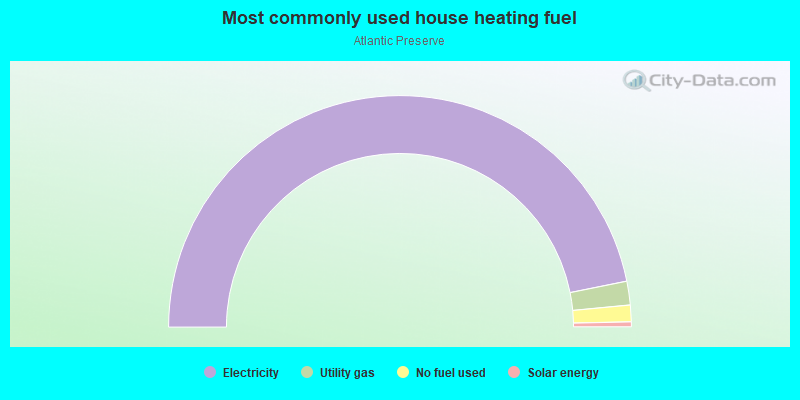
- 93.3%Electricity
- 3.3%Utility gas
- 2.3%No fuel used
- 0.7%Solar energy