Bradlee (Farlington) neighborhood in Alexandria, Virginia (VA), 22302 detailed profile
Settings
X

Business Search - 14 Million verified businesses
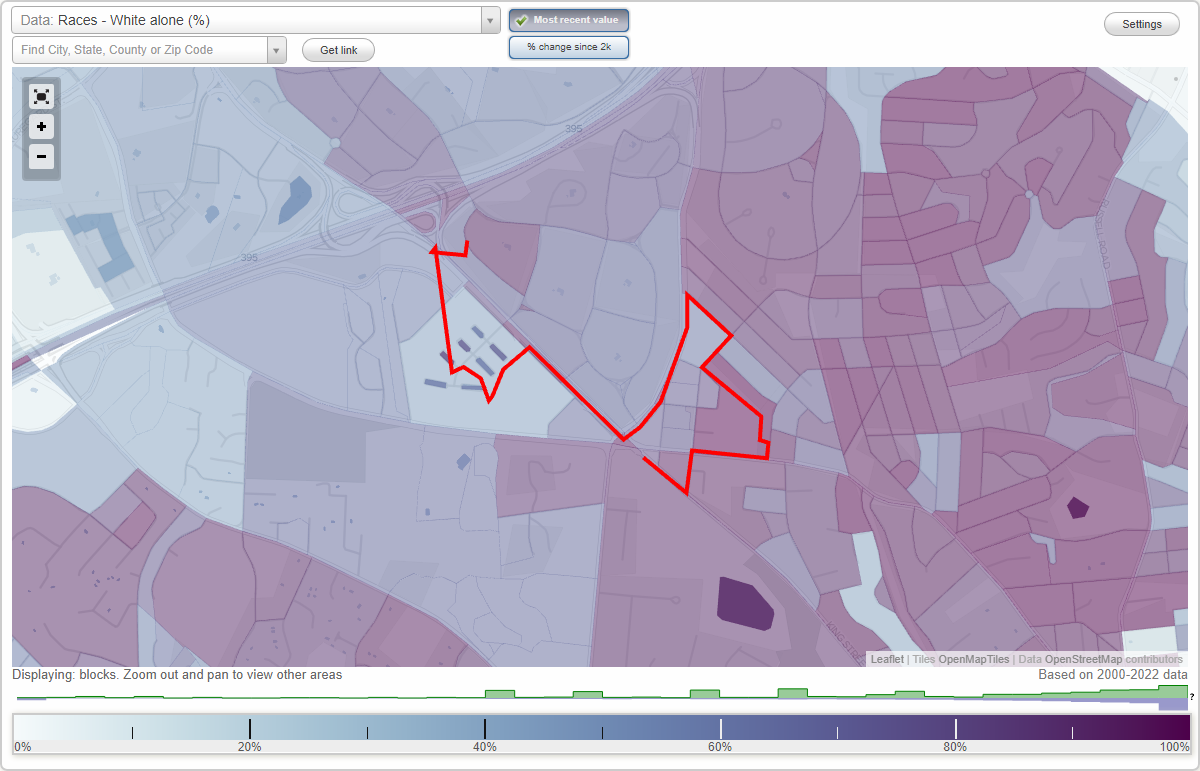
Area: 0.098 square miles
Population: 626
Population density:
| Bradlee (Farlington): | 6,371 people per square mile |
| Alexandria: | 10,247 people per square mile |

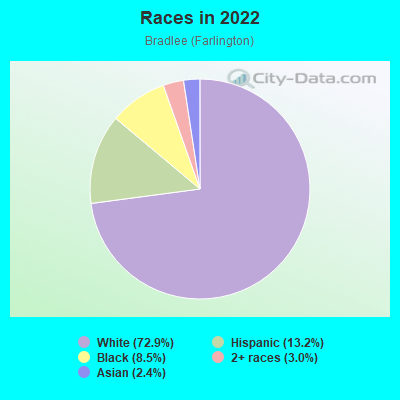
- 45772.9%White
- 8313.2%Hispanic or Latino
- 538.5%Black
- 193.0%Two or more races
- 152.4%Asian
Median household income in 2022:
| Bradlee (Farlington): | $189,329 |
| Alexandria: | $111,955 |
Distribution of median household income
![Distribution of median household income]()
- 30Less than $10,000
- 5$10,000 to $19,999
- 4$20,000 to $29,999
- 9$30,000 to $39,999
- 17$40,000 to $49,999
- 8$50,000 to $59,999
- 6$60,000 to $74,999
- 10$75,000 to $99,999
- 41$100,000 to $124,999
- 16$125,000 to $149,999
- 42$150,000 to $199,999
- 111$200,000 or more

Distribution of owner-occupied house/condo value
![Distribution of owner-occupied house/condo value]()
- 4Less than $50,000
- 1$50,000 to $99,999
- 9$150,000 to $199,999
- 8$200,000 to $249,999
- 5$250,000 to $299,999
- 6$300,000 to $399,999
- 62$400,000 to $499,999
- 33$500,000 to $749,999
- 56$750,000 to $999,999
- 36$1,000,000 or more

Distribution of rent paid by renters
![Distribution of rent paid by renters]()
- 5$200 to $299
- 2$300 to $399
- 3$500 to $599
- 6$600 to $699
- 18$700 to $799
- 8$800 to $899
- 4$900 to $999
- 14$1,000 to $1,249
- 1$1,250 to $1,499
- 29$1,500 to $1,999
- 57$2,000 or more

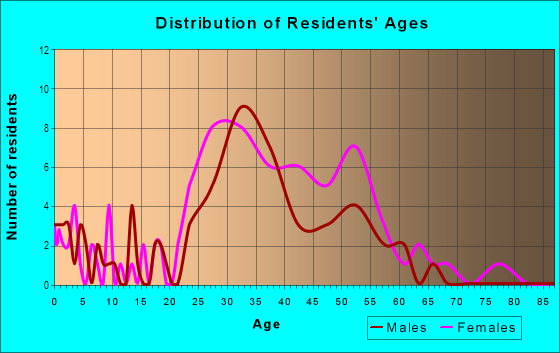
| Males: | 312 |
| Females: | 313 |
Males:
| This neighborhood: | 38.3 years |
| Whole city: | 36.8 years |
| This neighborhood: | 42.6 years |
| Whole city: | 38.7 years |
Average household size:
| Bradlee (Farlington): | 2.5 people |
| Alexandria: | 21.0 people |
Percentage of family households:
| Bradlee (Farlington): | 39.3% |
| Alexandria: | 35.2% |
| Here: | 45.0% |
| Alexandria: | 34.2% |
Percentage of married-couple families with children (among all households):
| Bradlee (Farlington): | 37.4% |
| Alexandria: | 36.1% |
Percentage of single-mother households (among all households):
| Bradlee (Farlington): | 4.8% |
| Alexandria: | 10.5% |
Percentage of never married males 15 years old and over:
Percentage of never married females 15 years old and over:
| Bradlee (Farlington): | 14.0% |
| Alexandria: | 18.9% |
Percentage of never married females 15 years old and over:
| Bradlee (Farlington): | 23.3% |
| city: | 21.0% |
Percentage of people that speak English not well or not at all:
| Bradlee (Farlington): | 0.5% |
| Alexandria: | 4.7% |
Percentage of people born in this state:
Percentage of people born in another U.S. state:
Percentage of native residents but born outside the U.S.:
Percentage of foreign born residents:
| Here: | 29.3% |
| Alexandria: | 24.1% |
Percentage of people born in another U.S. state:
| Bradlee (Farlington): | 57.1% |
| Alexandria: | 50.3% |
Percentage of native residents but born outside the U.S.:
| Here: | 2.6% |
| city: | 1.8% |
Percentage of foreign born residents:
| Here: | 10.9% |
| Alexandria: | 23.7% |
Owner-occupied
Renter-occupied

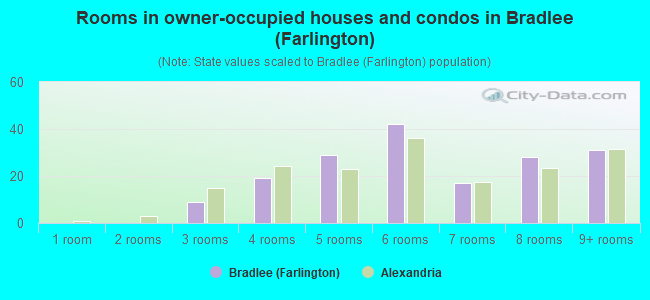
- Rooms in owner-occupied houses and condos in Bradlee <
> - 01 room
- 02 rooms
- 93 rooms
- 194 rooms
- 295 rooms
- 426 rooms
- 177 rooms
- 288 rooms
- 319+ rooms
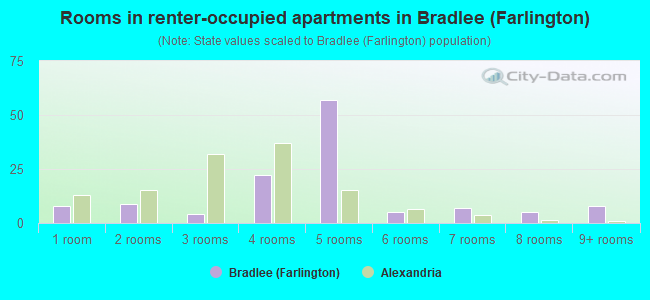
- Rooms in renter-occupied apartments in Bradlee <
> - 81 room
- 92 rooms
- 43 rooms
- 224 rooms
- 575 rooms
- 56 rooms
- 77 rooms
- 58 rooms
- 89+ rooms
Owner-occupied
Renter-occupied
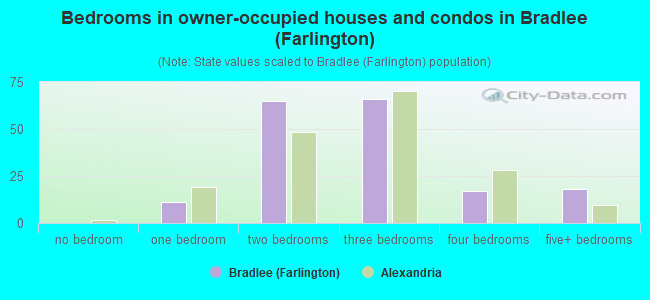
- Bedrooms in owner-occupied houses and condos in Bradlee <
> - 0no bedroom
- 111 bedroom
- 652 bedrooms
- 663 bedrooms
- 174 bedrooms
- 185+ bedrooms
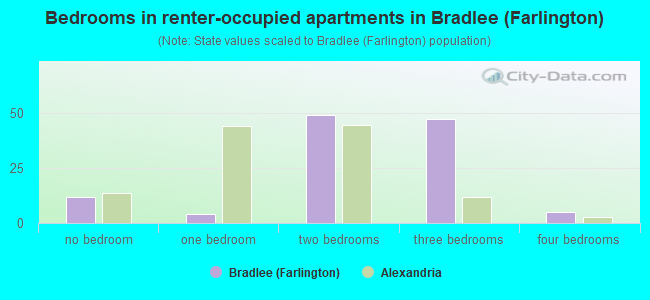
- Bedrooms in renter-occupied apartments in Bradlee <
> - 12no bedroom
- 41 bedroom
- 492 bedrooms
- 473 bedrooms
- 54 bedrooms
- 05+ bedrooms
Average number of cars or other vehicles available in houses/condos:
Average number of cars or other vehicles available in apartments:
| This neighborhood: | 1.8 |
| Alexandria: | 1.5 |
Average number of cars or other vehicles available in apartments:
| Here: | |
| city: |
Percentage of units with a mortgage:
| Bradlee (Farlington): | 77.3% |
| Alexandria: | 77.0% |
Average estimated value of detached houses in 2022 (36.0% of all units):
| Bradlee (Farlington): | $1,118,384 |
| Virginia: | $472,865 |
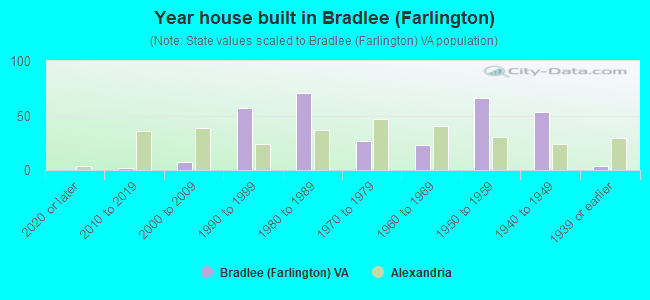
- Year house built in Bradlee <
> - 02020 or later
- 22010 to 2019
- 72000 to 2009
- 571990 to 1999
- 711980 to 1989
- 271970 to 1979
- 231960 to 1969
- 661950 to 1959
- 531940 to 1949
- 41939 or earlier
City-data.com crime index for city in 2020 (higher means more crime):
| City: | 129.5 |
| U.S. average: | 219.5 |
Travel time to work (commute)
![Travel time to work (commute)]()
- 8Less than 5 minutes
- 185 to 9 minutes
- 2610 to 14 minutes
- 3815 to 19 minutes
- 3020 to 24 minutes
- 1925 to 29 minutes
- 3730 to 34 minutes
- 1235 to 39 minutes
- 940 to 44 minutes
- 4345 to 59 minutes
- 1860 to 89 minutes
- 690 or more minutes

Means of transportation to work
![Means of transportation to work]()
- 59.9%199Drove a car alone
- 6.6%22Carpooled
- 3.0%10Bus
- 5.1%17Subway or elevated rail
- 0.9%3Light rail, streetcar or trolley
- 1.8%6Taxi
- 1.8%6Bicycle
- 4.2%14Walked
- 1.8%6Other means
- 23.2%77Worked at home

Time leaving home to go to work
![Time leaving home to go to work]()
- 1312:00 a.m. to 4:59 a.m.
- 15:00 a.m. to 5:29 a.m.
- 25:30 a.m. to 5:59 a.m.
- 126:00 a.m. to 6:29 a.m.
- 126:30 a.m. to 6:59 a.m.
- 297:00 a.m. to 7:29 a.m.
- 457:30 a.m. to 7:59 a.m.
- 468:00 a.m. to 8:29 a.m.
- 238:30 a.m. to 8:59 a.m.
- 329:00 a.m. to 9:59 a.m.
- 1510:00 a.m. to 10:59 a.m.
- 511:00 a.m. to 11:59 a.m.
- 1412:00 p.m. to 3:59 p.m.
- 74:00 p.m. to 11:59 p.m.

Occupations of males:
- Percentage of males in management occupations (except farmers):
Here: 16.4% city: 16.3%
- Percentage of males in business and financial operations occupations:
Here: 28.5% city: 10.7%
- Percentage of males in computer and mathematical occupations:
Here: 12.0% city: 9.6%
- Percentage of males in community and social services occupations:
Here: 1.2% city: 1.5%
- Percentage of males in legal occupations:
Here: 4.2% city: 6.0%
- Percentage of males in education, training, and library occupations:
Here: 5.0% city: 3.9%
- Percentage of males in arts, design, entertainment, sports, and media occupations:
Here: 12.5% city: 3.8%
- Percentage of males in service occupations:
Here: 3.2% city: 11.2%
- Percentage of males in sales and office occupations:
Here: 8.2% city: 11.0%
- Percentage of males in construction, extraction, and maintenance occupations:
Here: 6.8% city: 5.5%
- Percentage of males in material moving occupations:
Here: 2.7% city: 2.0%
Occupations of females:
- Percentage of females in management occupations (except farmers):
Here: 18.0% city: 15.9%
- Percentage of females in business and financial operations occupations:
Here: 15.2% city: 13.4%
- Percentage of females in life, physical, and social science occupations:
Here: 2.2% city: 2.4%
- Percentage of females in community and social services occupations:
Here: 6.4% city: 2.1%
- Percentage of females in legal occupations:
Here: 8.5% city: 5.8%
- Percentage of females in education, training, and library occupations:
Here: 14.4% city: 8.7%
- Percentage of females in arts, design, entertainment, sports, and media occupations:
Here: 2.5% city: 4.0%
- Percentage of females in healthcare practitioners and technical occupations:
Here: 4.0% city: 5.6%
- Percentage of females in service occupations:
Here: 10.8% city: 16.5%
- Percentage of females in sales and office occupations:
Here: 16.2% city: 15.5%
Percentage of people 16-64 in Armed Forces:
| Bradlee (Farlington): | 1.6% |
| Alexandria: | 3.8% |
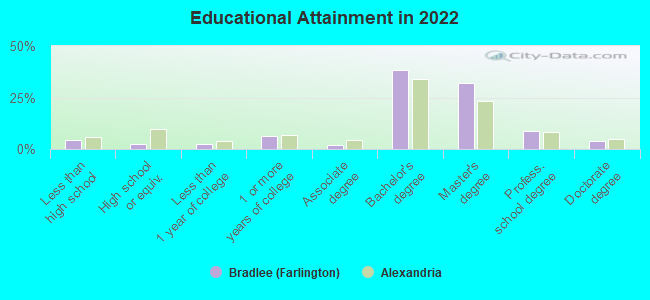
Education in this neighborhood (subdivision or community):
- Percentage of people 3 years and older in K-12 schools:
Bradlee (Farlington): 20.6% Alexandria: 11.9%
- Percentage of people 3 years and older in undergraduate colleges:
Bradlee (Farlington): 5.4% Alexandria: 2.7%
- Percentage of people 3 years and older in grad. or professional schools:
Bradlee (Farlington): 5.2% Alexandria: 3.8%
- Percentage of students K-12 enrolled in private schools:
Bradlee (Farlington): 36.9% Alexandria: 15.4%
Percentage of population below poverty level:
| Bradlee (Farlington): | 2.7% |
| Alexandria: | 8.1% |
Median year owner moved in (as recorded in 2022):
| Bradlee (Farlington): | 2008 |
| Alexandria: | 2013 |
Percentage of married-couple families with both working:
| Bradlee (Farlington): | 103.8% |
| Alexandria: | 81.2% |
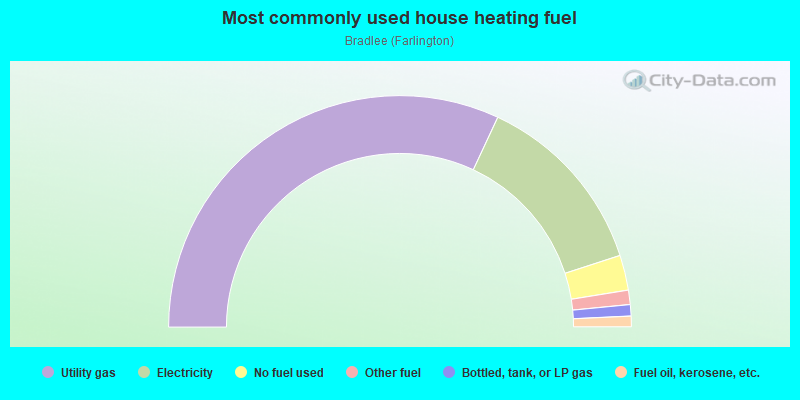
- 63.9%Utility gas
- 26.1%Electricity
- 4.9%No fuel used
- 2.0%Other fuel
- 1.6%Bottled, tank, or LP gas
- 1.5%Fuel oil, kerosene, etc.
Highways in this neighborhood:
State Rte 7 (King St)
Length: 0.08 miles
Direction: SE-NW
Address range: 3400 to 3498
Direction: SE-NW
Address range: 3400 to 3498
Roads and streets:
W Braddock Rd
Length: 0.43 miles
Direction: E-W
Address range: 1600 to 3613
Direction: E-W
Address range: 1600 to 3613
Kenwood Ave
Length: 0.36 miles
Directions: N-S, SW-NE
Address range: 1600 to 2731
Directions: N-S, SW-NE
Address range: 1600 to 2731
Braddock Pl
Length: 0.22 miles
Directions: E-W, N-S, SE-NW, SW-NE
Address range: 1700 to 1799
Directions: E-W, N-S, SE-NW, SW-NE
Address range: 1700 to 1799
Osage St
Length: 0.15 miles
Direction: E-W
Address range: 1600 to 1799
Direction: E-W
Address range: 1600 to 1799
Radford St
Length: 0.15 miles
Direction: N-S
Address range: 1300 to 1665
Direction: N-S
Address range: 1300 to 1665
Marlee Way
Length: 0.13 miles
Directions: N-S, SW-NE
Directions: N-S, SW-NE
Fern St
Length: 0.12 miles
Directions: E-W, N-S, SE-NW, SW-NE
Address range: 1600 to 1699
Directions: E-W, N-S, SE-NW, SW-NE
Address range: 1600 to 1699
Kingsgate Ct
Length: 0.08 miles
Direction: E-W
Address range: 1700 to 1745
Direction: E-W
Address range: 1700 to 1745
Peach St
Length: 0.06 miles
Direction: E-W
Address range: 1600 to 1699
Direction: E-W
Address range: 1600 to 1699